1254
In-vivo T1 mapping for quantitative evaluation of intracranial atherosclerotic plaques1Center for Biomedical Imaging Research, Tsinghua University, Beijing, China, 2Department of Radiology, Union Hospital, Tongji Medical College, Huazhong University of Science and Technology, Wuhan, China, 3Hubei Province Key Laboratory of Molecular Imaging, Wuhan, China
Synopsis
Keywords: Quantitative Imaging, Atherosclerosis
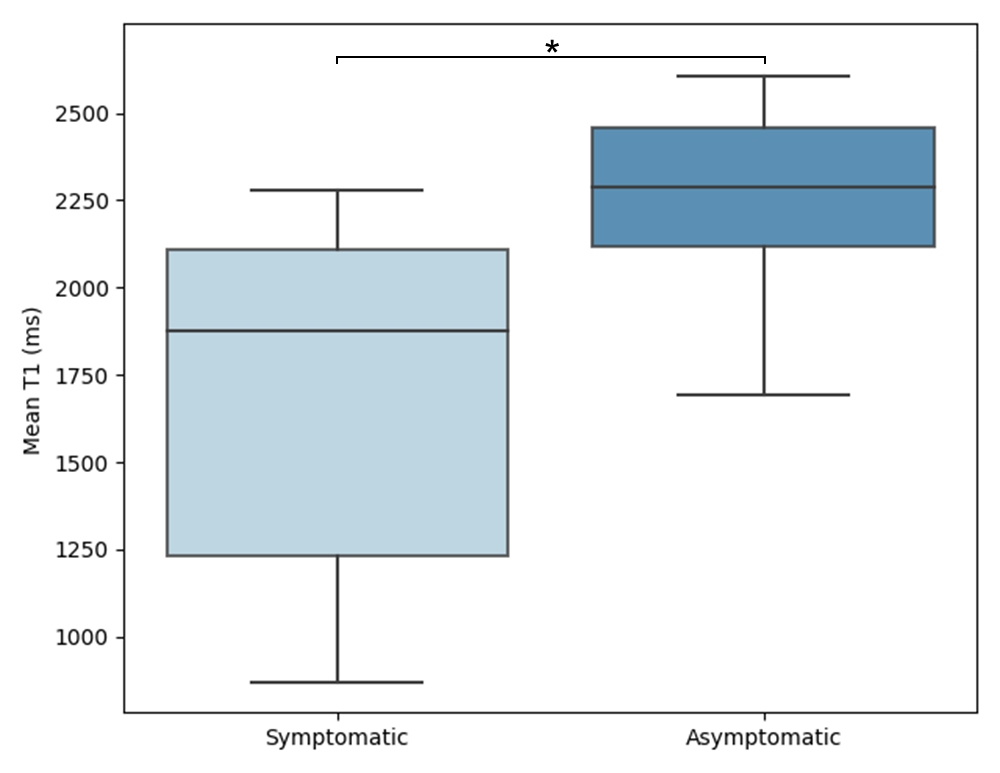
T1 mapping could provide more reliable quantitative measurements of plaques than traditional T1w MR images. In this study, the feasibility of in vivo quantitative T1 mapping of intracranial plaque had been demonstrated for the first time using a 3D SNAP with golden angle radial k-space sampling (GOAL-SNAP) sequence. Symptomatic patients showed significantly lower intraplaque T1 values than asymptomatic patients (1695.21 ± 493.23 vs. 2241.76 ± 300.28 ms, p=0.045). Quantifying plaque T1 values and enhancement through 3D GOAL-SNAP T1 mapping images is promising for characterizing the symptomatic plaques, serving as one potential tool for further plaque analysis.Introduction
Intracranial atherosclerosis is one of the major causes of stroke1, 2, and high-resolution MR techniques enabled imaging of intracranial atherosclerotic plaques in vivo3. Previous studies have mostly focused on luminal stenosis, plaque burden, and relative plaque enhancement4, 5. Given the small size of intracranial vessel walls and the long acquisition time of conventional multi-weighted MR vessel wall images, in-vivo T1 values of intracranial plaques have rarely been reported. A 3D SNAP with golden angle radial k-space sampling (GOAL-SNAP)6 sequence for measuring T1 values of carotid vessel wall showed capability in characterizing vulnerable carotid plaques7. We extended this sequence to intracranial vessel walls and generated in-vivo pre- and post-contrast T1 mapping to quantitatively evaluate the intracranial plaques in symptomatic and asymptomatic patients.Methods
Study Population and Data AcquisitionThis study was approved by the local institutional review board with all patients having provided written informed consent. Patients with middle cerebral artery (MCA) atherosclerotic plaques were included in this study.
Intracranial arteries of all subjects were imaged on a 3T scanner (Ingenia CX, Philips Healthcare, Best, The Netherlands) with a 32-channel head coil. Axial 3D time-of-flight (TOF) MR angiography was performed to identify the location of the MCA stenosis. 3D T1-weighted black-blood turbo-spin-echo sequence with variable flip angles (T1-VISTA) and 3D T1 mapping (GOAL-SNAP) images were acquired both before and after the administration of gd. The imaging parameters are presented in Table 1. Contrast-enhanced (CE) T1-VISTA, GOAL-SNAP, and CE GOAL-SNAP images were rigidly registered to the T1-VISTA images using the ANTsPy python package (Figure 1).
Plaque Analysis
The most stenotic lesion of each patient was chosen for quantitative comparative analysis. Manual delineation of the 2D plaques was performed on the T1-VISTA images using CASCADE8 software (UW, Seattle, Washington, USA) . Then the mean pre-contrast T1 values of each plaque were calculated.
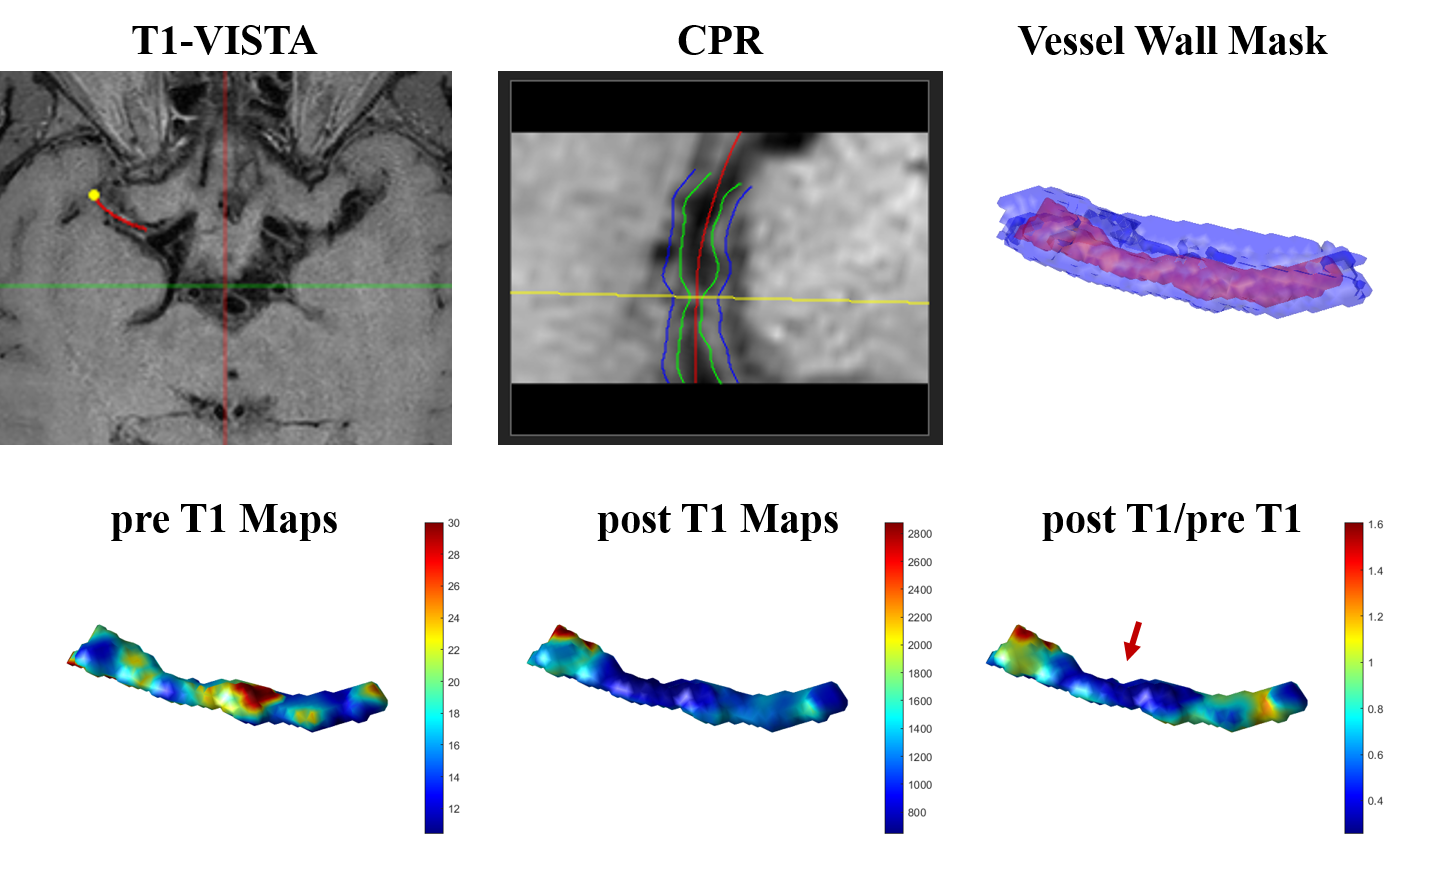
The feasibility of in-vivo 3D T1 maps was also assessed. Delineations of the 3D intracranial atherosclerotic plaques were performed on custom-designed software 3D CASCADE (Tsinghua University, Beijing, China). The start and end points of the diseased artery segments were specified and the artery centerline of each segment was manually drawn. Next, a successive sequence of vessel cross-sectional slices centered at the centerline was reconstructed via MPR for each segment. The lumen and outer wall boundaries were manually delineated on these consecutive 2D cross-sectional images. The 3D intracranial vessel wall mask was then generated using the Visualization Toolkit (VTK)9 through vtkSurfaceReconstructionFilter and vtkPolyDataToImageStencil functions (Figure 4). 3D pre- and post-contrast T1 maps were generated according to the 3D intracranial vessel wall mask. 3D enhancement maps (post T1/pre T1) were also calculated.
Statistical Analysis
Continuous variables were described as mean ± standard deviation and categorical variables were described as count (percentage). Mann-Whitney U tests were used to compare the intraplaque mean T1 values between symptomatic and asymptomatic patients. All statistical analyses were performed using SPSS 24.0 (IBM). P values < 0.05 were considered statistically significant.
Results
Sixteen patients (46.81 ± 12.19 years; 13 males) were recruited in this study, including 10 symptomatic patients and 6 asymptomatic patients. Figure 2 showed two plaques with similar signal intensity on T1-VISTA images while T1 values of the symptomatic plaque were considerably lower than those of the asymptomatic plaque. Symptomatic patients showed significantly lower intraplaque pre-contrast T1 value than asymptomatic patients (1695.21 ± 493.23 vs. 2241.76 ± 300.28 ms, p=0.045) (Figure 3). 3D pre- and post-contrast T1 maps were generated according to the 3D intracranial vessel wall mask (Figure 4). The 3D enhancement map (post T1/pre T1) indicated a clear change of T1 values at the most stenotic site after administration of gd (Figure 4, red arrow).Discussion and Conclusion
To the best of our knowledge, this study was the first one to investigate the T1 values of in-vivo intracranial atherosclerotic plaques. T1 mapping may provide more reliable quantitative measurements of plaques than traditional T1w MR images. Compared with the conventional variables such as luminal stenosis and plaque burden, quantitative T1 values of intracranial atherosclerotic plaques provided an additional value in distinguishing symptomatic and asymptomatic patients. And the use of 3D imaging data could better characterize plaque features, providing a visual description and quantitative changes of vessel segments of interest. Quantifying plaque T1 values and enhancement through 3D GOAL-SNAP T1 mapping images is promising for characterizing the symptomatic plaques. More patients will be recruited for further validation.Acknowledgements
None.References
1. Thijs VN, Albers GW. Symptomatic intracranial atherosclerosis: outcome of patients who fail antithrombotic therapy. Neurology 2000; 55(4):490-498.
2. Wang Y, Zhao X, Liu L, et al. Prevalence and outcomes of symptomatic intracranial large artery stenoses and occlusions in China: the Chinese Intracranial Atherosclerosis (CICAS) Study. Stroke 2014; 45(3):663-669.
3. Mandell D, Mossa-Basha M, Qiao Y, et al. Intracranial vessel wall MRI: principles and expert consensus recommendations of the American Society of Neuroradiology. American Journal of Neuroradiology 2017; 38(2):218-229.
4. Song JW, Pavlou A, Xiao J, et al. Vessel wall magnetic resonance imaging biomarkers of symptomatic intracranial atherosclerosis: a meta-analysis. Stroke 2021; 52(1):193-202.
5. Gupta A, Baradaran H, Al‐Dasuqi K, et al. Gadolinium enhancement in intracranial atherosclerotic plaque and ischemic stroke: a systematic review and meta‐analysis. Journal of the American Heart Association 2016; 5(8):e003816.
6. Qi H, Sun J, Qiao H, et al. Carotid intraplaque hemorrhage imaging with quantitative vessel wall T1 mapping: technical development and initial experience. Radiology 2018; 287(1):276.
7. Qiao H, Li D, Cao J, et al. Quantitative evaluation of carotid atherosclerotic vulnerable plaques using in vivo T1 mapping cardiovascular magnetic resonaonce: validation by histology. Journal of Cardiovascular Magnetic Resonance 2020; 22(1):1-11.
8. Kerwin W, Xu D, Liu F, et al. Magnetic resonance imaging of carotid atherosclerosis: plaque analysis. Topics in Magnetic Resonance Imaging 2007; 18(5):371-378.
9. Schroeder WJ, Avila LS, Hoffman W. Visualizing with VTK: a tutorial. IEEE Computer graphics and applications 2000; 20(5):20-27.
Figures

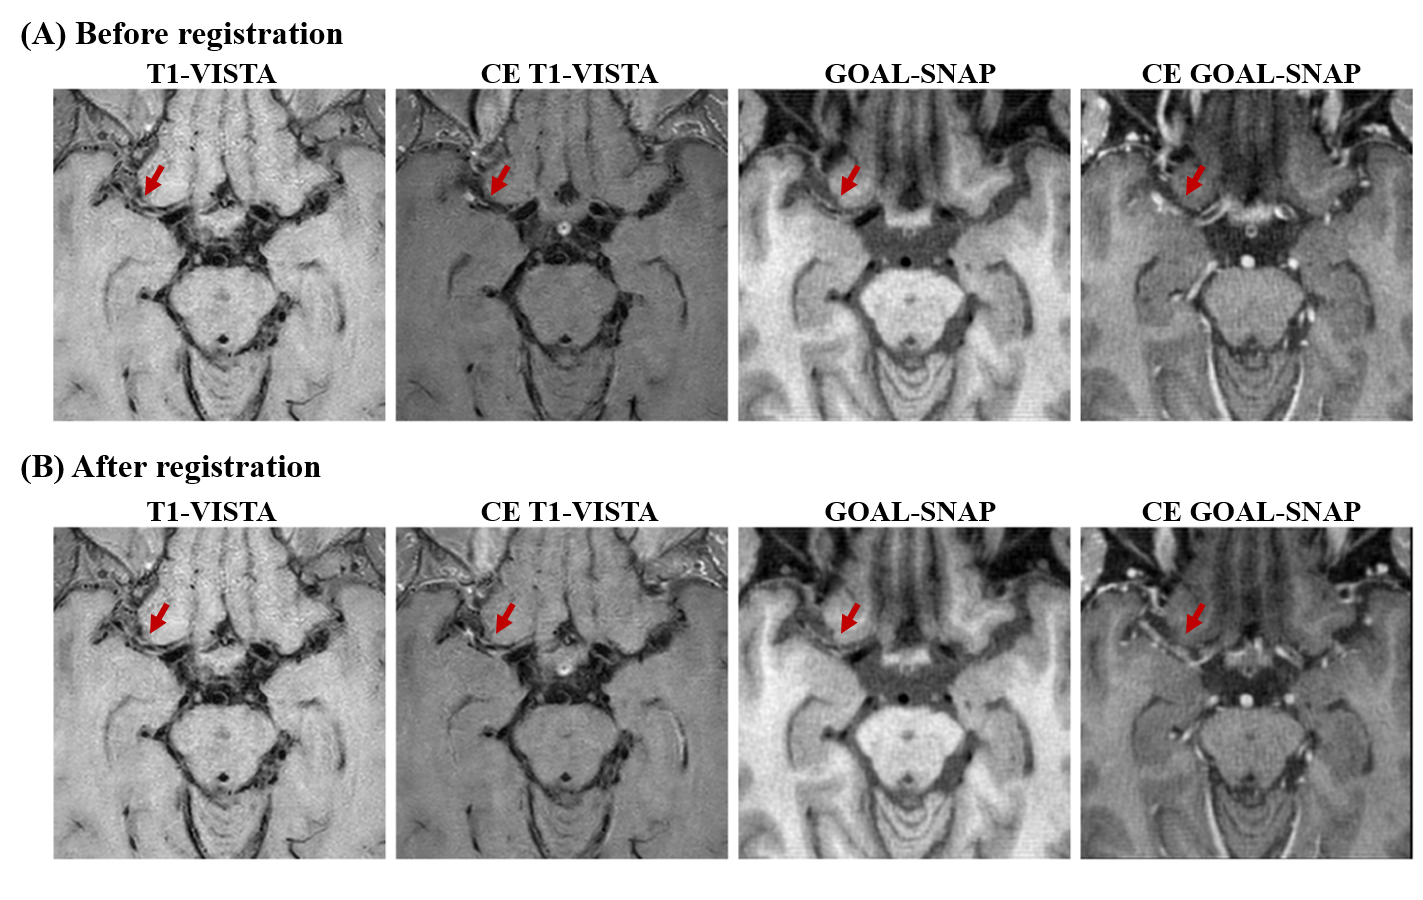
Figure 1. Rigid registration. CET1w-VISTA, GOAL-SNAP, and CE GOAL-SNAP images were rigidly registered to the T1-VISTA images using the ANTsPy python package.
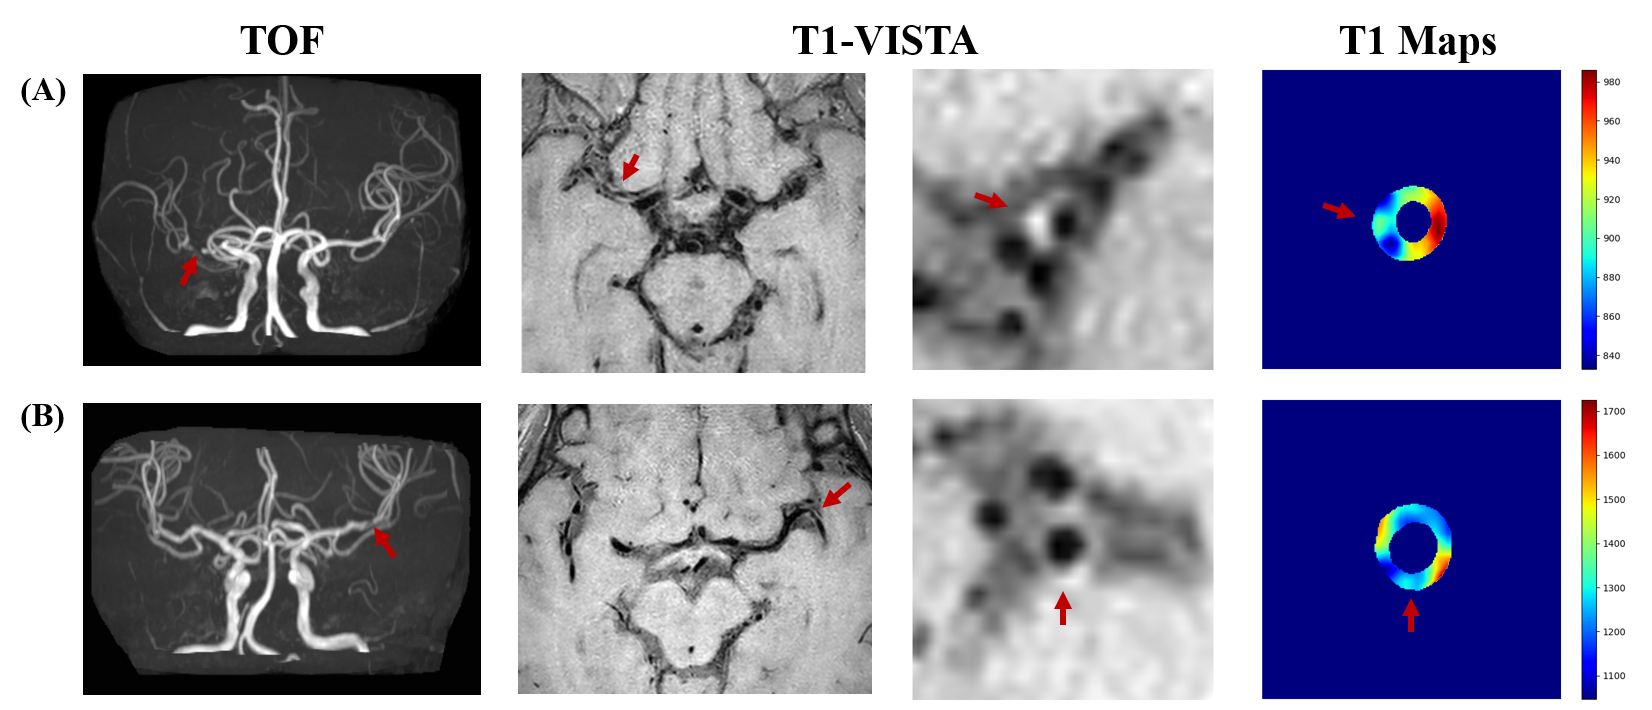
Figure 2. High-resolution MR images and T1 maps showing intracranial atherosclerotic plaques. (A) A 58-year-old female symptomatic patient. (B) A 40-year-old male asymptomatic patients. TOF demonstrated the stenosis located at MCA. T1-VISTA at the most stenotic site visualized the plaque and the quantitative T1 map were shown on the right. T1 values of the symptomatic plaque were considerably lower than those of the asymptomatic plaque despite the signal intensity on T1-VISTA images of the two plaques being similar.