1253
Association analysis of age-dependent changes in R1map at the brain region level with gene expression patterns1Fudan University, Shanghai, China
Synopsis
Keywords: Quantitative Imaging, Quantitative Imaging
Quantitative MRI can observe biologically distinct microstructural processes that shows great potential in aging research. In this work, we studied the trajectories of R1map changes in aging brain and found R1map regions with significant changes in different age groups (young, middle-aged, and elderly groups). Graph theoretical analysis of covariance networks revealed global clustering coefficient of youth group is higher than that of middle-aged and elderly groups. Association analysis of spatial gene expression patterns with changes in R1map at the brain region level reveal that the Kyoto Encyclopedia of Genes and Genomes (KEGG) pathway is mainly enriched in various neurodegenerative diseases.Introduction
Quantitative MRI (qMRI) quantitatively determines tissue parameters, enabling detection of microstructural processes associated with tissue in neurological diseases, which shows great potential in aging research. Unlike measuring brain atrophy through structural imaging, qMRI allows the study of biologically distinct microstructural processes that precede changes in brain volume. As a fundamental MR property of brain tissues, T1 has been associated with aging brain in many studies. T1 changes more in white matter (WM) than in gray matter (GM) with age [1]. Okubo et al [2] found that T1 decreases significantly in the ventral-inferior putamen and nucleus accumbens, while significantly increase in thalamus and WM. In this work, we aim to explore the trajectory of R1map in aging brain. We extracted R1 value at brain region level based on AAL3 brain template [4] and constructed qMRI covariance networks [5] to show the significance of R1map in brain with age. Furthermore, we investigated the association of age-dependent changes in R1map at the brain region level with spatial gene expression patterns using gene expression transcript information from the Allen Human Brain Atlas (AHBA) [6].Materials and Methods
ParticipantsWe used R1 data from the AHEAD lifespan project [8]. All 105 subjects were divided into three groups: youth group (age from 18 to 30 years elderly, n=42), middle-aged group (age from 31 to 60 years elderly, n=37) and elderly group (age from 61 to 80 years elderly).
MRI data processing
Rigid co-registration was performed between AAL3 template [4] and R1map data using SPM12 (http://www.fil.ion.ucl.ac.uk/spm/software/spm12/) for MATLAB 2021b (MathWorks, Natick, USA). With the labels of the template, R1map value in each brain regions were averaged. Each region’s R1 value was compared by ANOVA and Cohen’s d effect sizes. Pairwise comparison test was performed using Tukey’s honestly significant difference procedure to compare each region in three groups.
Covariance networks
Inspired by structural networks [5], intra-individual quantification covariance network was performed. Inter-regional quantification association matrices were generated for each subject from each region’s R1map value of Fisher's Z-score transformation. In network matrix, an individual entry Ri,j (with regions i and j) contained the pairwise cross-correlation coefficient of quantification values [9].
Network properties
Covariance networks were threshelderlyed (density K = 0.03–0.50, interval of 0.01) to eliminate influence of low-level correlations [10]. We computed three global graph metrics including normalized clustering coefficient, normalized path length and their ratio (small-world index). For the nodal regional analyses, covariance networks were constructed at a density of K = 0.05 based on network connectedness criterion.
Transcriptomic associations
Using gene expression transcript information from the AHBA, microarray expression data were generated using abagen [10]. Using the R package limma [11] to conduct differential expression analyses. Then we performed KEGG [3] analysis to obtain differential gene signal pathway and gene enrichment information.
Results and Discussion
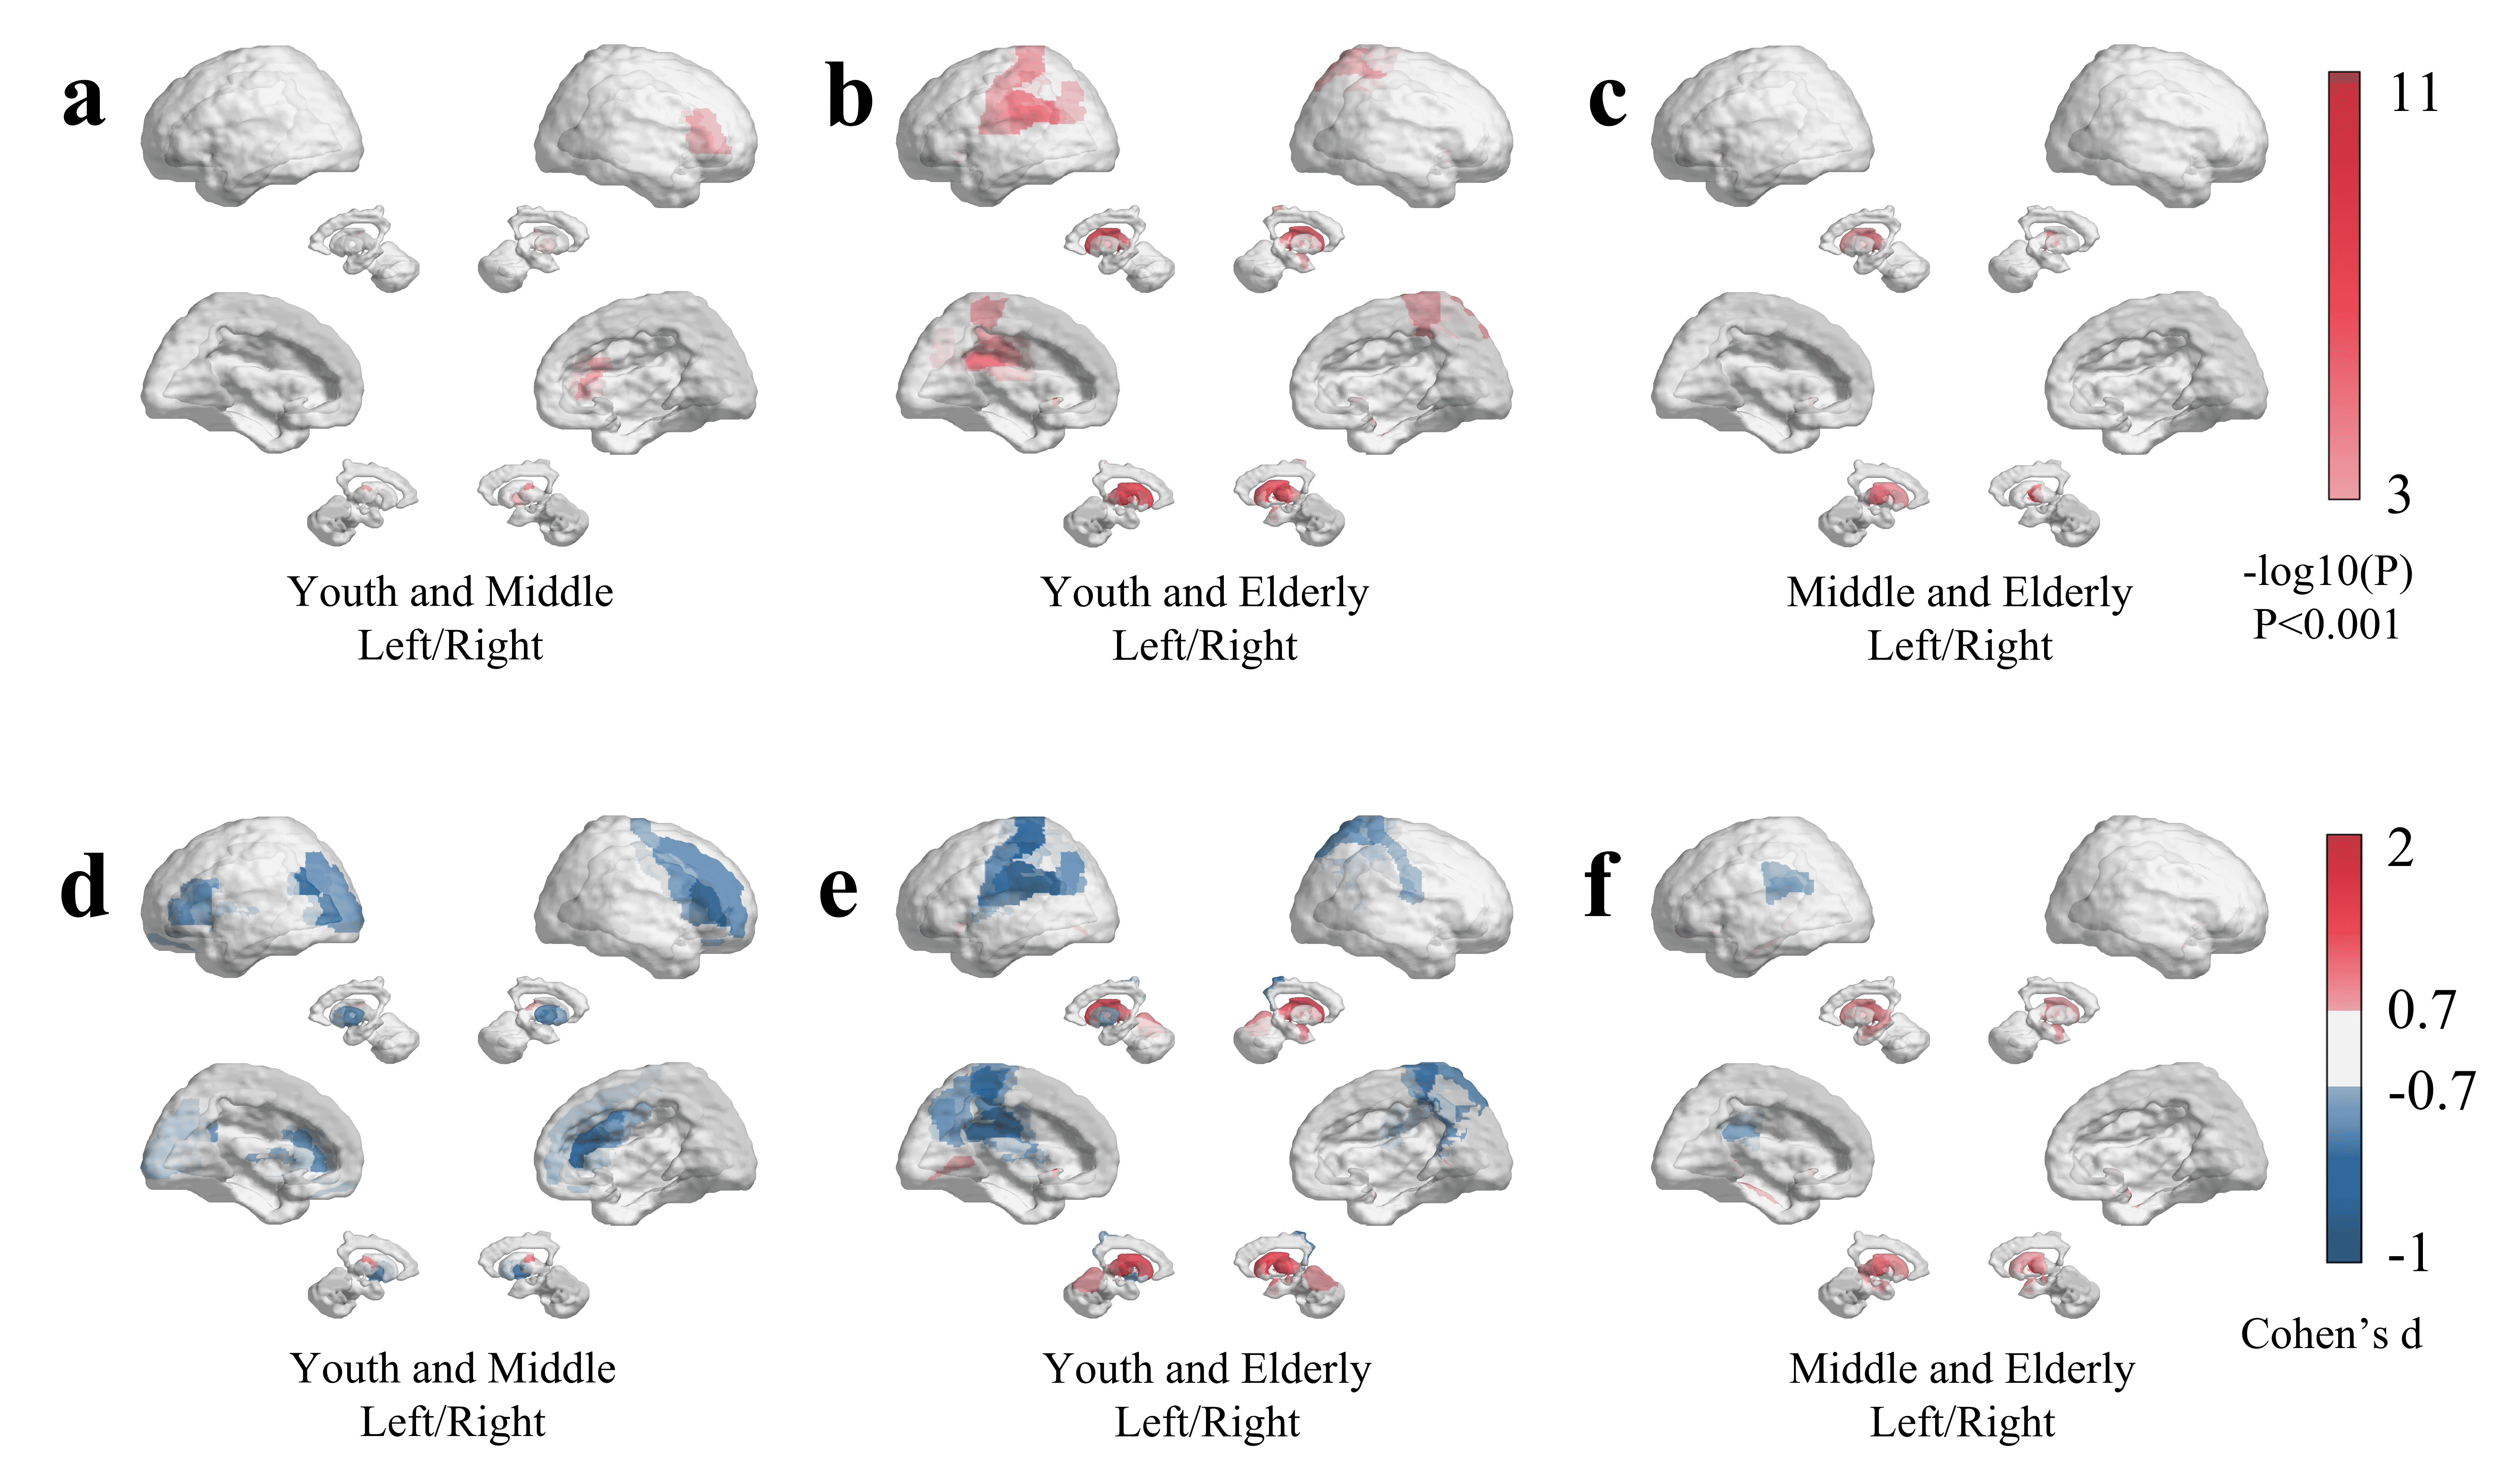
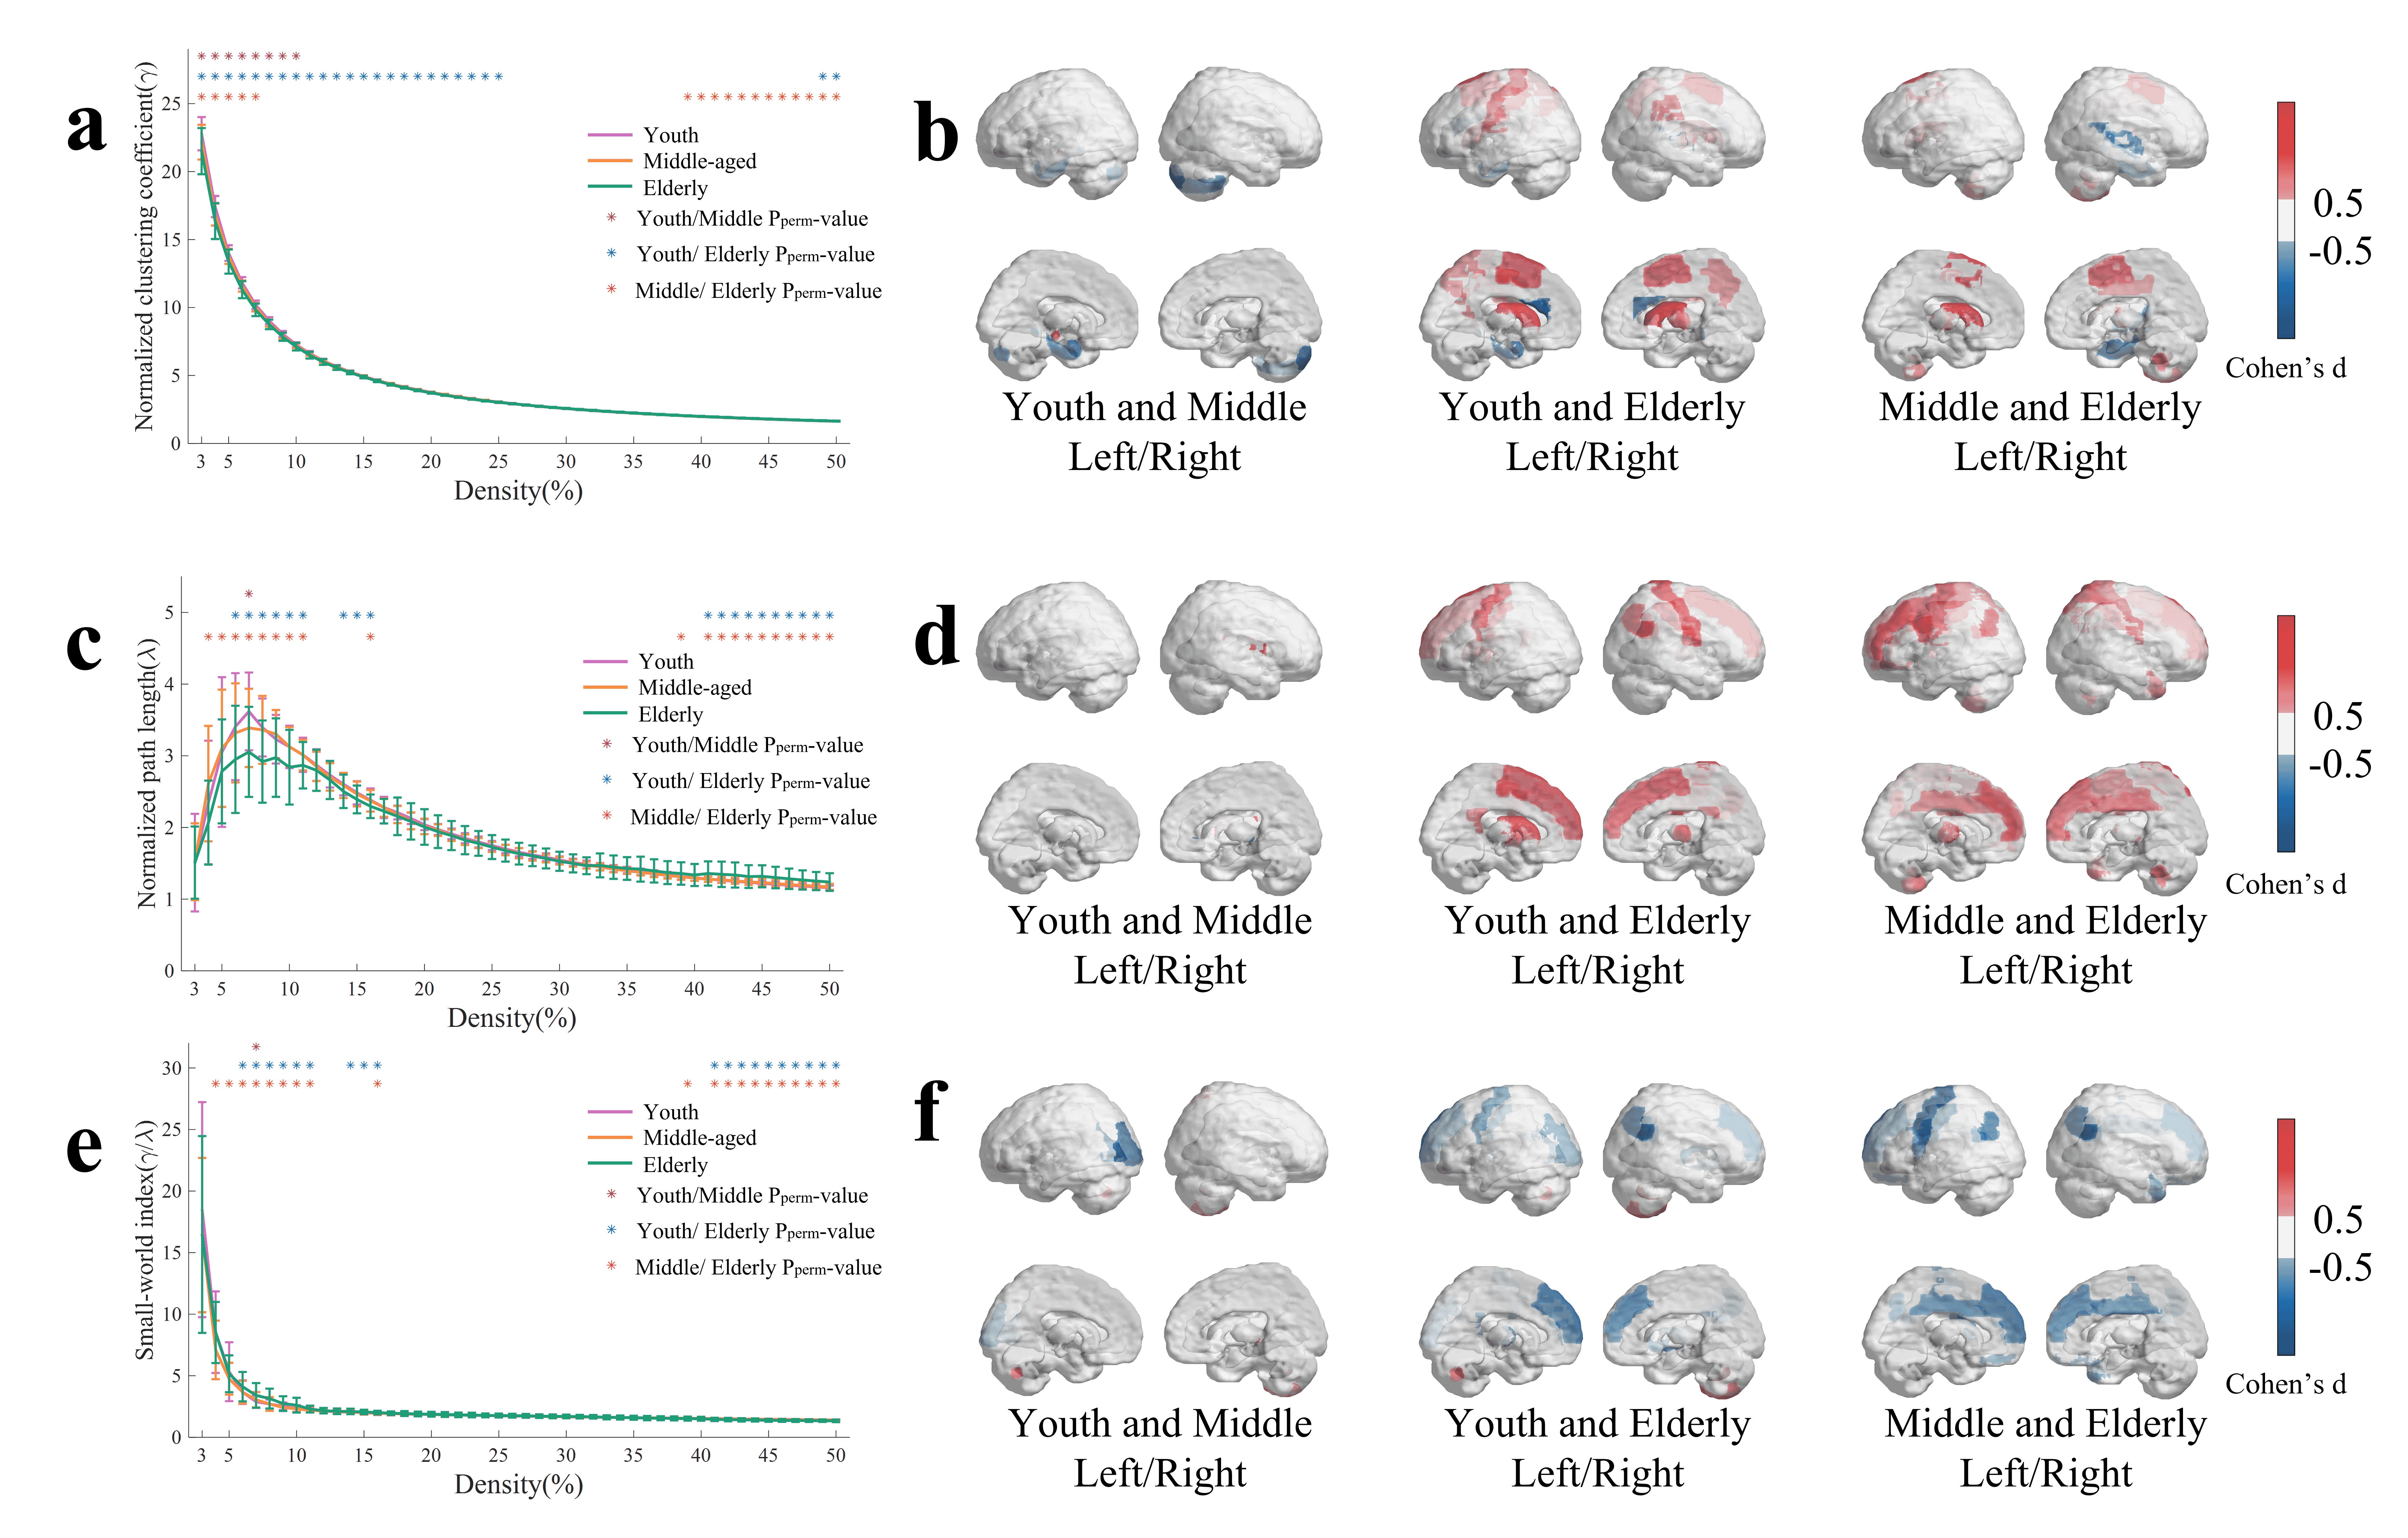
To investigate the significant R1map changes of brain regions with age in three groups, we performed ANOVA, pairwise comparison test, and Cohen’s d effect size over brain regions (Figure 1). Figure 1a shows that R1 in pallidum and thalamus in youth group and middle-aged group are significant different (p < 0.001). As shown in Figure 1b more significant different brain regions (thalamus, caudate nucleus, amygdala, postcentral gyrus, and paracentral lobule) are observed in youth group and elderly group (p <0.001). Figure 1c shows that R1 in thalamus and caudate nucleus in middle-aged group and elderly age group are significant different (p < 0.001). As shown in Figure 1(d, e, f), results from regional Cohen’s d effect sizes provided more brain regions that R1map are different in the three groups, including inferior frontal gyrus in youth age and middle-age group, putamen in youth age and elderly age group.To characterize the topology of covariance networks, based on R1map, we computed three graph-theoretical parameters at global level (Figure 2a, c, e) and at nodal level (Figure 2b, d, f). Figure 2a shows that in the range of the network density K from 0.03 to 0.10, global normalized clustering coefficient in youth group is higher than that of middle-aged group and elderly group (Pperm<0.05). The thalamus is demonstrated as a susceptible brain region showing significant change in all three groups (Figure 2b). Figure 2c shows that normalized path length first increases and then decreases with the increase of network density K in all groups. Figure 2d shows that path length in elderly group is significant lower than youth age and middle-aged group (Pperm<0.05). As shown in Figure 2e and 2f, the small-world index in the elderly group’s is higher than that in youth age and middle-aged groups.
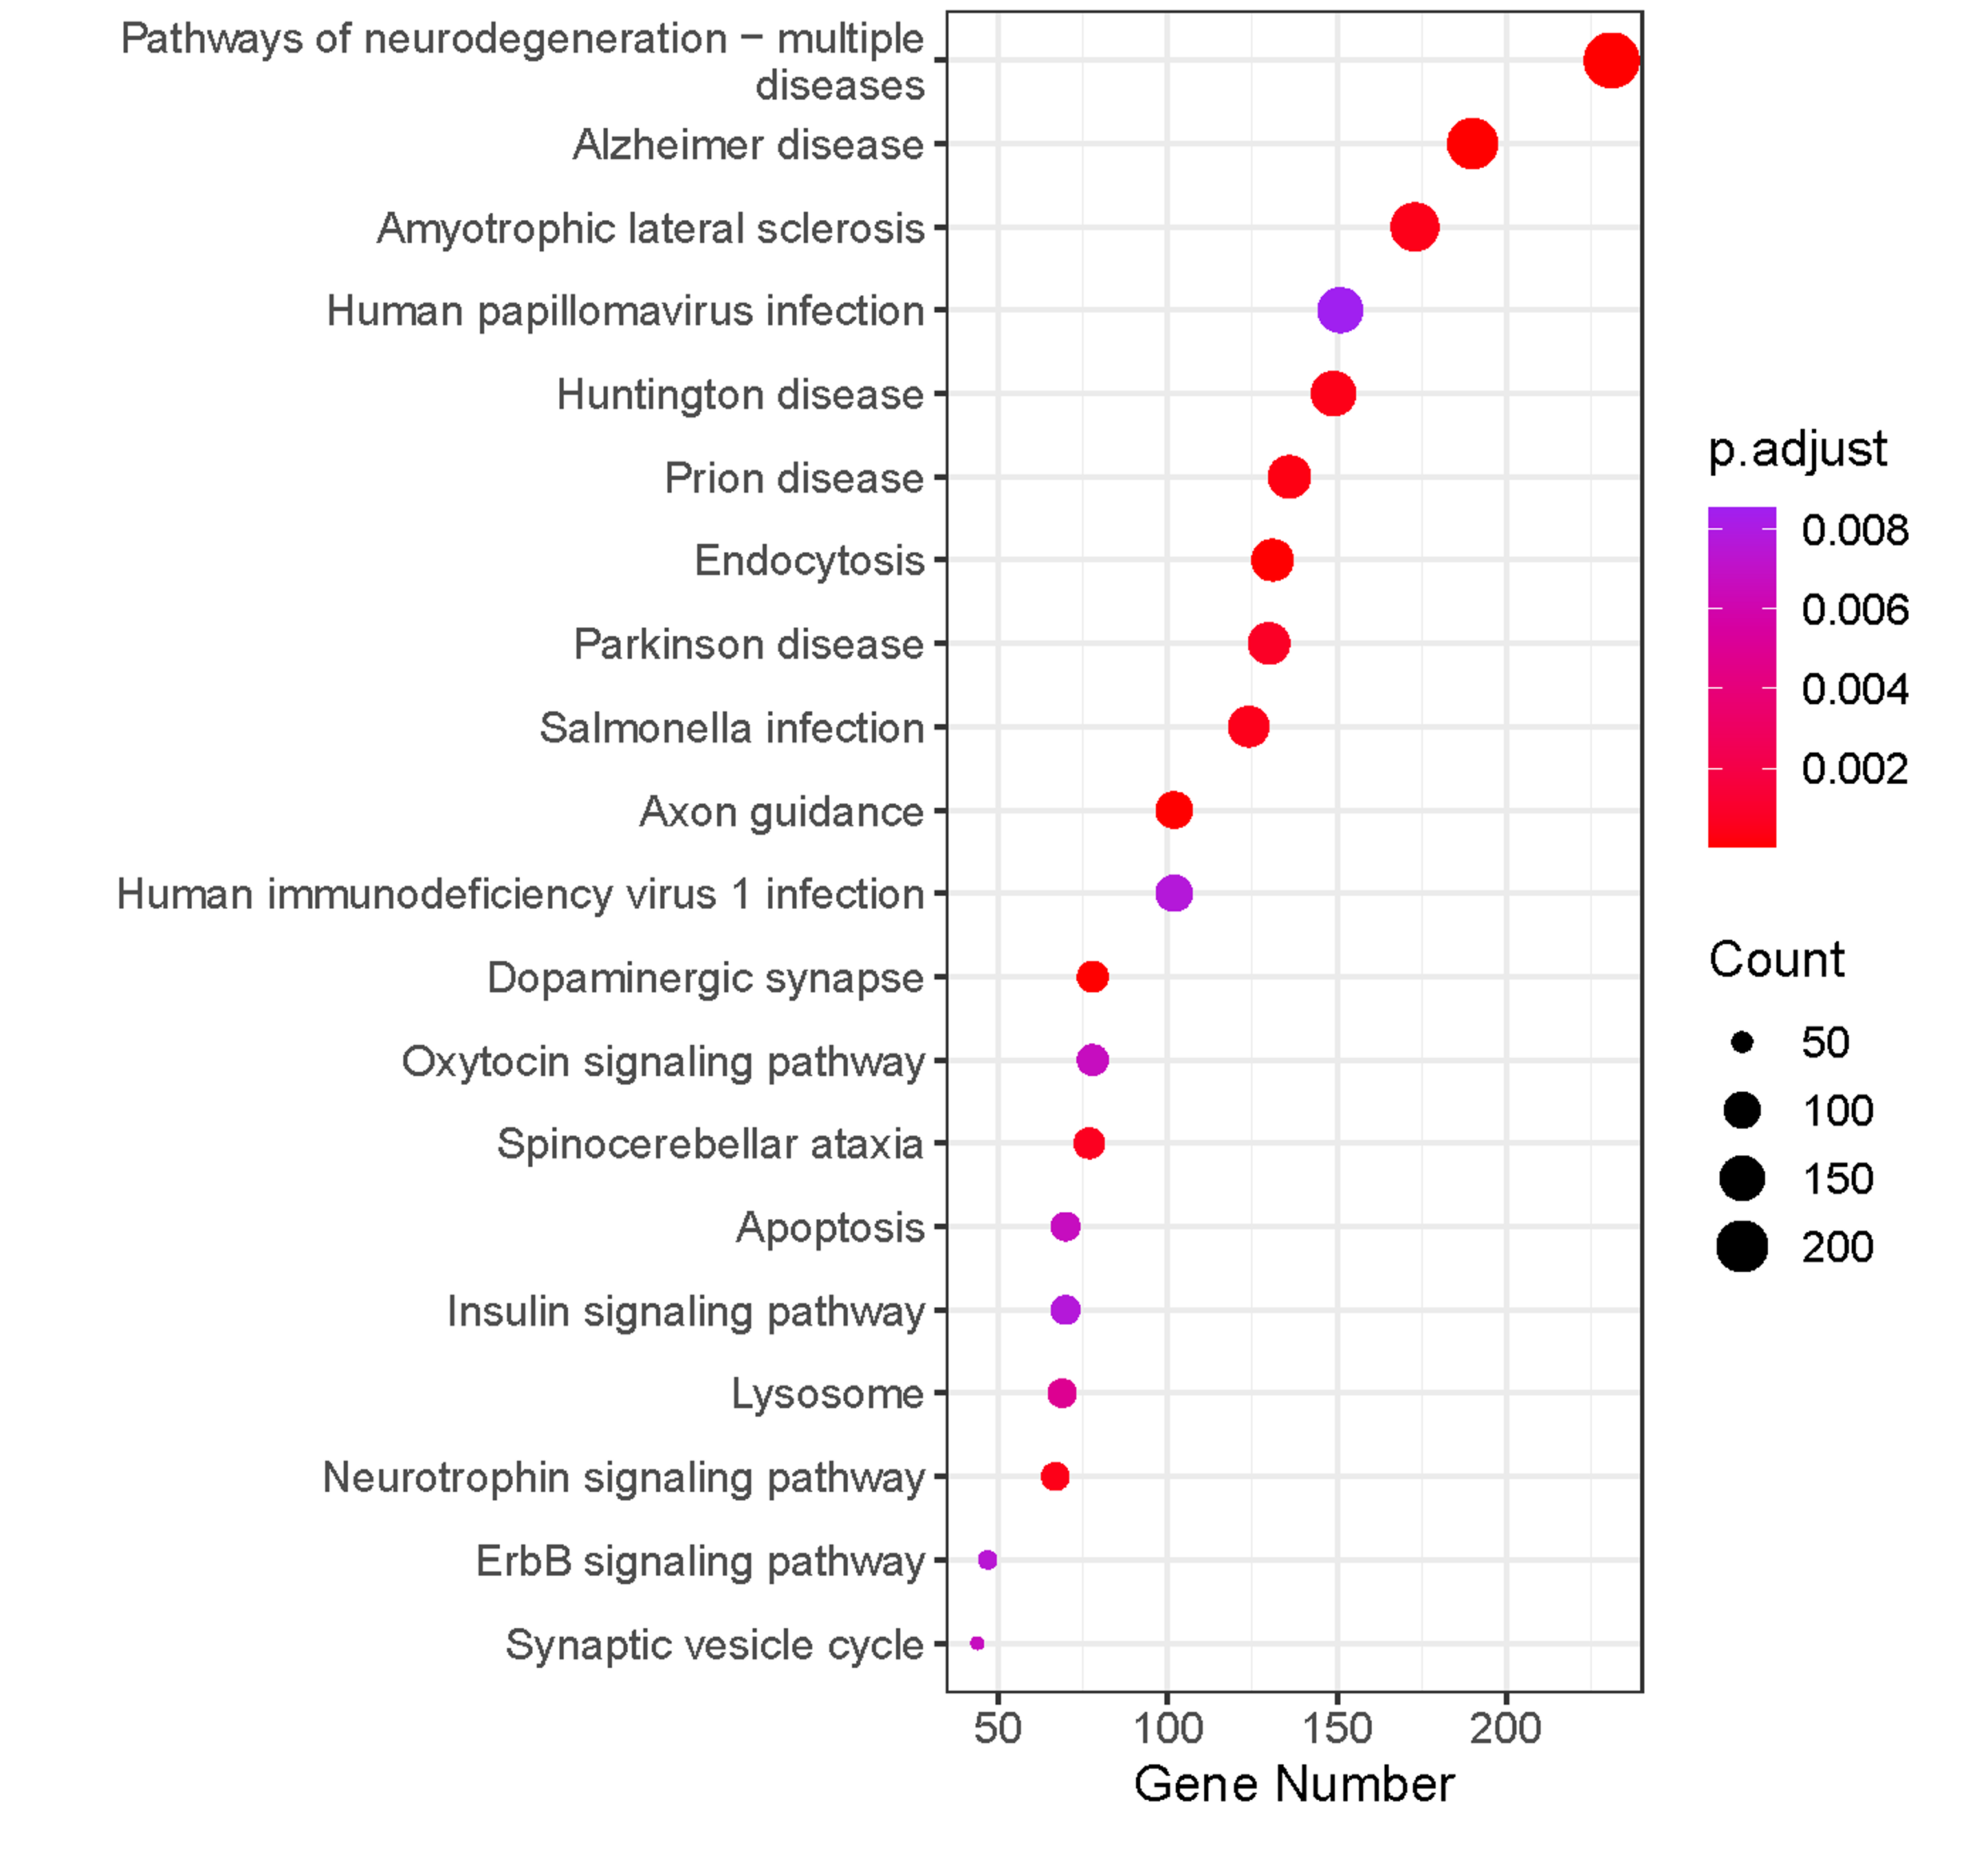
Further, to study the association of gene expression with above multivariate alterations in three groups, we evaluated the spatial expression patterns of genetic factors in those brain regions. Figure 3 shows that KEGG pathway is mainly enriched in various neurodegenerative diseases, such as Alzheimer disease and Huntington disease.
Conclusion
We studied the trajectories of R1map changes in the aging brain and found brain regions with significant changes in R1map in different age groups. Association analysis of spatial gene expression patterns with changes in R1map at the brain region level reveal that the KEGG pathway is mainly enriched in various neurodegenerative diseases.Acknowledgements
This work was supported in part by grants from the National Natural Science Foundation of China (81873893), Shanghai Municipal Science and Technology Major Project (No.2018SHZDZX01), ZJLab, and Shanghai Center for Brain Science and Brain-Inspired Technology.References
1. Hagiwara A, Fujimoto K, Kamagata K, et al. Age-related changes in relaxation times, proton density, myelin, and tissue volumes in adult brain analyzed by 2-dimensional quantitative synthetic magnetic resonance imaging. Invest Radiol. 2021;56(3):163-172.
2. Okubo G, Okada T, Yamamoto A, et al. Relationship between aging and T1 relaxation time in deep gray matter: a voxel-based analysis. J Magn Reson Imaging. 2017;46(3):724-731.
3. Liu P, Wu L, Peng G, et al. Altered microbiomes distinguish Alzheimer’s disease from amnestic mild cognitive impairment and health in a Chinese cohort. Brain, behavior, and immunity, 2019, 80: 633-643.
4. Rolls E T, Huang C C, Lin C P, et al. Automated anatomical labelling atlas 3. Neuroimage, 2020, 206: 116189.
5. Yun J Y, Boedhoe P S W, Vriend C, et al. Brain structural covariance networks in obsessive-compulsive disorder: a graph analysis from the ENIGMA Consortium. Brain, 2020, 143(2): 684-700.
6. Shen E H, Overly C C, Jones A R. The Allen Human Brain Atlas: comprehensive gene expression mapping of the human brain. Trends in neurosciences, 2012, 35(12): 711-714.
7. Hawrylycz M J, Lein E S, Guillozet-Bongaarts A L, et al. An anatomically comprehensive atlas of the adult human brain transcriptome. Nature, 2012, 489(7416): 391-399.
8. Alkemade A, Mulder M J, Groot J M, et al. The Amsterdam Ultra-high field adult lifespan database (AHEAD): A freely available multimodal 7 Tesla submillimeter magnetic resonance imaging database. NeuroImage, 2020, 221: 117200.
9. Larivière S, Royer J, Rodríguez-Cruces R, et al. Structural network alterations in focal and generalized epilepsy assessed in a worldwide ENIGMA study follow axes of epilepsy risk gene expression. Nat Commun. 2022;13(1):1-16.
10. Markello R D, Arnatkeviciute A, Poline J B, et al. Standardizing workflows in imaging transcriptomics with the abagen toolbox. Elife, 2021, 10: e72129.
11. Ritchie M E, Phipson B, Wu D I, et al. limma powers differential expression analyses for RNA-sequencing and microarray studies. Nucleic acids research, 2015, 43(7): e47-e47.
Figures