1250
Site Effects in Multisite Fetal Brain MRI: a Morphological Study of Early Brain Development1Department of Biomedical Engineering, College of Biomedical Engineering & Instrument Science, Zhejiang University, Hangzhou, China, 2School of Biomedical Engineering & Imaging Sciences, Faculty of Life Sciences and Medicine, King’s College London, London, United Kingdom, 3Department of Radiology, Beijing Hospital, National Center of Gerontology, Institute of Geriatric Medicine, Chinese Academy of Medical Sciences, P.R. China., Beijing, China, 4Department of Radiology, Shandong Provincial Hospital Affiliated to Shandong First Medical University, Jinan, China, 5Department of Radiology, Sir Run Run Shaw Hospital, Zhejiang University School of Medicine, Hangzhou, China, 6Dalian Municipal Women and Children’s Medical Center (Group), Dalian, China, 7Department of Radiology, Women’s Hospital, Zhejiang University School of Medicine, Hangzhou, China
Synopsis
Keywords: Fetal, Brain, Multisite; morphological development; harmonization; cortical thickness
Studies have shown that the non-biological site-related effects may induce bias in multisite neuroimaging studies among adults and adolescents. It is unknown how site effects would affect the analysis of fetal brain MRI and which acquisition factors are critical in quantitative analysis. In this study, we identified site effects, including manufacture, field strength, in-plane resolution, and slice-thickness on volume and cortical thickness measurements in normal fetuses. We also showed these site effects could be effectively removed with ComBat-GAM while preserving developmental pattern indicating that the harmonization procedure is necessary when combing multisite imaging data to study fetal brain morphological development.Introduction
In-utero fetal MRI plays an important role in the evaluation of normal or pathological brain development. Due to the challenges in fetal and maternal motions, sample size in fetal brain MRI studies is typically small and the findings are not always consistent1-4. Combining data collected from multiple sites may improve the reliability of the results, but a major drawback in multisite studies is the non-biological site-related effects. Several studies have shown that field strength, manufacture, and software upgrade, as well as the acquisition protocol can introduce the bias and variance in measurements of brain volume5,6 and cortical thickness7-9 in adults and adolescents. However, how the site effects affect analysis of fetal brain development remains unknown. Thus the purpose of this study is to investigate the key acquisition factors on volume and cortical thickness measurements in normal fetal brains.Materials and Methods
Data acquisition: We acquired healthy fetal brain MRI scans from four hospitals and the major site-specific acquisition factors were summarized in Table 1. Ethical approval was obtained from the Institutional Review Board at the local hospital. All participants provided written informed consent. Note that 122 healthy fetuses included in Shandong Provincial Hospital who underwent two MRI scans with different slice thickness were considered as two sites in the following analysis. All scans were obtained using T2-weighted fast spin-echo sequences (T2-HASTE imaging on Siemens or ssFSE sequence on GE) in multiple orthogonal axial, coronal and sagittal planes.Preprocessing: The same processing pipeline was used for all data (Figure 1). The 2D multi-slice stacks from multiple orientations went through the preprocessing pipeline to obtain the high-resolution 1 mm isotropic 3D volumes, including stack selection, brain extraction, bias field correction, slice-to-volume registration (SVR) and super resolution reconstruction (SRR) by NiftyMIC10. Regional segmentation of brain structures was performed using atlas-based segmentation based on SyN registration in ANTs11. Briefly, the fetal brain images were nonlinearly registered to the standard CRL atlas12 at corresponding gestational ages (GA) to obtain segmentations in the subject space, including the hippocampus, amygdala, thalamus, caudate, putamen, cerebellum, internal capsule, corpus callosum, and midbrain. Vertex-wise cortical thickness measurements were computed using the modified dHCP-structural-pipeline13 based on cortical segmentation using nnU-net14, which was combined with the DrawEM-derived labels15 to obtain regional thickness. All data were visually inspected for quality assurance before analyses.
Statistical analysis: In order to study the effects of field strength, manufacture, in-plane resolution, and slice thickness on volume and cortical thickness measurements, we applied generalized additive models (GAM) using restricted maximum likelihood with the GA as a potential nonlinear effect16 in R (https://www.r-project.org/). After fitting GAM models at each ROI, we used the false discovery rate (FDR) approach17 to correct for multiple comparisons across all ROIs.
For removal of the site effects, we used ComBat-GAM harmonization procedure18 to capture the age-related nonlinearity by fitting a GAM with a penalized smooth term, which was implemented with default settings and GA as biological variable as well as the only smooth term in the model (https://github.com/rpomponio/neuroHarmonize). The harmonized data underwent GAM again to evaluate the performance of ComBat-GAM.
Results
The influences of site effects on regional volumes are summarized in Table 2. GAM analysis revealed significant slice thickness effect on the volume of internal capsule which was larger from the 4 mm slice thickness data than that from 2 mm thickness (top row in Figure 2a-b). The volume of corpus callosum was significantly affected by field strength, which showed higher volume on 1.5T scanners compared to 3T (bottom row in Figure 2a-b). Manufacture and in-plane resolution showed no significant effects on regional volumes.Table 2 shows that the effect of in-plane resolution on cortical thickness was significant in almost all cortical regions, except for the cingulate gyrus and left insular cortex. The cortical thickness of the whole brain and hemispheres was higher at lower in-plane resolution (Figure 3a-b). The impact of in-plane resolution on cortical thickness varied between different cortical regions, with the strongest effect on the left occipital lobe (Figure 3d).
The site effects after ComBat-GAM harmonization were also presented in Table 2. Results demonstrated that all site effects were successfully removed for volume or cortical thickness (Figure 2c and Figure 3c).
Discussion and Conclusion
We investigated the effects of manufacture, field strength, in-plane resolution, and slice thickness on the regional volumes and cortical thickness of healthy fetuses across four centers. We found that the volume of subcortical brain structures was dependent on field strength and slice thickness, and thicker slices or lower field strength led to higher volume measurements. In contrast, cortical thickness was highly influenced by in-plane resolution, with lower resolution resulting in an overestimation of cortical thickness. ComBat-GAM can effectively remove nuisance variabilities associated with the acquisition while maintaining the age effects in volume and cortical thickness. Therefore, it is crucial to harmonize the data when analyzing multicenter fetal brain for morphological development.Acknowledgements
This work was supported by the Ministry of Science and Technology of the People’s Republic of China (2021ZD0200202, 2018YFE0114600), the National Natural Science Foundation of China (81971606, 82122032), and the Science and Technology Department of Zhejiang Province (202006140, 2022C03057).
References
1. Clouchoux C, Kudelski D, Gholipour A, et al. Quantitative in vivo MRI measurement of cortical development in the fetus. Brain Structure and Function. 2012;217(1): 127-139.
2. Habas P A, Scott J A, Roosta A, et al. Early Folding Patterns and Asymmetries of the Normal Human Brain Detected from in Utero MRI. Cereb Cortex. 2011;22(1): 13-25.
3. Rajagopalan V, Scott J, Habas P A, et al. Local Tissue Growth Patterns Underlying Normal Fetal Human Brain Gyrification Quantified In Utero. J Neurosci. 2011;31(8): 2878-2887.
4. Clouchoux C, Du Plessis A J, Bouyssi-Kobar M, et al. Delayed Cortical Development in Fetuses with Complex Congenital Heart Disease. Cereb Cortex. 2013;23(12): 2932-2943.
5. Takao H, Hayashi N and Ohtomo K. Effect of scanner in longitudinal studies of brain volume changes. J Magn Reson Imaging. 2011;34(2): 438-444.
6. Jovicich J, Czanner S, Han X, et al. MRI-derived measurements of human subcortical, ventricular and intracranial brain volumes: Reliability effects of scan sessions, acquisition sequences, data analyses, scanner upgrade, scanner vendors and field strengths. Neuroimage. 2009;46(1): 177-192.
7. Fortin J-P, Cullen N, Sheline Y I, et al. Harmonization of cortical thickness measurements across scanners and sites. Neuroimage. 2018;167(104-120.
8. Han X, Jovicich J, Salat D, et al. Reliability of MRI-derived measurements of human cerebral cortical thickness: The effects of field strength, scanner upgrade and manufacturer. Neuroimage. 2006;32(1): 180-194.
9. Auzias G, Takerkart S and Deruelle C. On the Influence of Confounding Factors in Multisite Brain Morphometry Studies of Developmental Pathologies: Application to Autism Spectrum Disorder. IEEE Journal of Biomedical and Health Informatics. 2016;20(3): 810-817.
10. Ebner M, Wang G, Li W, et al. An automated framework for localization, segmentation and super-resolution reconstruction of fetal brain MRI. Neuroimage. 2020;206(116324.
11. Avants B B, Epstein C L, Grossman M, et al. Symmetric diffeomorphic image registration with cross-correlation: evaluating automated labeling of elderly and neurodegenerative brain. Med Image Anal. 2008;12(1): 26-41.
12. Gholipour A, Rollins C K, Velasco-Annis C, et al. A normative spatiotemporal MRI atlas of the fetal brain for automatic segmentation and analysis of early brain growth. Sci Rep. 2017;7(1): 476-476.
13. Makropoulos A, Robinson E C, Schuh A, et al. The developing human connectome project: A minimal processing pipeline for neonatal cortical surface reconstruction. Neuroimage. 2018;173(88-112.
14. Isensee F, Jaeger P F, Kohl S A A, et al. nnU-Net: a self-configuring method for deep learning-based biomedical image segmentation. Nat Methods. 2021;18(2): 203-211.
15. Makropoulos A, Gousias I S, Ledig C, et al. Automatic Whole Brain MRI Segmentation of the Developing Neonatal Brain. IEEE Trans Med Imaging. 2014;33(9): 1818-1831.
16. Wood S N. Generalized additive models: an introduction with R. chapman and hall/CRC. 2006.
17. Benjamini Y and Hochberg Y. Controlling the False Discovery Rate: A Practical and Powerful Approach to Multiple Testing. 1995;57(1): 289-300.
18. Pomponio R, Erus G, Habes M, et al. Harmonization of large MRI datasets for the analysis of brain imaging patterns throughout the lifespan. Neuroimage. 2020;208(116450.
Figures
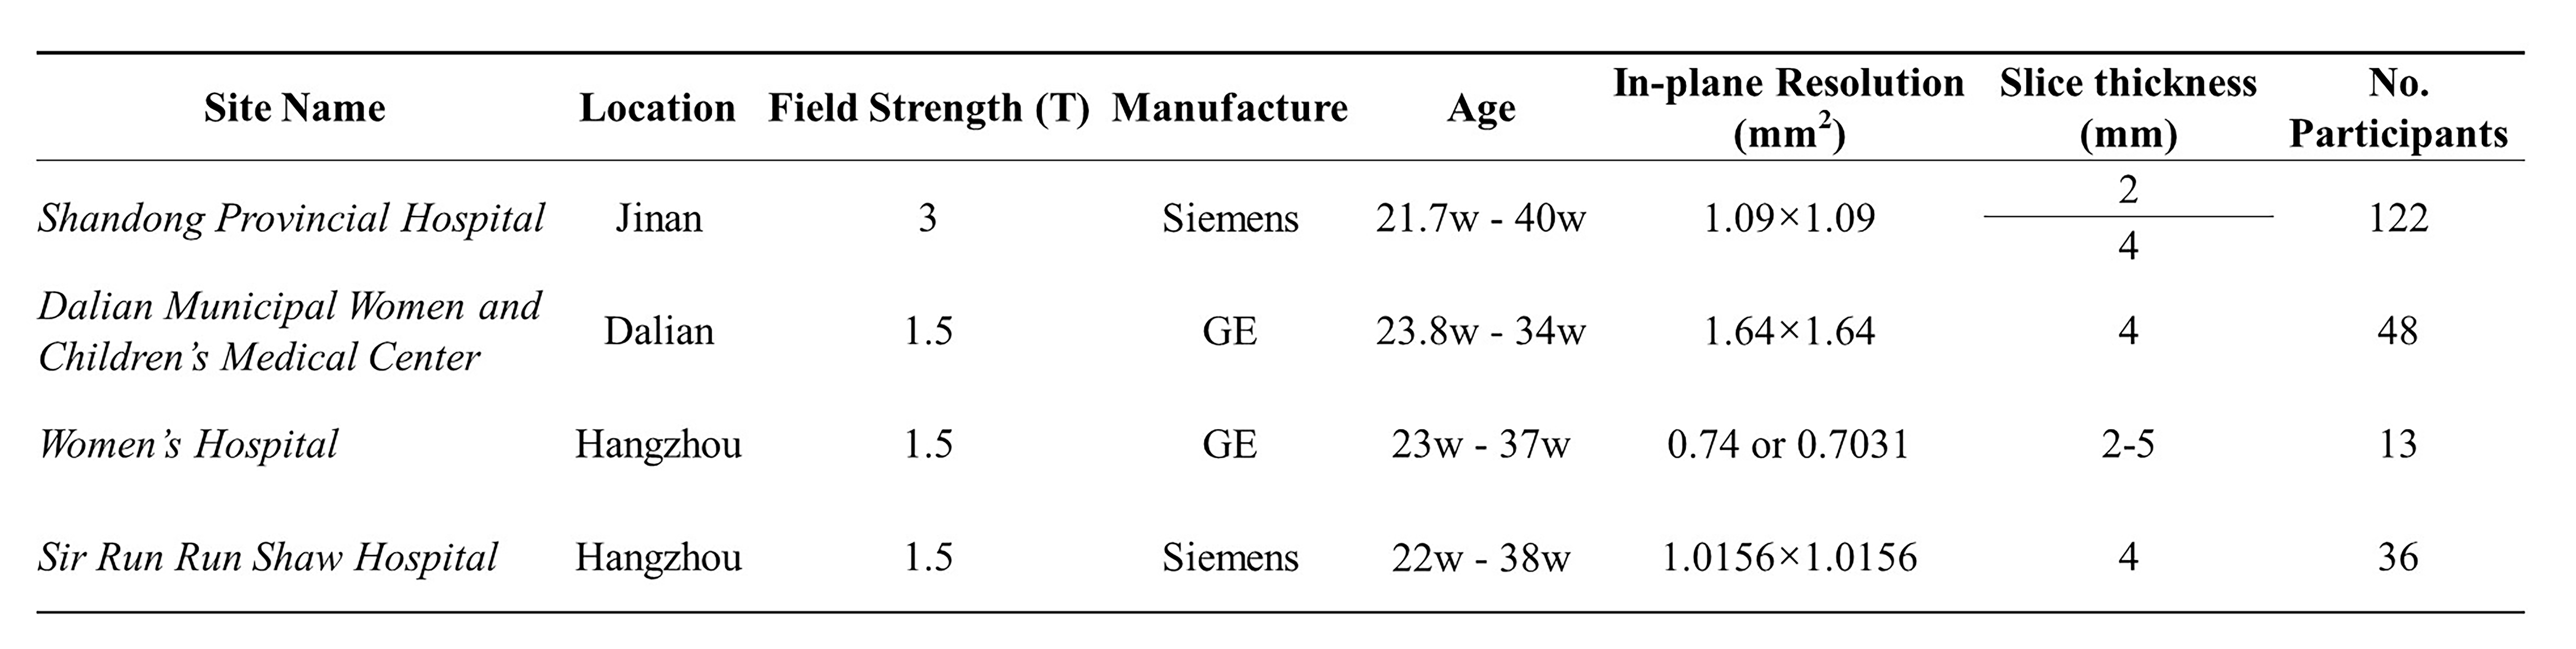
Table 1. Key acquisition factors in the four fetal brain datasets.
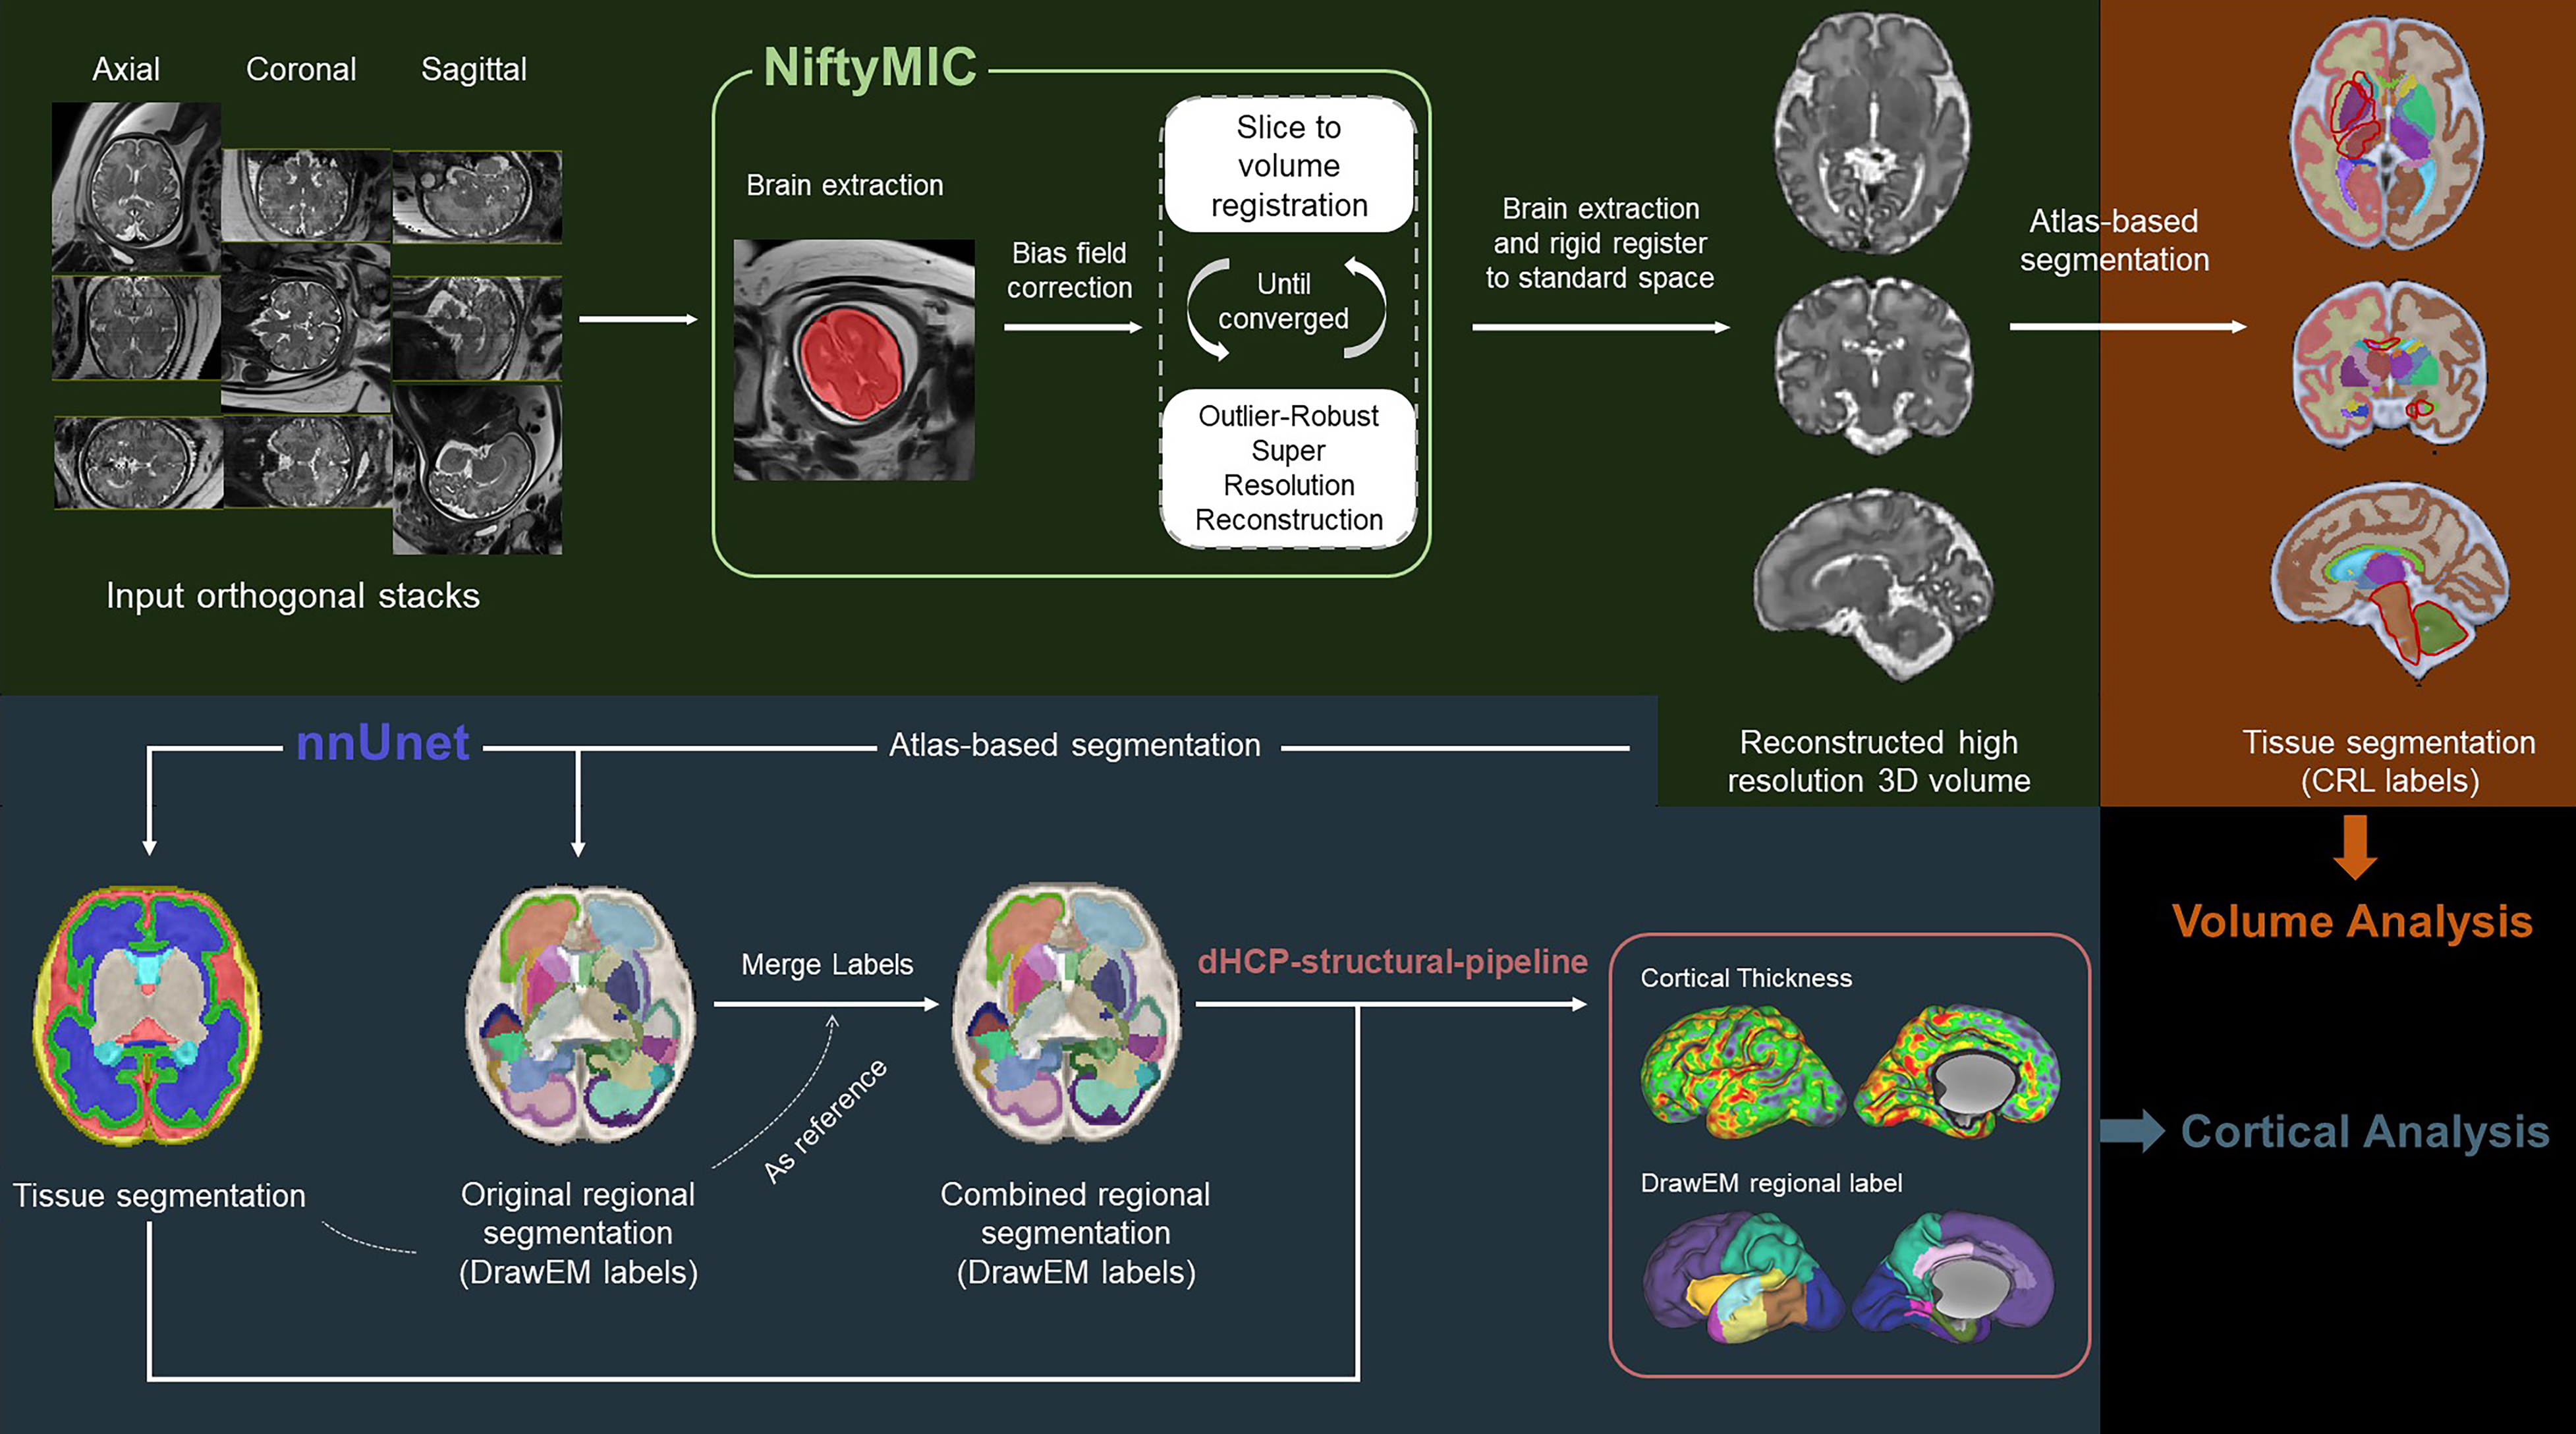
Figure 1. Overview of data processing pipeline including fetal brain MRI reconstruction (green block) and quantification of regional brain volume (orange block) and cortical thickness (dark blue block).
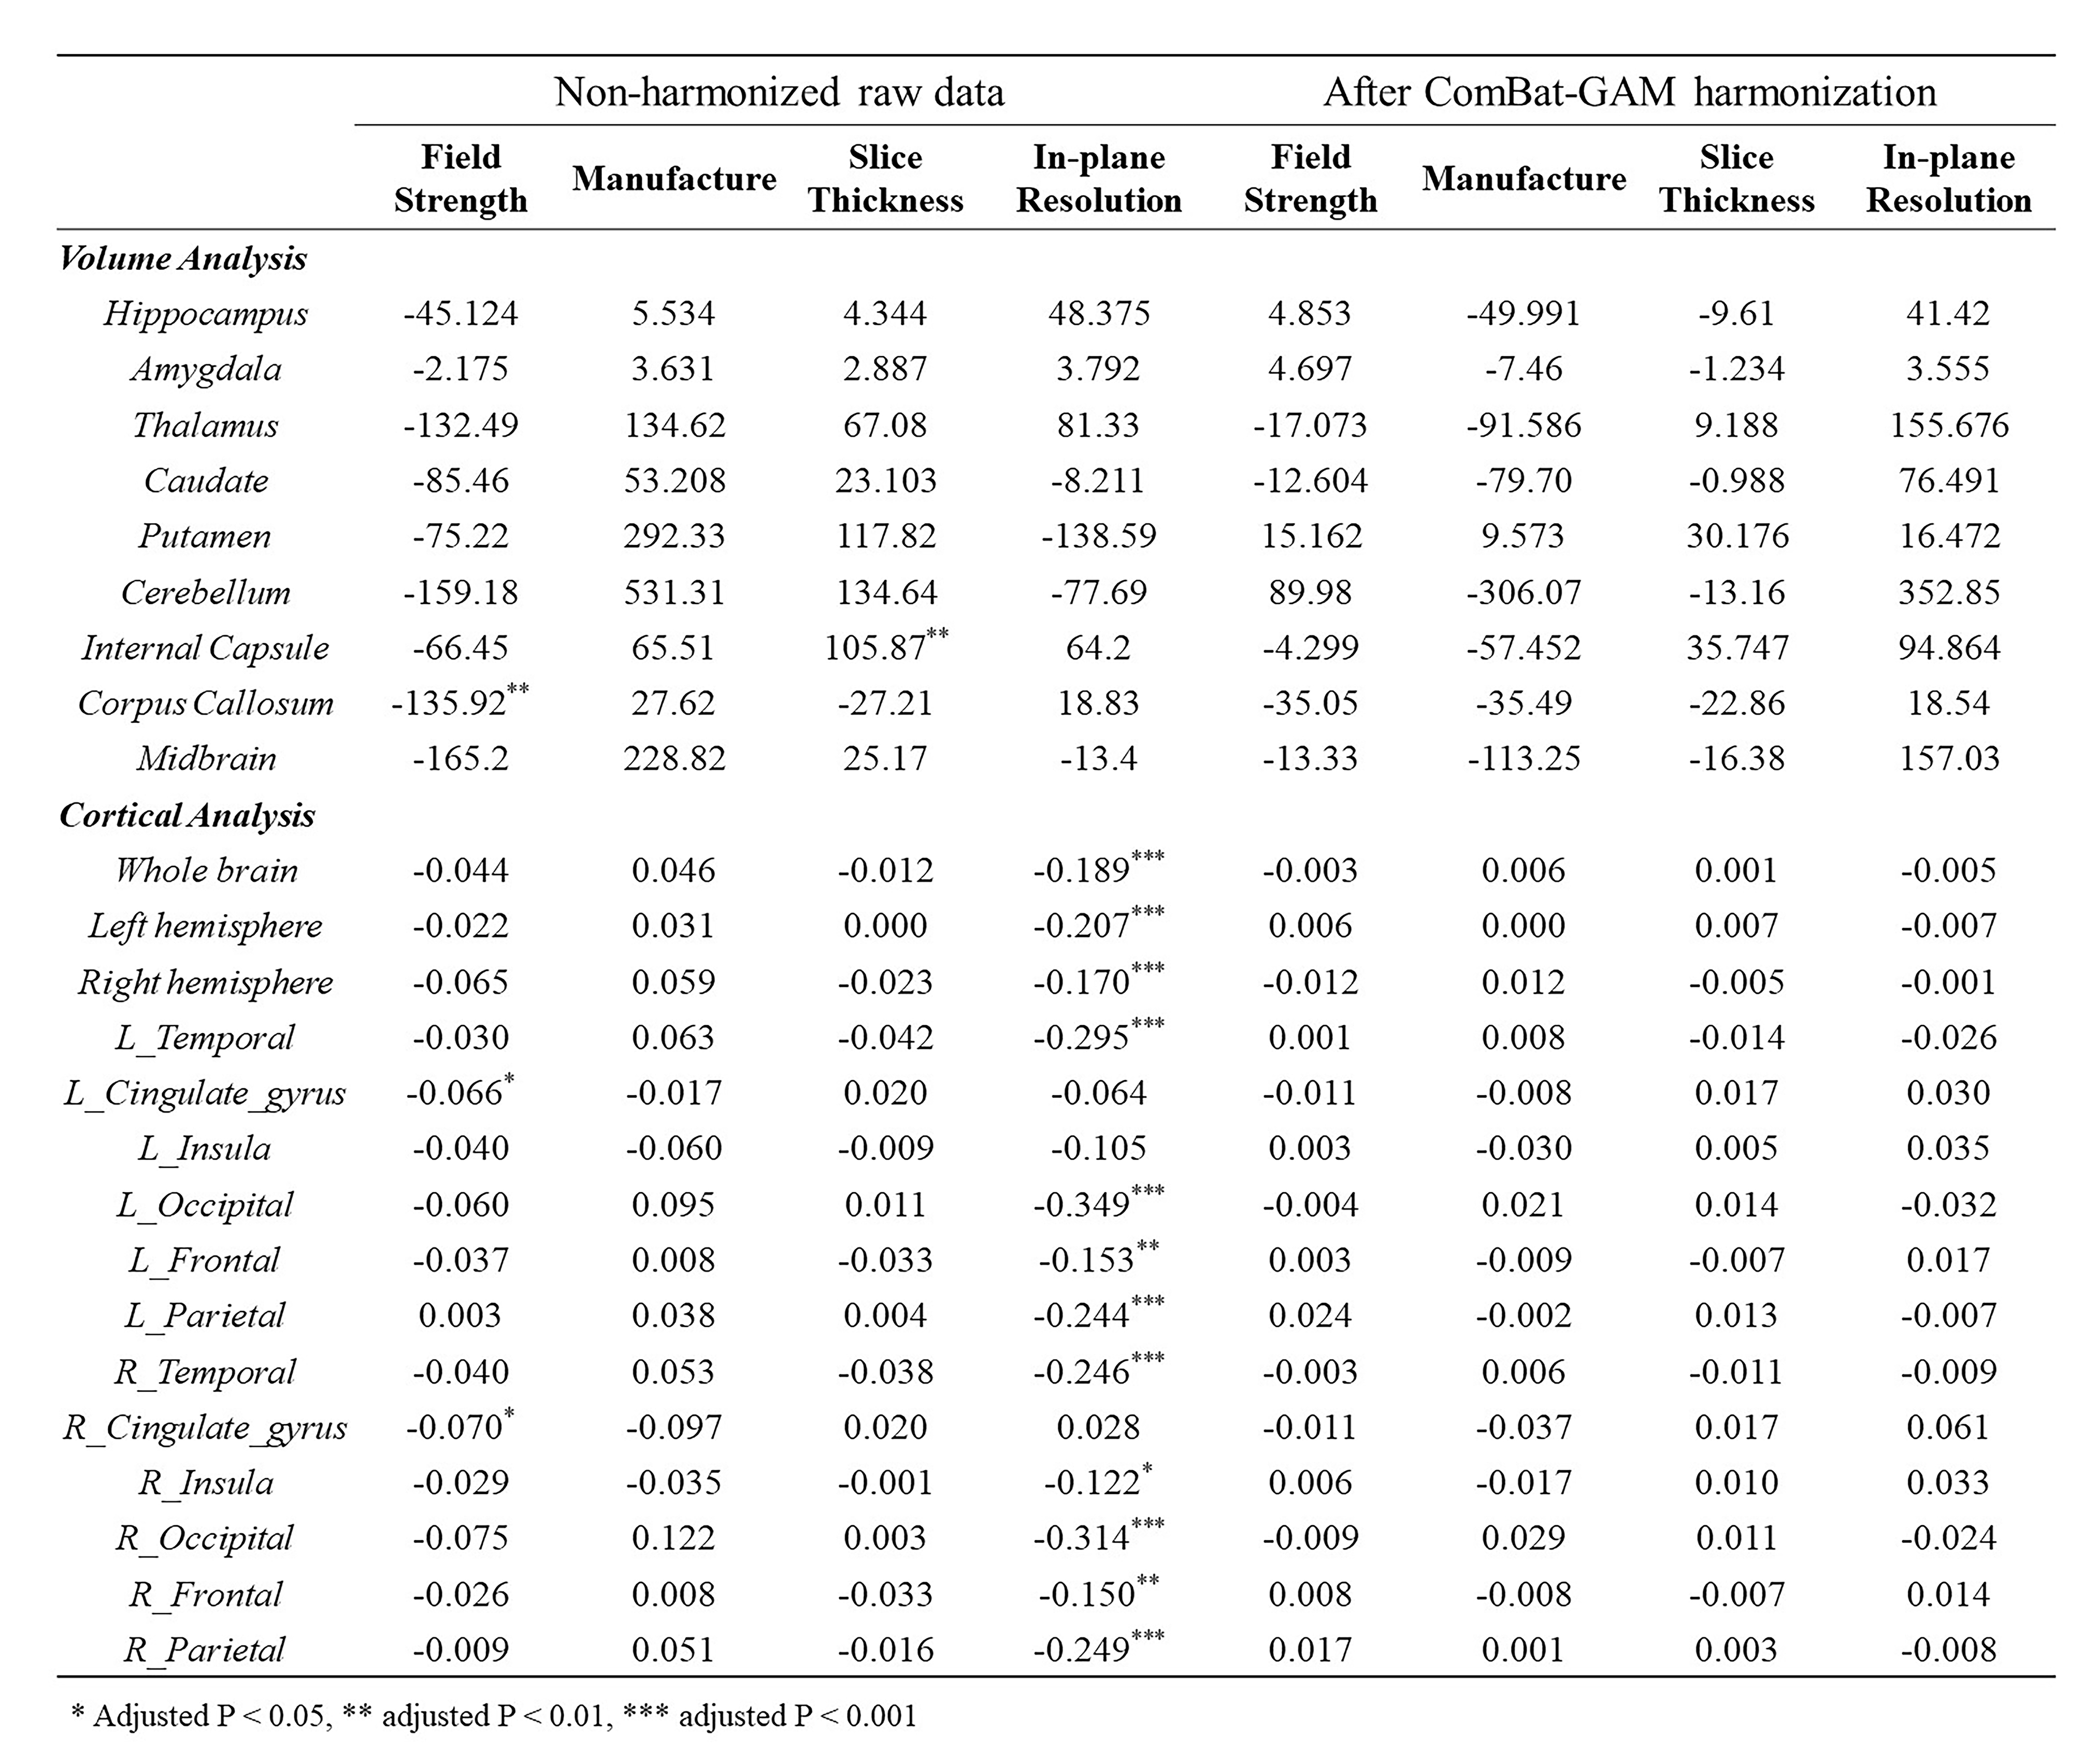
Table 2. Summary of site-related effects (β values) on regional volumes and cortical thickness before and after harmonization. * Adjusted P < 0.05, ** adjusted P < 0.01, *** adjusted P < 0.001
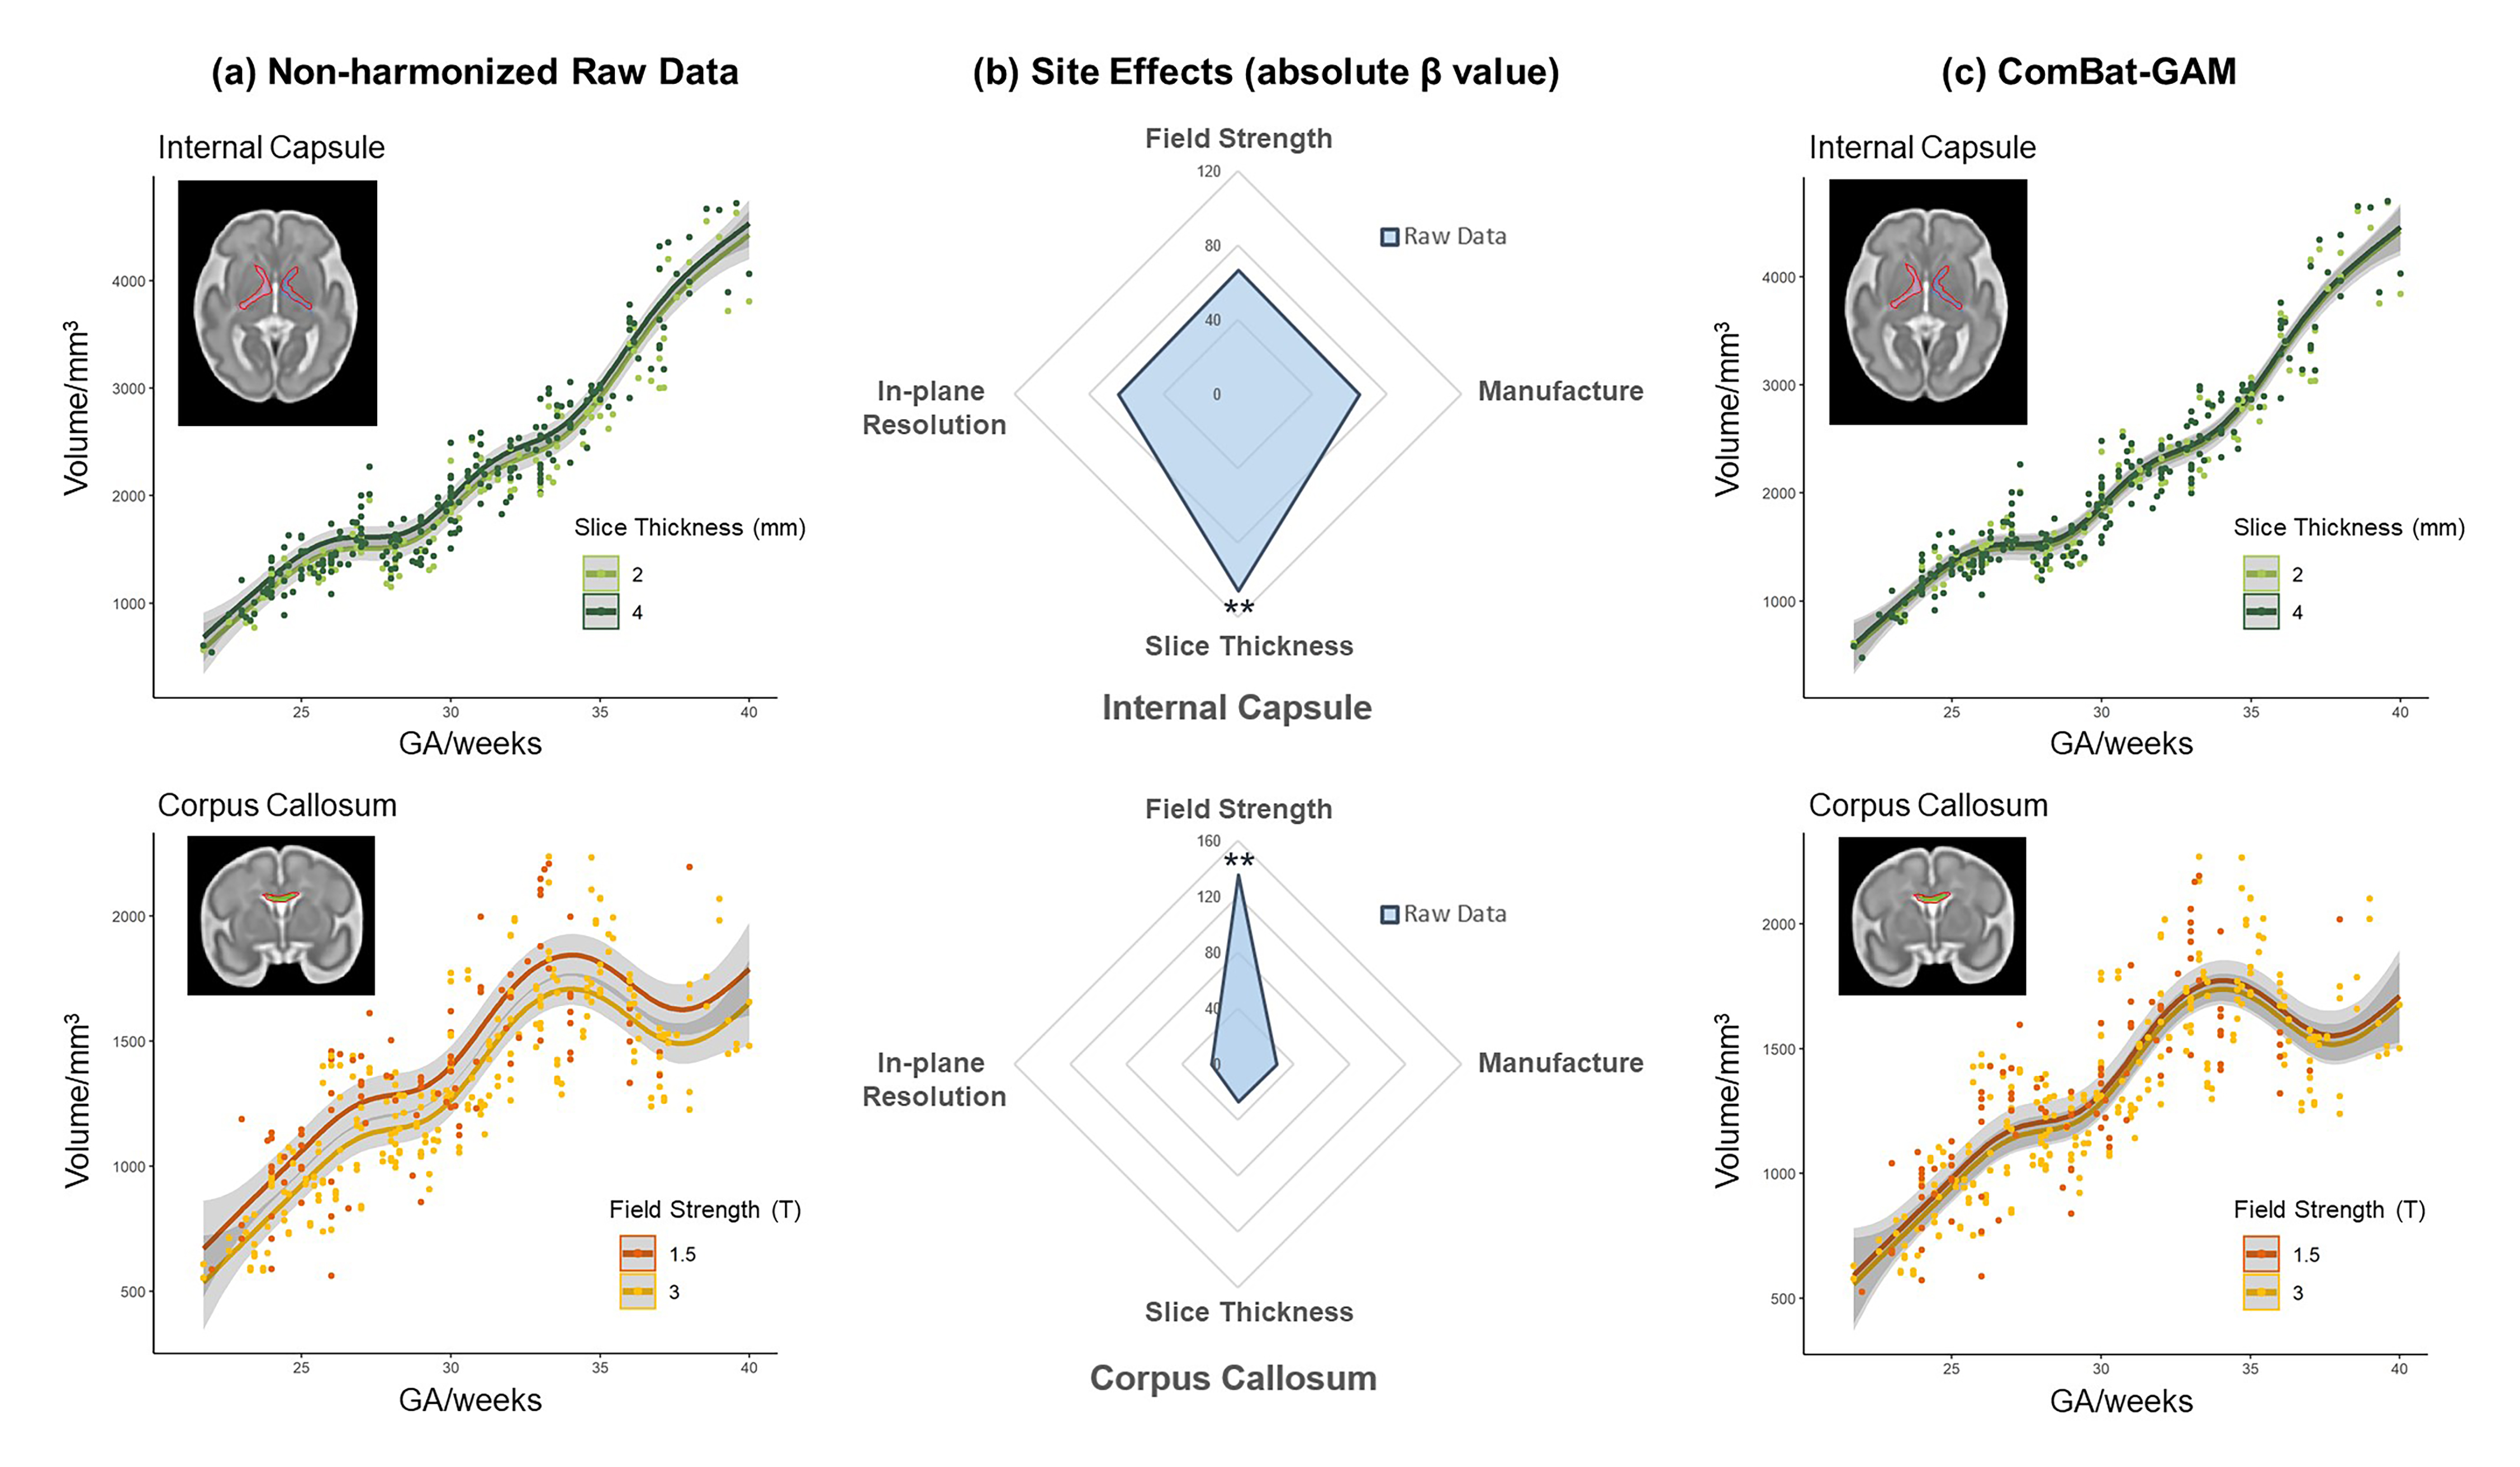
Figure 2. Effects of manufacture, slice thickness, in-plane resolution, and field strength on volume measurements of representative ROIs. (a) Age-related changes in non-harmonized raw volume data using different slice thickness and field strength. (b) Radar charts showing site effects of manufacture, slice thickness, in-plane resolution, and field strength on the non-harmonized raw volume of the corresponding ROI. (c) Age-related changes of the harmonized volume data. * Adjusted p < 0.5, ** adjusted p < 0.01.
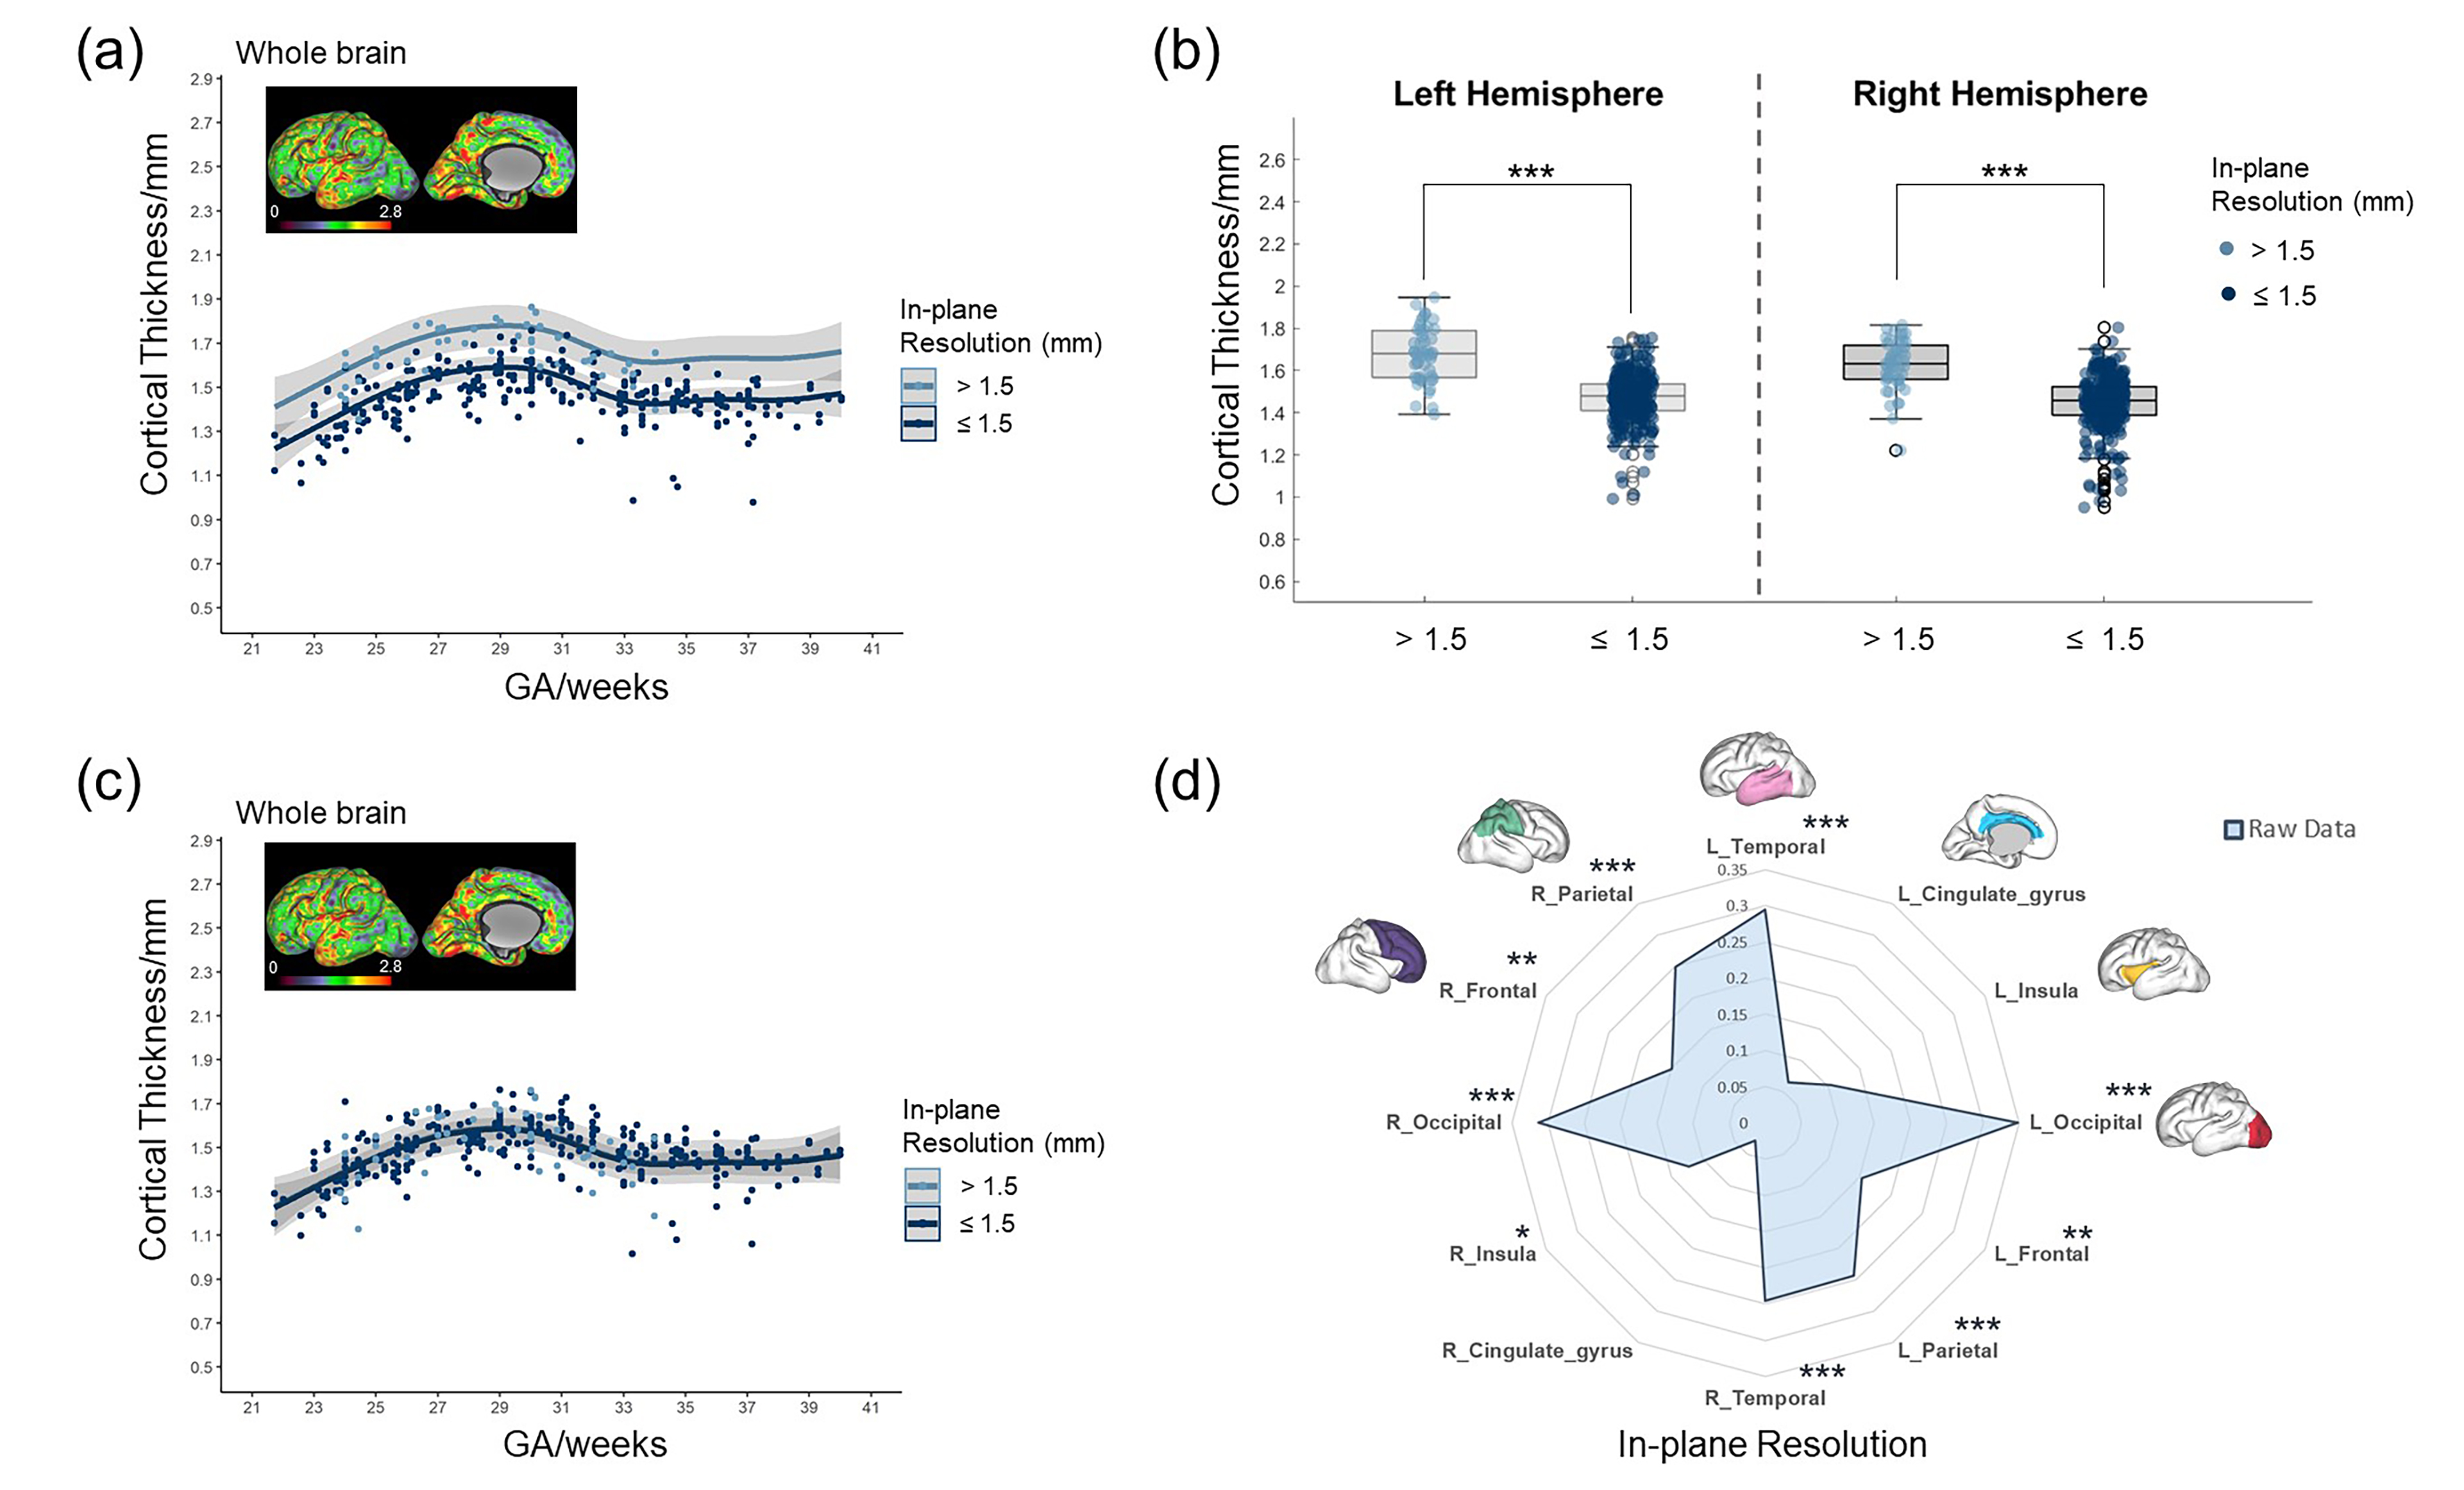
Figure 3. Effects of in-plane resolution on cortical thickness. (a, c) Developmental trajectories of averaged cortical thickness of whole brain over GA with non-harmonized raw data (a) and harmonized data (c). (b) Box plot showing in-plane resolution effects on averaged cortical thickness of left and right hemispheres. (d) Radar charts showing in-plane resolution effects on the raw cortical thickness of different cortical regions. * Adjusted P < 0.05, ** adjusted P < 0.01, *** adjusted P < 0.001