1233
An experimental setup for acoustic noise reduction in MRI using Predictive Noise Canceling1TU Delft, Delft, Netherlands
Synopsis
Keywords: Gradients, Gradients, acoustic noise
Gradient acoustic noise in MRI remains a large source of patient discomfort, with sound pressure levels reaching 130dB. In this work, we explore Predictive Noise Canceling (PNC) to reduce the acoustic noise. The method, similarly to active noise canceling, uses anti-noise to create a quiet zone. However, PNC is based on a direct gradient noise prediction, and is hence robust to aperiodicity and latency. We use iterative equalization and external trigger signals to achieve improved signal fidelity. The method is, for the first time, applied regular MRI sequences, and achieves up to 13dB noise reduction in the 0.3-4kHz range.Introduction
MRI gradient acoustic noise reaches up to 130 dB, raising a serious comfort and safety matter, especially with increasing gradient system capabilities1. Passive attenuation, using earplugs, is the primary measure against acoustic noise in clinical MRI. However, its effect is diminished at lower frequencies, where both human ear sensitivity and gradient noise are the highest. Active noise canceling, based on algorithmic noise predictions and the application of an opposite phase sound (anti-noise) has also gained interest2. However, this approach is presently limited to periodic noise, and also suffers from signal travel time induced latency3. A new approach - Predictive Noise Canceling (PNC) - was introduced recently, suggesting an optimal solution4. The approach uses a direct noise prediction based on input gradient waveforms. In this work, we extend this approach to incorporate iterative equalization (EQ) and external sequence triggering. We evaluate the effectiveness of the updated PNC, showing, for the first time, live noise reduction in regular MRI sequences.Methods
The experimental setup consists of an optical fiber microphone (Phonoptics) and hollow hose (35mm diameter), placed inside the bore of a 3T scanner (Philips Ingenia). In the control room, the hose was connected to a speaker, which was driven by an amplifier connected to an arbitrary function generator (Tektronix, AFG 31002). In addition, the AFG was set up to receive an external TTL trigger from the scanner for synchronization (see Fig.1).Acoustic noise predictions are derived from a linear time invariant model5-6. The X/Y/Z gradient noise is defined in the frequency domain as P(f)X/Y/Z = HX/Y/Z(f) ∙ G`X/Y/Z(f). Here G`X/Y/Z(f) represents gradient input derivatives and HX/Y/Z(f) the coil transfer functions, which are defined for a fixed location inside the bore. The coil transfer functions were derived from triangular gradient pulses with 0.14ms rise time and 20mT/m amplitude.
Additionally, accurate transmission required processing to minimize sound distortions. Three output corrections were considered:
1) Latency of the triggered output was estimated during the calibration (see Fig.2);
2) Clock mismatch, appearing between the real-time system of the MRI and the PC recordings was corrected by retrospective resampling to align with fixed time TRs (see Fig.2);
3) Hose-induced frequency distortion was corrected by deriving an equalizer (EQ) filter from a sample input-output pair. This filter was applied iteratively, to derive a third order correction and increase output fidelity.
A calibration sequence was designed, consisting of three main steps. In the first step, X/Y/Z triangular pulses were played with TR=3s and five averages to obtain the transfer functions (see Fig.2). A noise prediction for calibration pulses was then generated, determining the maximum linear model reduction. In the second step, noise prediction was played out. Signal latency and expected reduction was determined, retrospectively aligning signals. The second step was repeated 3 times in total to obtain higher order EQ corrections. An expected noise reduction was also estimated. In the third step, scanner noise was played together with the anti-noise, evaluating live noise reduction in the bore.
The mentioned three step protocol was applied first to the calibration pulses, then to a sample multi-gradient input, and finally to a list of ten regular GRE sequences (~10s long each), preparing noise prediction based on the calibration data.
Results
For the calibration, a maximum model reduction (step 1) of 22.4±1.4 dB was estimated. For step 2, expected live noise reduction was 16.3±0.8 dB, and the actual observed reduction in step 3 was 13.8±2.6dB. Over the frequency range, the strongest reduction was observed at 1kHz with 19.3±1.9dB reduction (see Fig.3).For sample multi-gradient setup (See Fig.4), estimated maximum model reduction (step 1) was 13.4dB, and expected reduction at step 2 was 11.3dB. The live reduction was 11.2±0.2dB at 0.3-4kHz, peaking at 17.1±0.3dB at 0.6kHz.
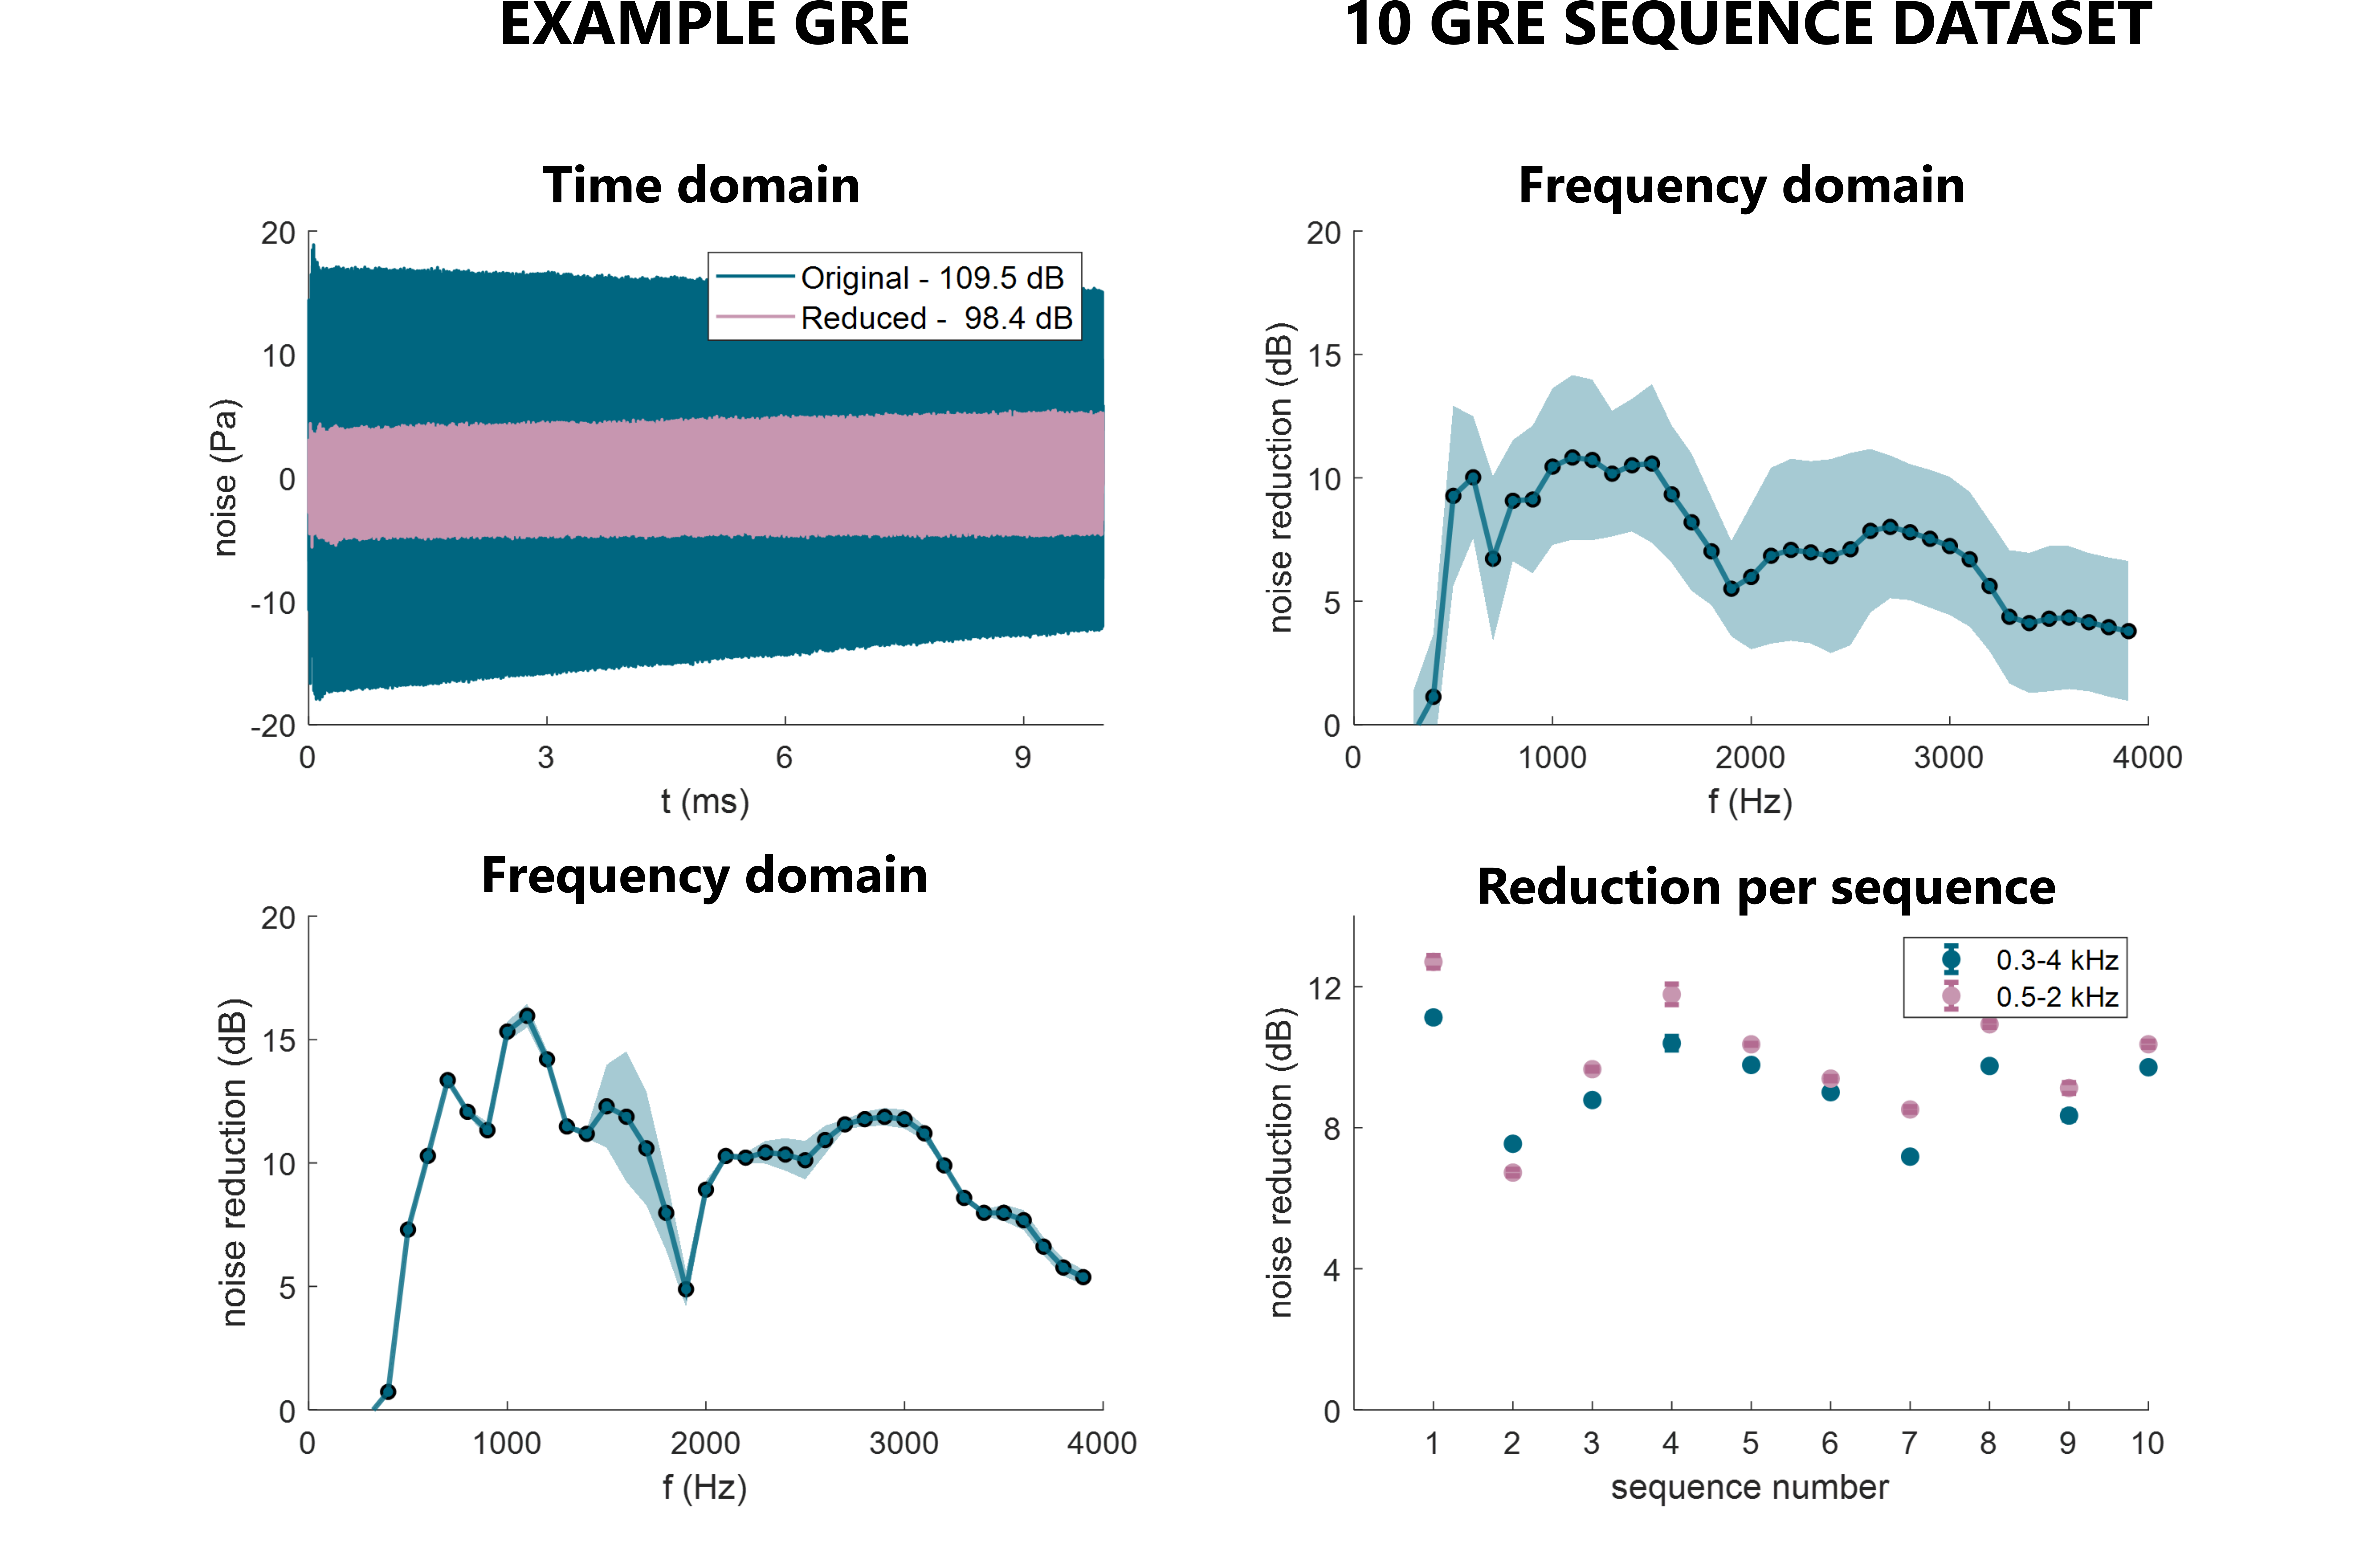
For a range of regular MRI sequences, mean maximum model reduction was 10.2±2.8dB (0.3-4kHz). Expected/observed live noise reduction (steps 2/3) was 8.9±1.1dB and 9.2±1.2dB. In the frequency spectrum, peak noise reduction was observed between 9.9dB and 16.0dB, observed at 0.5-1.1kHz frequencies (see Fig.5).
Discussion
For the first time, the PNC model shows consistent noise reduction in complete MRI sequences. With an updated EQ method (iterative correction), higher output accuracy was achieved, hence pushing observed noise attenuation closer to the estimated model maximum. Using an external trigger sent from the scanner, as opposed to previously used acoustic trigger pulse further contributed to lower latency variability in the system.PNC showed particularly strong effect at lower frequencies, which is typical for an anti-noise based approach.. The strongest reduction is evident at the 0.5-1.1kHz range, where the human ear is also most sensitive to noise.
The model setup demonstrates the proof of principle even in the presence of system imperfections. The hose model likely results in some deep nulls in the transmission spectrum, and therefore not all frequencies can be recovered with the EQ correction. This can be avoided in future applications using MRI compatible headphones as commercially available. Such a setup will help to bring live noise reduction values closer to the estimated model maximum.
Conclusion
Gradient noise prediction in PNC shows a great promise of easily-applicable acoustic noise attenuation, independent of latency effects and complexity of the gradient input.Acknowledgements
S.W. acknowledges funding from the 4TU Precision Medicine program, an NWO Start-up STU.019.024, and ZonMW OffRoad 04510011910073. P.S. would also like to thank Christal van de Steeg-Henzen from Holland PTC (Delft, the Netherlands) for the help with setting up experiments.References
1. McJury, M. J. (2021). Acoustic Noise and Magnetic Resonance Imaging: A Narrative/Descriptive Review. Journal of Magnetic Resonance Imaging.
2. Goldman, A. M., Gossman, W. E., & Friedlander, P. C. (1989). Reduction of sound levels with antinoise in MR imaging. Radiology, 173(2), 549-550.
3. Optoacoustics, OptoActive II. https://www.optoacoustics.com/medical/optoactive-ii Accessed on November 10, 2022.
4. Siuryte, P., Tourais, J., Weingartner, S. (2022). Reducing MRI acoustic noise burden with Predictive Noise Cancelling. Proc. ISMRM 2022
5. Sierra, C. V. R., Versluis, M. J., Hoogduin, J. M., & Duifhuis, H. (2008). Acoustic fMRI noise: linear time-invariant system model. IEEE Transactions on Biomedical Engineering, 55(9), 2115-2123.
6. Wu, Z., Kim, Y. C., Khoo, M. C., & Nayak, K. S. (2014). Evaluation of an independent linear model for acoustic noise on a conventional MRI scanner and implications for acoustic noise reduction. Magnetic resonance in medicine, 71(4), 1613-1620.
Figures