1226
Quantitative and Automated MRI Cancer Risk Maps used for Identification of Prostate Cancer Progression
Matthew Gibbons1, Janet E Cowan2, Peter R Carroll2, Matthew R Cooperberg2, and Susan M Noworolski1
1Department of Radiology and Biomedical Imaging, University of California, San Francisco, San Francisco, CA, United States, 2Department of Urology, University of California, San Francisco, San Francisco, CA, United States
1Department of Radiology and Biomedical Imaging, University of California, San Francisco, San Francisco, CA, United States, 2Department of Urology, University of California, San Francisco, San Francisco, CA, United States
Synopsis
Keywords: Prostate, Cancer
This study’s objective was to determine whether automated mpMRI cancer risk maps could identify prostate cancer progression during active surveillance. Derived lesion masks were used to analyze factors for progression. A decision tree model for progression was generated with sensitivity = 0.84, specificity = 0.56, and ROC AUC 0.75. The identification results indicate the potential of mpMRI and MRI cancer risk maps to assist in identifying progression during prostate cancer active surveillance.Introduction
While prostate cancer (PCa) has high total mortality, many men with PCa may avoid treatment with its concomitant side effects. Improvements in risk assessment are needed to accurately differentiate cases with risk of progression from indolent disease. While multiparametric MRI (mpMRI) is beneficial and widespread, clinical practice relies on qualitative assessments that do not exploit all available information. Applying quantitative methods may aid in detecting and quantifying PCa. This study’s objective was to determine whether mpMRI cancer risk maps could differentiate between men who progressed on active surveillance (AS) versus those who did not.Methods
This was a retrospective study of PCa progression (defined by an increase in biopsy Gleason grading (GG)) in men following AS. Patients were selected who did not have progression for at least 3 years or had progression in ≤ 3 years from an initial biopsy demonstrating low risk disease, GG = 1. In this cohort, progressed cases had GG = 2 at the later biopsy. Patients were included who had two MRI scans: a) scan 1 near in time to the initial biopsy and b) scan 2 near in time to the progression date or after three years non-progression. Using these criteria and including only those with complete scan sets resulted in 93 subjects (32 progression, 61 non-progression). Lesion masks automatically derived from mpMRI PCa risk maps were used to determine progression indicators. The cancer risk maps were generated according to a methodology previously validated with whole-mount prostate histopathology in men with untreated PCa1,2,3. The PCa maps were used to classify MRI voxels as cancer from which lesion volumes and mpMRI mean characteristics within lesions were calculated. Investigated parameters included PCa volume, aggressive PCa volume, volumes normalized to the prostate volume, dynamic contrast-enhanced MRI (DCE MRI) peak enhancement, DCE MRI enhancement slope, DCE MRI washout slope, and apparent diffusion coefficient (ADC). Populations of progression and non-progression were compared for statistical significance reported as p-values. Categorical decision trees were generated to identify progression and assessed for receiver operating characteristic (ROC) area under the curve (AUC), sensitivity, and specificity.Results
An example mpMRI images comparing scan 1 and scan 2 is shown in Figure 1. Superimposed on the T2W and ADC images are the PCa maps estimates of cancer lesions. The increase in the dominant lesion cancer volume at scan 2 is visible. Some scattered, small volumes exist which may be erroneous indications by the PCa maps model or other foci of cancer.The majority of cases had increased PCa volume at scan 2 vs scan 1, as shown by most data above the 1:1 line in Figure 2. A lower bounding line to indicate erroneous outliers, as determined when the risk maps were validated3, was placed on the plot at 0.75·vol_PCa_scan1 - 1 (cc). This indicates 7 / 93 (8%) cases as outliers for the volume estimation. Figure 3 has Bland-Altman plots, showing the difference between scan 2 and scan 1 PCa volumes (Figure 3a) and fractional volumes (Figure 3b) of each case. The volumes and fractional volumes were significantly larger overall (mean increases 0.92±2.1cc and 1.3%±4.1%), and volumes increased more for larger cancers, p<0.024. At scan 2, the PCa volumes did not differ between cases with progression and those without (mean = 3.6 cc, p-value = 0.91). However, the PCa fractional volumes, normalized by the prostate volumes, did exhibit a trend to be larger in cases that progressed (9.1% vs. 7.2%, p=0.060) (Figure 4). In other words, the cancer in scan 2 tended to comprise more of the prostate in cases that progressed.
A decision tree model to identify progression was generated with sensitivity 0.84, specificity 0.57, and ROC AUC 0.75. The factors in this decision tree were PCa volume (fraction), mean DCE-MRI enhancement slope, PCa risk map mean probability within the cancer volume, and PCa volume (fraction) difference between scans.
Discussion
An increase of scan 2 volume over scan 1 was consistent with an expectation that PCa may increase in volume over time and indicates reasonable performance of the PCa volume calculation, even in a low-risk prostate cancer population on AS. Cases demonstrating decreases in cancer volume may be due to errors in the automatic volume calculation, which most commonly occur with image artifacts3. At follow-up (scan 2), cancer volumes tended to comprise a larger fraction of the prostate in cases with progression on biopsy to GG2.Because of small differences in populations, several factors were required in decision tree models to identify progression. Sources of variability in this dataset include biopsy sampling errors and PCa map errors, which may be due to image artifacts, alignment errors, or biological differences. Even with these limitations, the good classification results indicate the potential of MRI cancer risk maps to assist in identifying progression and to aid monitoring men on AS.
Conclusion
The MRI PCa risk maps method has automated, quantitative features to provide metrics from mpMRI such as estimates of cancer volume and aggressiveness. It encompasses the entire prostate overcoming the limited sampling of biopsy. This study shows the potential for MRI PCa risk maps to enhance existing capabilities to identify prostate cancer progression during active surveillance.Acknowledgements
Funding from California Tobacco-Related Disease Research Grant: 28IR-0060.References
1) Starobinets O, et. al. Characterization and stratification of prostate lesions based on comprehensive multiparametric MRI using detailed wholemount histopathology as a reference standard. NMR Biomed. 2017;30(12):e3796.
2) Gibbons M, et. al. Identification of prostate cancer using multi-parametric MR imaging characteristics of prostate tissues referenced to whole mount histopathology, Magn Reson Imaging 2022; 85:251-261.
3) Gibbons M, et. al. Prostate Cancer Risk Maps Derived from Multi-parametric MRI and Validated by Histopathology. ISMRM 2021.
Figures
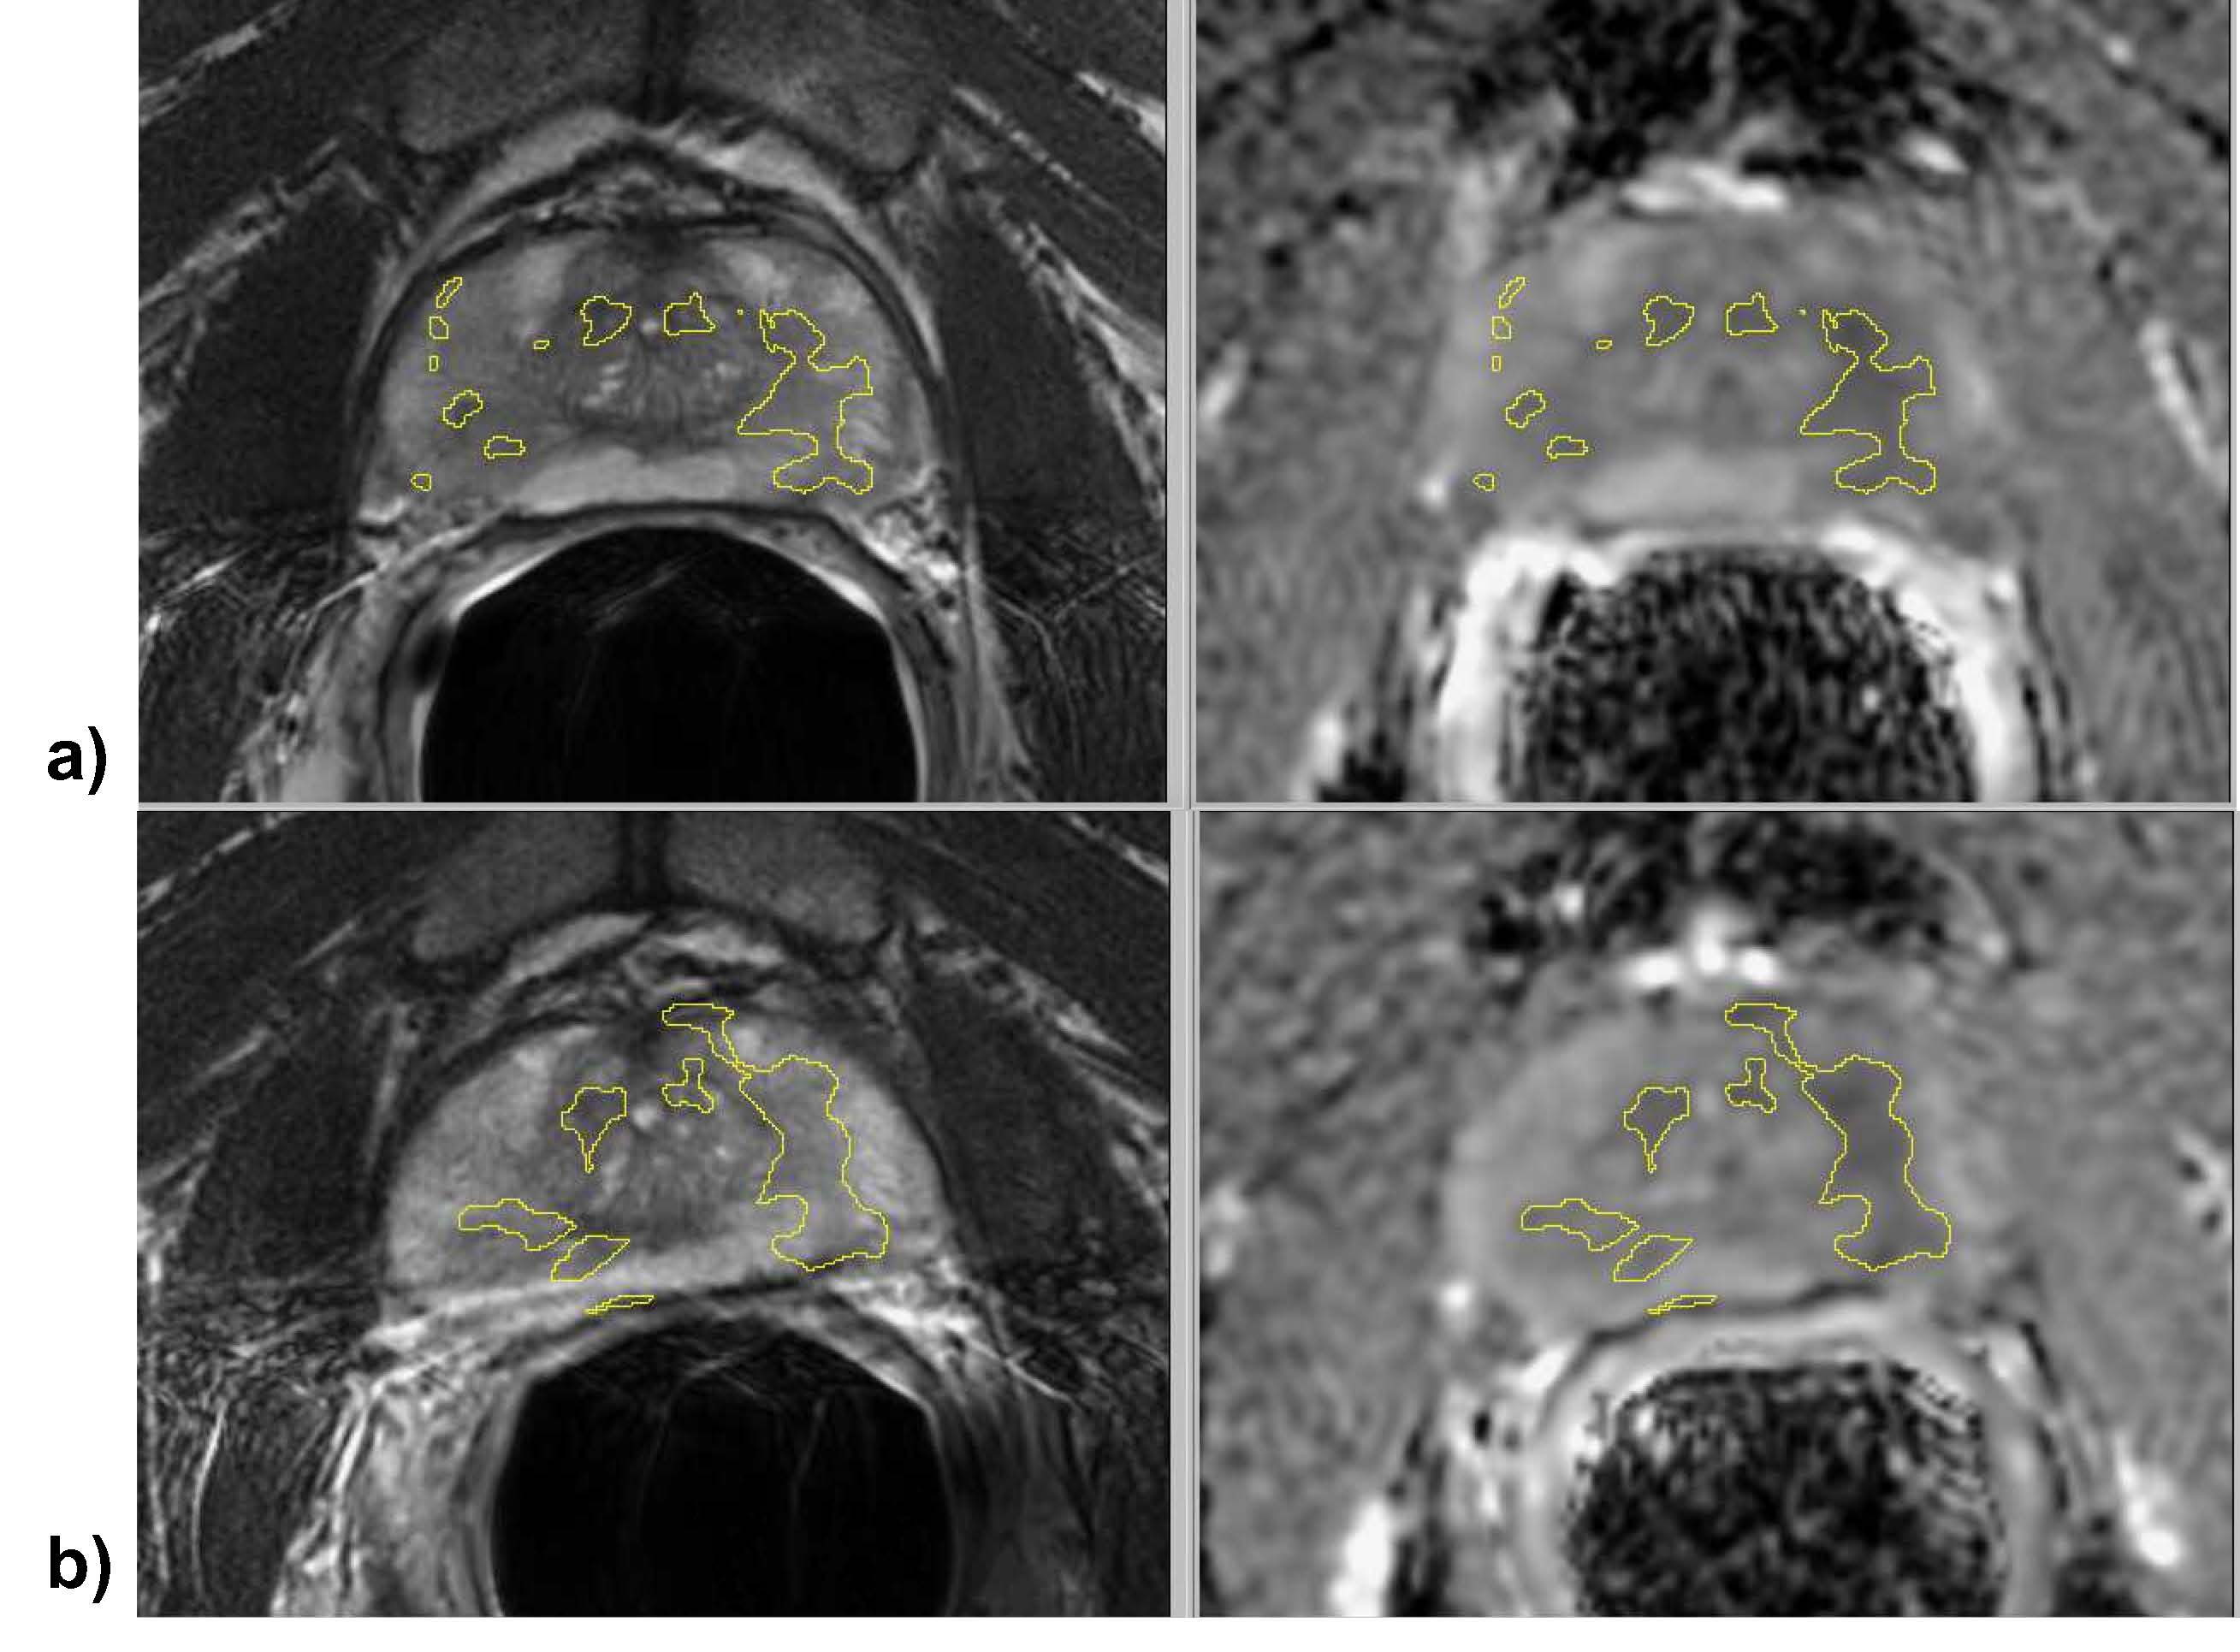
Figure 1: Example T2W and ADC images from a) scan 1 and b) scan2 with outlines of the estimated PCa volumes superimposed. The PCa volumes were 2.4 cc for scan 1 and 4.7 cc for scan 2.
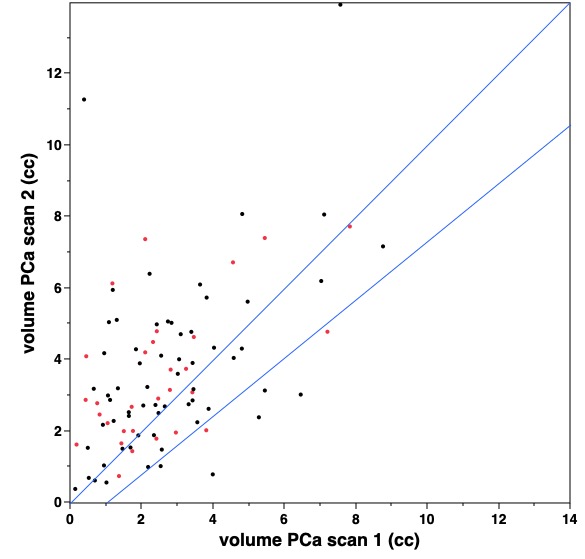
Figure 2: Comparison of scan 2 to scan 1 PCa risk map volumes, demonstrating that the majority of cases increase in volume. Red dots indicate cases that progressed.
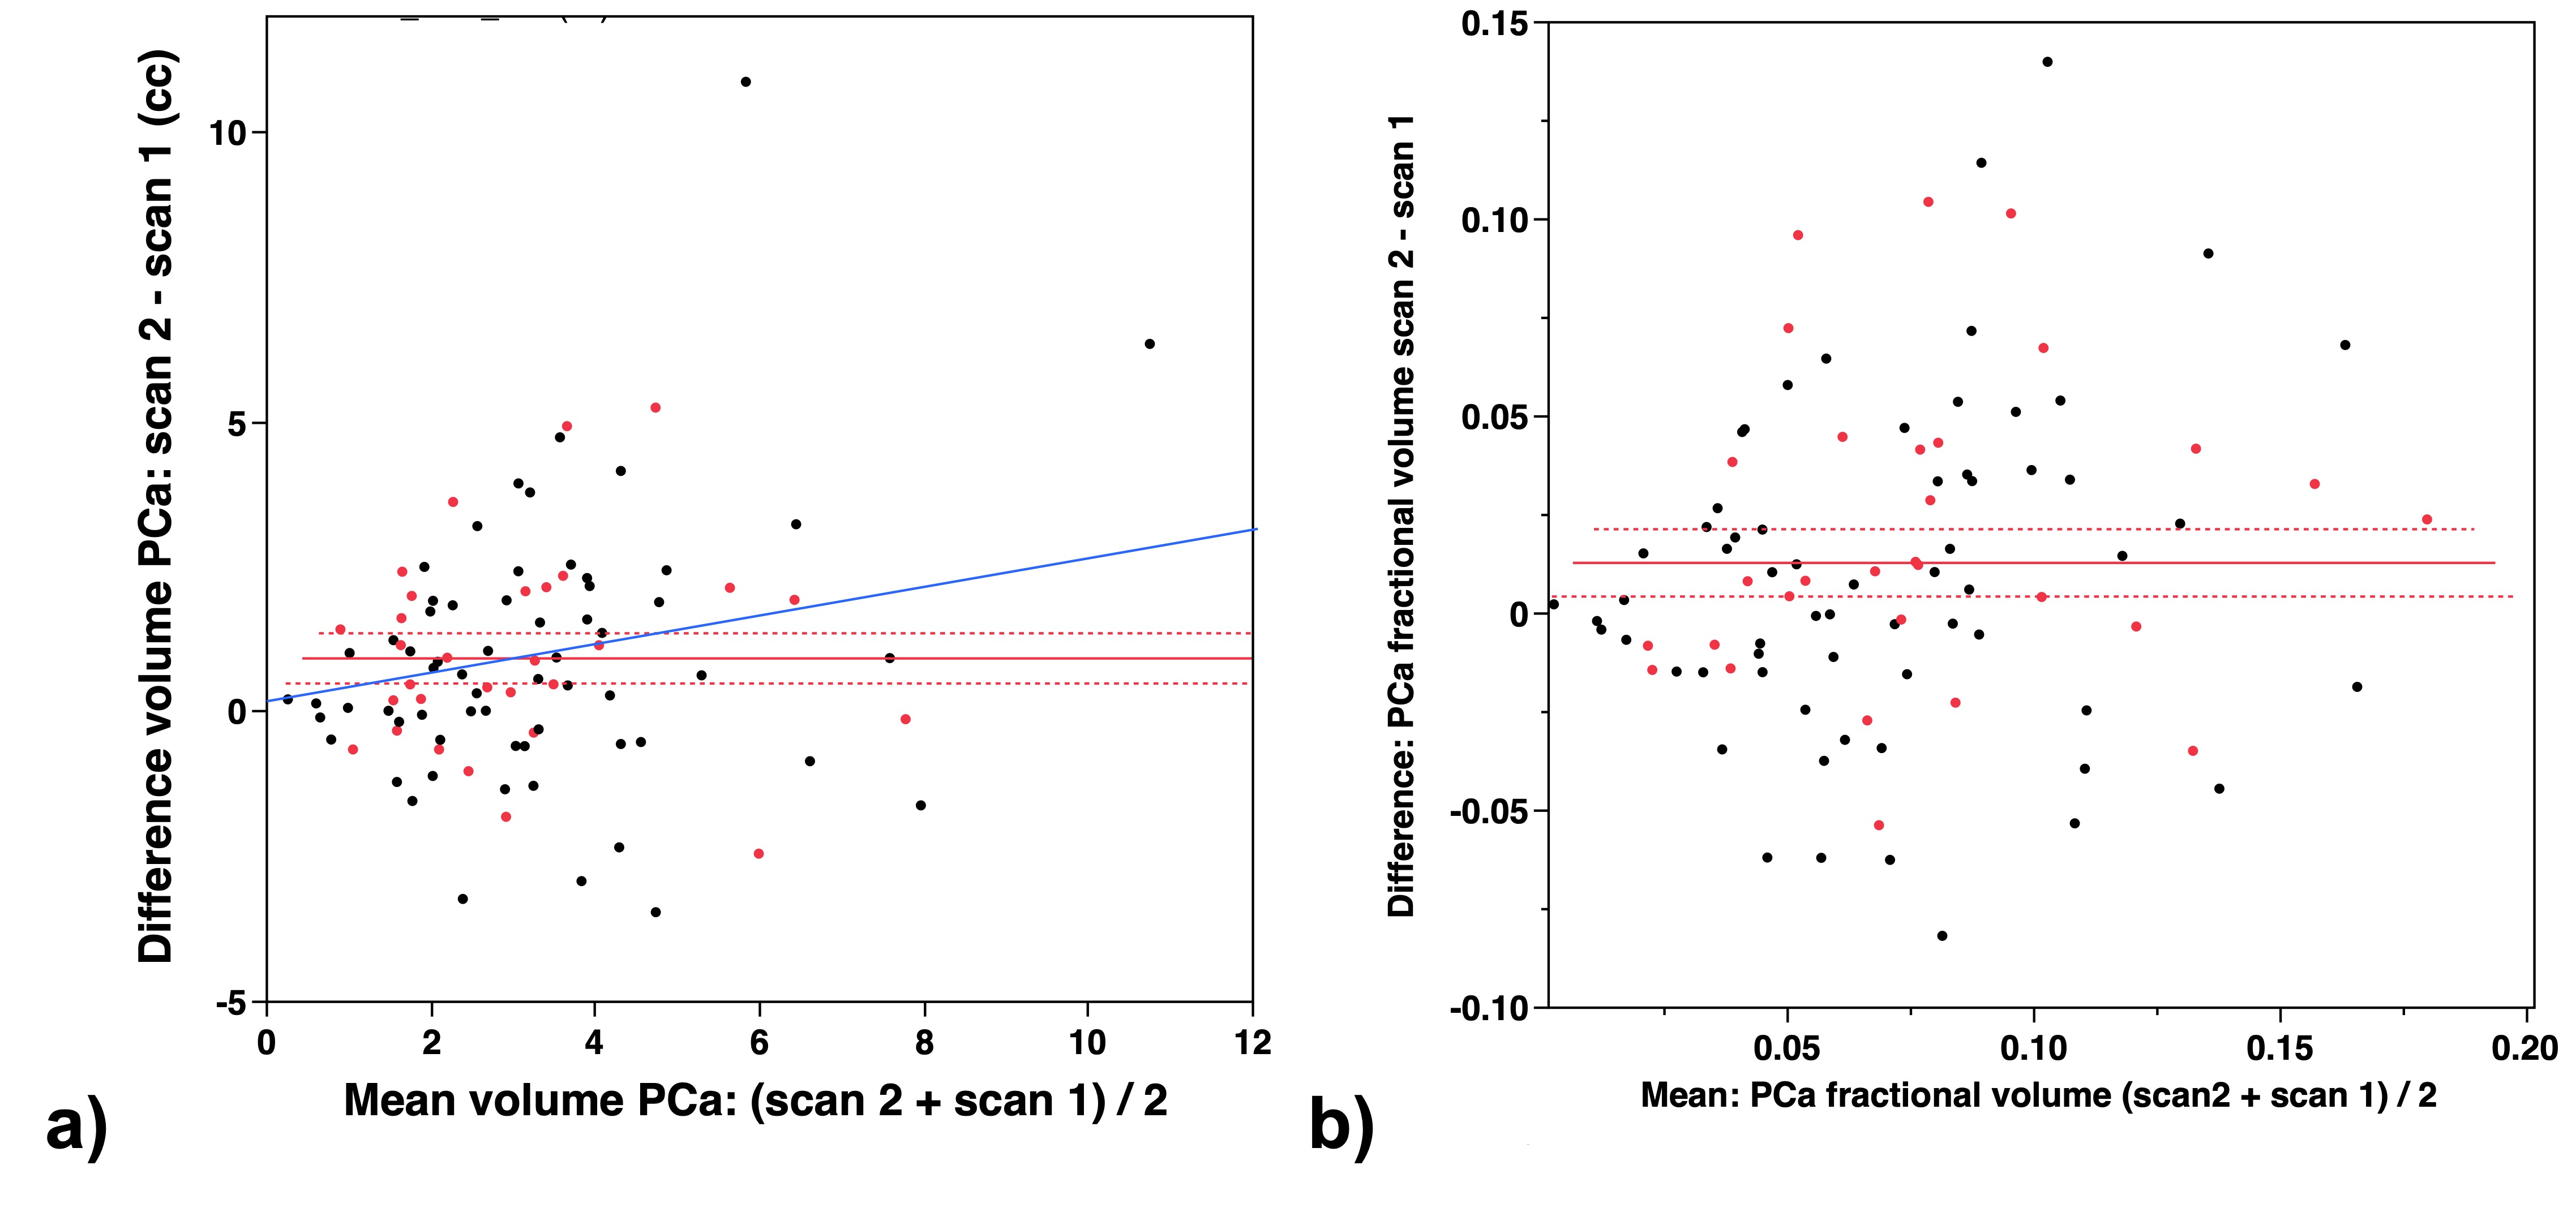
Figure 3. Bland Altman plots showing the overall bias of higher PCa volumes in scan 2 vs scan 1 for a) volume in cc (mean bias = 0.92 cc, p < 0.0001) and b) fractional volume (mean bias = 1.2%, p = 0.004). The blue line in a) is a linear fit indicating larger volume increases for higher initial volumes (p = 0.024). The red dots indicate cases that progressed.
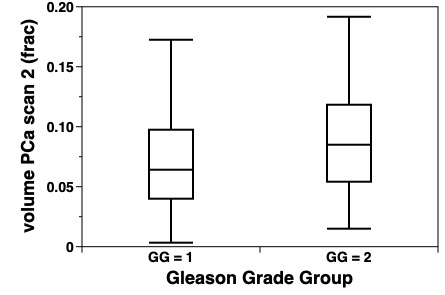
Figure 4: Plot of PCa fractional volume (fraction of total prostate volume) in scan 2, comparing cases without progression (GG=1) (mean = 7.2%) from cases with progression (GG=2) (mean = 9.7%), p-value = 0.060.
DOI: https://doi.org/10.58530/2023/1226