1224
The value of glucose-chemical exchange saturation transfer and amide proton transfer in predicting tumor grading and staging in rectal cancer1Department of Medical Imaging, XinxiangMedical University & Henan Provincial People's Hospital, Zhengzhou, China, 2Department of Medical Imaging, Zhengzhou University People's Hospital & Henan Province People's Hospital, Zhengzhou, China, 3Department of Medical Imaging, Henan University People’s Hospital & Henan Provincial People’s Hospital, Zhengzhou, China, 4Philips healthcare, Beijing, China
Synopsis
Keywords: Pelvis, CEST & MT, rectal cancer
What are the values of glucose-chemical exchange saturation transfer (glucoCEST) and amide proton transfer (APT) imaging in WHO grading and T staging of rectal cancer? We performed 3D-glucoCEST, 3D-APT, and DWI scans in 21 rectal adenocarcinoma cases. GlucoCEST signal intensity (SI) and 3D-APT SI could distinguish high-grade from low-grade, and T3 stage from T2 stage rectal adenocarcinoma, and both had comparable diagnostic efficacy. In addition, 3D-glucoCEST SI and 3D-APT SI were positively correlated with tumor grade.Introduction
Chemical exchange saturation transfer (CEST) is a novel magnetic resonance molecular imaging technique. The occurrence and development of diseases are often accompanied by changes in the content or concentration of endogenous metabolites such as protein and glucose in tissues. CEST imaging saturates the exchangeable material by specific saturation pulses so that the exchangeable material is exchanged with water, and then indirectly reflects the content of the exchangeable material by detecting the change in signal intensity of water. In addition, it can also reflect information about the tissue environment to a certain extent. The most established application of CEST is amide proton transfer weighted imaging (APTWI), which enables the non-invasive detection of free proteins and peptide molecules in the cytoplasm. Also, APTWI is affected by pH, and the APT effect becomes more pronounced as the pH increases. It has been found that APT can be used as a non-invasive biomarker to assess prognostic factors such as staging and grading of rectal adenocarcinoma(1,2). GlucoCEST imaging is able to detect glucose levels indirectly. Xu et al.(3) used this principle to detect the presence of glucose concentrations in glioma lesions. And a previous study found good spatial agreement between [18]F-FDG autoradiography and glucoCEST images observed in colorectal tumor models(4). However, the value of glucoCEST in rectal cancer tumor assessment has not been reported in any study. The purpose of this study was to analyze the value of glucoCEST in rectal cancer tumor grading and staging, and to compare it with 3D-APT.Methods
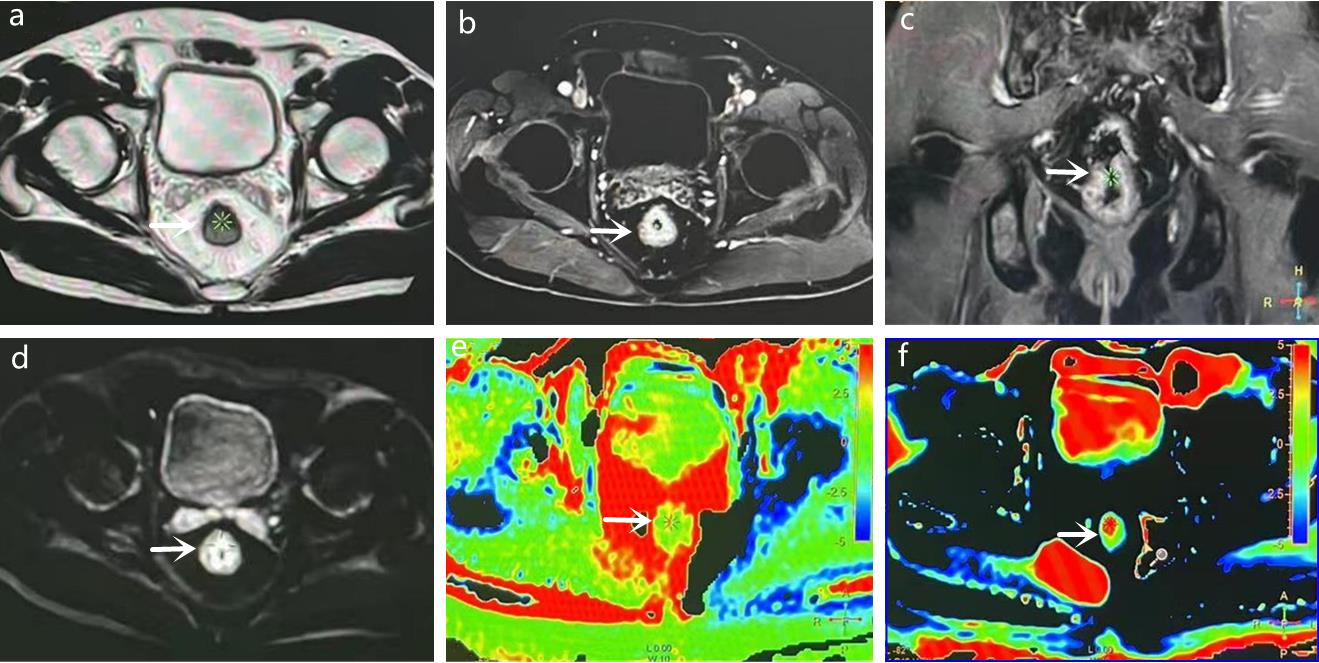
21 patients who underwent glucoCEST, APT, and DWI and had pathological findings of adenocarcinoma of the rectum were included. The glucoCEST SI was defined as 1.2 ppm of magnetization transfer asymmetry MTRasym (1.2 ppm), and the APT SI was defined as MTRasym (3.5 ppm). Apparent diffusion coefficient (ADC) plots were generated using b values of 0, and 1000 s/mm2. The regions of interest (ROI) were delineated and the SI of ATP, CEST, and ADC values of DWI were calculated. The differences in the values of each parameter between the high-grade (G3) and low-grade (G1+G2) tumor groups, and between the T2 and T3 stage groups were compared and analyzed separately. Student’s t-test, Spearman correlation, receiver operating characteristics (ROC) analysis, and Delong analysis were used for statistical analysis.Result
The high-grade group of rectal adenocarcinoma exhibited higher APTwSI, glucose CESTSI and lower ADC values. APTw SI, and glucoCEST SI all showed a positive correlation with tumor grade (r=0.529 and 0.611). The AUC of 3D-APTw SI, 3D-glucoCEST SI, and ADC in distinguishing high-grade and low-grade rectal adenocarcinoma were 0.823, 0.854, and 0.636, respectively. There was a statistical difference between AUC(APT) and AUC(ADC), AUC(glucoCEST) and AUC(ADC), respectively, and no statistical difference between AUC (APT) and AUC (glucoCEST). T3 rectal adenocarcinoma exhibited a higher APTw SI and glucoCEST SI than T2 tumors. ADC values were not statistically different between T2 and T3 tumors. AUC (APT) and AUC (glucoCEST) were 0.693 and 0.671, respectively, with no statistical difference between them.Discussion
It is generally believed that APTw SI responds to the mobile protein and peptide content within the tumor(5). In this study, ATPw SI was higher in the high-grade group than in the low-grade group, and ATPw SI was significantly and positively correlated with the grade of the tumor, and these were similar to the findings of Nishie et al. (2) and Chen et al. The reason may be that high-grade rectal cancer tumors are more proliferative, with higher cell density, and therefore higher levels of proteins and peptides. In addition, this study showed a higher APTw SI in rectal adenocarcinoma stage T3 compared to stage T2, which is generally consistent with previous findings (1). Rectal cancer with high T-stage is often aggressive, with high cell density and proliferation (5). Higher levels of proliferation require more protein synthesis, leading to protein accumulation and therefore the APTw SI is higher.The glucoCEST SI indirectly reflected the tissue glucose content. In this study, the glucoCEST SI was higher in the high-grade rectal adenocarcinoma group than in the low-grade group, and also positively correlated with tumor grade. This may be due to higher glucose uptake due to high proliferation of high-grade tumors. Furthermore, in the analysis comparing the glucoCEST SI of rectal adenocarcinoma stage T3 with stage T2, it was found that stage T3 had a higher glucoCEST SI, and this result was similar to the results of previous studies of FDG-PET in predicting the T-stage of rectal cancer (6). Through our analysis we believe this may be due to the fact that high T-stage rectal cancer usually has a large tumor size, increased cell density, and high proliferation, requiring more energy expenditure and leading to glucose accumulation.Conclusion
3D-GlucoCEST and 3D-APT can be used as imaging biomarkers for assessing rectal adenocarcinoma grade and T-stage, and both have comparable diagnostic efficacy.Acknowledgements
No acknowledgement found.References
1. Chen W, Li L, Yan Z, et al. Three-dimension amide proton transfer MRI of rectal adenocarcinoma: correlation with pathologic prognostic factors and comparison with diffusion kurtosis imaging. Eur Radiol 2021;31(5):3286-3296.
2. Nishie A, Takayama Y, Asayama Y, et al. Amide proton transfer imaging can predict tumor grade in rectal cancer. Magnetic resonance imaging 2018;51:96-103.
3. Xu X, Yadav NN, Knutsson L, et al. Dynamic Glucose-Enhanced (DGE) MRI: Translation to Human Scanning and First Results in Glioma Patients. Tomography 2015;1(2):105-114.
4. Walker-Samuel S, Ramasawmy R, Torrealdea F, et al. In vivo imaging of glucose uptake and metabolism in tumors. Nature medicine 2013;19(8):1067-1072.
5. Zhou J, Payen JF, Wilson DA, Traystman RJ, van Zijl PC. Using the amide proton signals of intracellular proteins and peptides to detect pH effects in MRI. Nature medicine 2003;9(8):1085-1090.6. Jiang Y, You K, Qiu X, et al. Tumor volume predicts local recurrence in early rectal cancer treated with radical resection: A retrospective observational study of 270 patients. Int J Surg 2018;49:68-73.
Figures