1221
Multiparametric MR imaging to identify the changes in normoalbuminuric diabetic kidney disease (NADKD) noninvasively1Kawasaki Medical School, Kurashiki, Japan, 2Philips Japan, Tokyo, Japan
Synopsis
Keywords: Kidney, fMRI
This study suggests the possibility that MRI using the values of CMD on optimal TI on SSFP with IR pulse with multi TI, which can sensitively capture fibrotic changes in the renal cortex of NADKD, can be a new parameter to evaluate NADKD non-invasively and in a short period of time.Introduction
The incidence of diabetic kidney disease (DKD) is increasing, and it has recently become the most common underlying disorder in dialysis patients. Early diagnosis is very important to stop the progression of DKD. Albuminuria and glomerular filtration rate (GFR) are widely accepted as criteria for the diagnosis and clinical grading of DKD, and microalbuminuria has been recommended as the first clinical sign of DKD. However, recent studies have shown that a portion of diabetes mellitus (DM) patients with normoalbuminuria have progressive renal insufficiency, referred to as normoalbuminuric diabetic kidney disease (NADKD). Due to the complexity of the pathophysiology of DKD, multiparametric evaluation using new parameters is required. Recent study shows parameters derived from magnetic resonance imaging (MRI) can evaluate kidney function1-4). However, there are no reports evaluating NADKD with MRI. The purpose of this study was to identify the changes in multiparametric MRI findings in NADKD.Methods
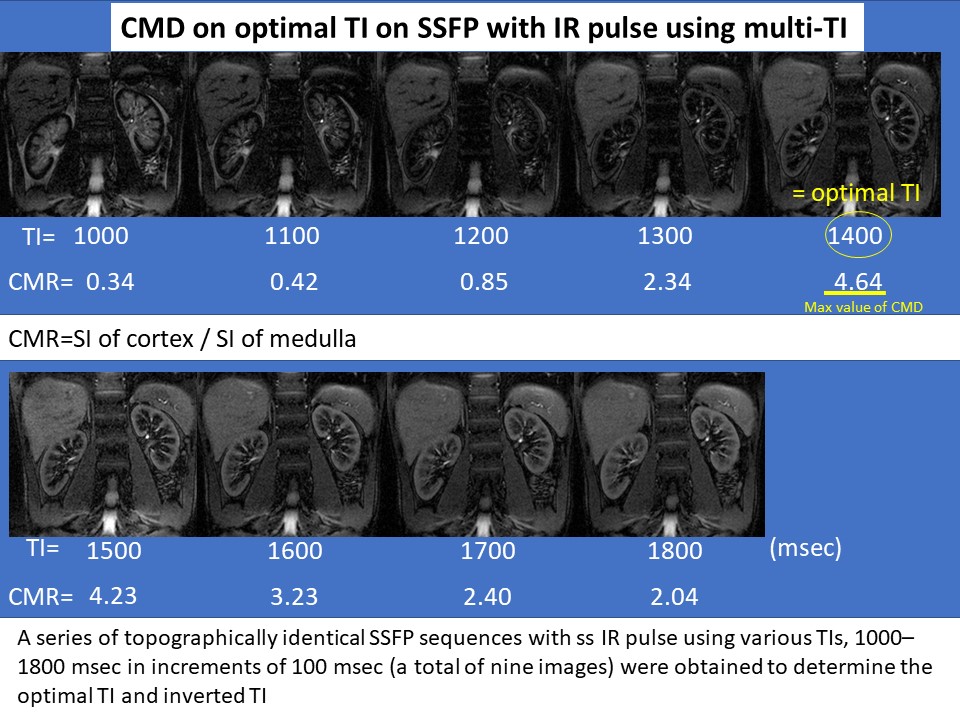
This prospective study was approved by our Institutional Review Board (IRB) and written informed consent was obtained from all participants. Study subjects were 36 patients of DM with normoalbuminuria who underwent multiparametric MRI (3.0 Tesla) without contrast. Patients were divided into two groups; patients with normal estimated GFR (>60 mL/min/1.73 m2) (early DN) group and patients with decreased estimated GFR (<60 mL/min/1.73 m2) (NADKD) group. MRI measurements were made of the renal cortex and renal medulla; T1 values, T2 values, blood oxygenation level dependent (BOLD) imaging (T2* values and R2* values), intravoxel incoherent motion (IVIM) imaging (ADC, f, D* and D values), arterial spin labeling (ASL) as well as CMD on optimal inversion time (TI) (= TI of maximum CMD (= signal intensity (SI) of cortex / SI of medulla) on steady-state free precession (SSFP) with inversion recovery (IR) pulse with multi TI (TI = 1000, 1100, 1200, 1300, 1400, 1500, 1600, 1700, 1800 msec) (Fig. 1). These parameters were compared between early DN groups and NADKD group.Results
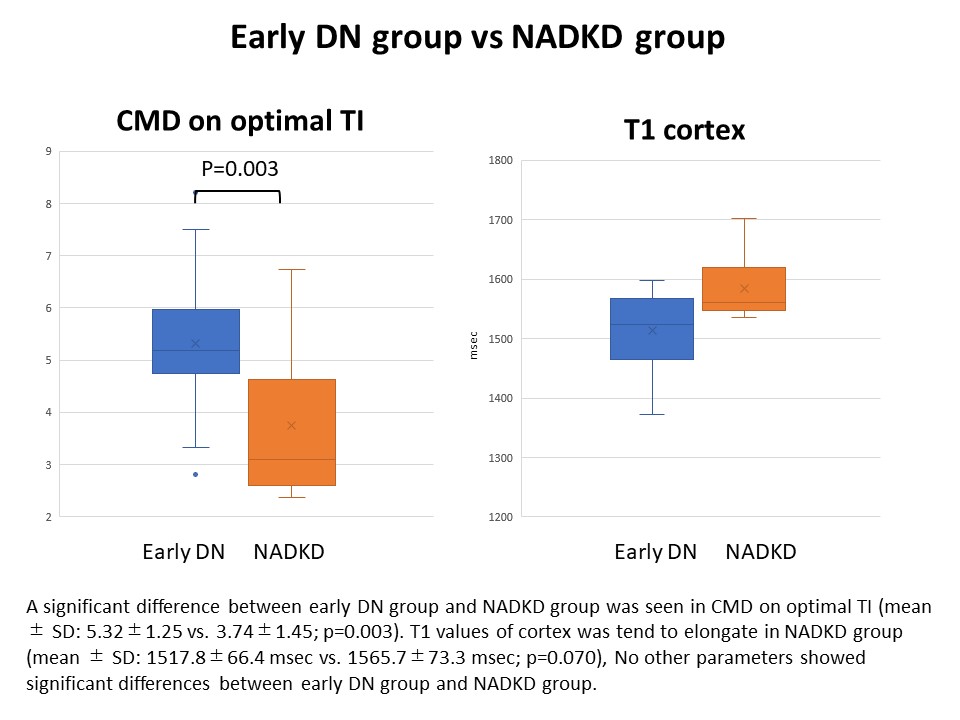
A significant difference between early DN group and NADKD group was seen in CMD on optimal TI (mean ± SD: 5.32±1.25 vs. 3.74±1.45; p=0.003). T1 values of cortex was tend to elongate in NADKD group (mean ± SD: 1517.8±66.4 msec vs. 1565.7±73.3 msec; p=0.070), No other parameters showed significant differences between early DN group and NADKD group.Discussion
Currently, the pathogenesis of NADKD remains unclear, but many clinical studies have identified some clinical and pathological features of NADKD. The renal structure in subjects with NADKD is more heterogeneous when compared to patients with classical DN with increased albuminuria, wherein interstitial changes and arteriolosclerosis could be the principal morphological findings, while signs of glomerulopathy may be absent. In this study, CMD on optimal TI was significant low in NADKD. There was a tendency for cortical T1 values to elongation with marginal significant. The cause of CMD change may be the result of cortical signal decline due to elongate T1 values, suggesting the possibility of capturing cortical fibrosis in NADKD. CDM on optimal TI might be sensitive indicators of the cortical fibrotic changes of NADKD.Conclusion
This study suggests the possibility that MRI using the values of CMD on optimal TI on SSFP with IR pulse with multi TI, which can sensitively capture fibrotic changes in the renal cortex of NADKD, can be a new parameter to evaluate NADKD non-invasively and in a short period of time.Acknowledgements
This work was supported by JSPS KAKENHI.References
1. Wolf M, de Boer A, Sharma K, et al. Magnetic resonance imaging T1- and T2-mapping to assess renal structure and function: a systematic review and statement paper. Nephrol Dial Transplant. 2018 Sep 1;33(suppl_2):ii41-ii50.
2. Noda Y, Ito K, Kanki A, et al. Measurement of renal cortical thickness using noncontrast-enhanced steady-state free precession MRI with spatially selective inversion recovery pulse: Association with renal function. J Magn Reson Imaging. 2015 Jun;41(6):1615-21.
3. Hall ME, Jordan JH, Juncos LA, et al. BOLD magnetic resonance imaging in nephrology. Int J Nephrol Renovasc Dis. 2018 Mar 13;11:103-112.
4. Parving HH, Mauer M, Ritz E. Diabetic nephropathy. In: Brenner BM, ed. Brenner and Rector’s The Kidney. 8th ed. Philadelphia, PA: Saunders Elsevier, 2007; 1265-1298
Figures