1220
Quantitative measurement of renal oxygenation in human using QSM and pCASL1Department of Bio and Brain Engineering, Korea Advanced Institute of Science and Technology, Daejeon, Korea, Republic of
Synopsis
Keywords: Kidney, Oxygenation
Measuring the renal oxygenation level is important because it is related to the progress of kidney diseases such as chronic kidney disease. In this study, we noninvasively quantified and mapped the renal metabolic rate of oxygen (RMRO2) using quantitative susceptibility mapping and pseudo-continuous arterial spin labeling and evaluated the results using the caffeine challenge. The results demonstrated higher renal oxygenation in the medulla than the cortex, and lower renal oxygenation on the caffeine day compared to the control day, as expected. This technique can be applied to identifying patients at risk of kidney diseases with no contrast agent.Introduction
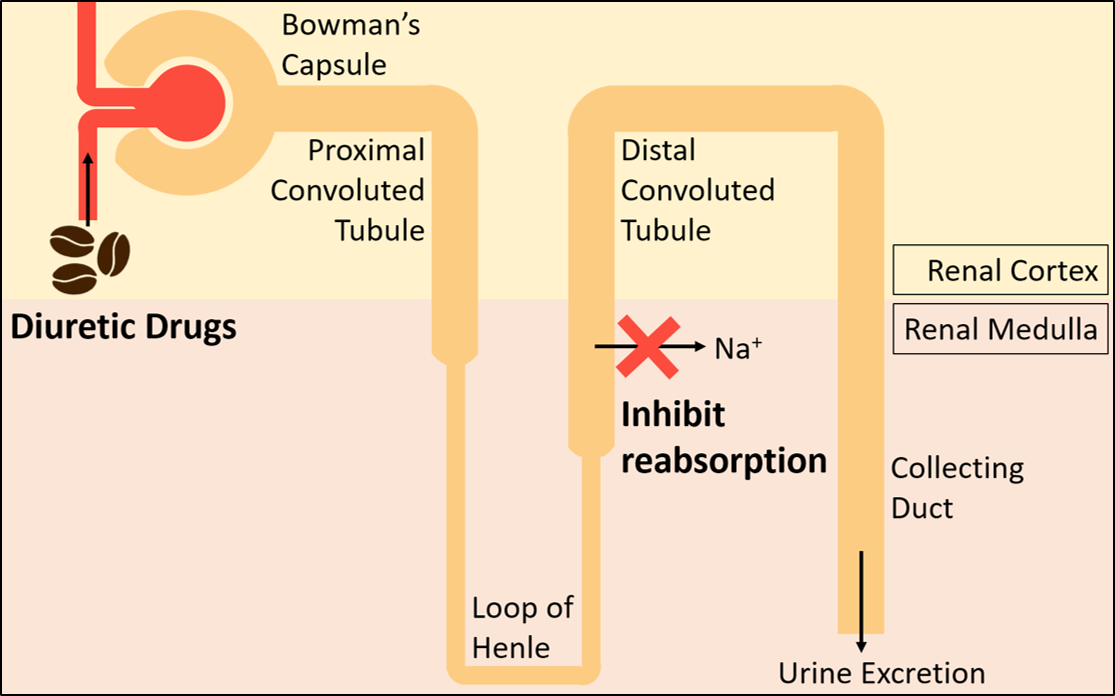
The kidney consumes a high level of oxygen (O2) mainly due to the reabsorption of filtered sodium (Na+) by the thick ascending loop of Henle. Evaluating the renal oxygenation level is imperative since disturbed oxygen consumption has the potential to progress to kidney diseases, such as chronic kidney disease (CKD)1. Previous studies have evaluated the renal metabolic rate of oxygen (RMRO2) in human using BOLD methods2. However, these methods have indirectly measured RMRO2 in percent changes. In this study, we provide RMRO2 maps quantified in an absolute unit (mmol/min/100g) and evaluate the capability to measure renal oxygenation with the caffeine challenge.Methods
(Theory) The RMRO2 is derived based on the model of CMRO2 proposed in Zhang et al. 3 from the Fick principle4 as below:$$RMRO_2 = 4 \cdot RBF \cdot [Hb] \cdot ([dHb]_v-[dHb]_a),$$where $$$RBF$$$ is the renal blood flow, $$$[Hb]$$$ is the hemoglobin concentration, and $$$[dHb]$$$ is the deoxyhemoglobin concentration in veins or arteries. The $$$[dHb]_v$$$ was determined from the equation below:
$$\chi = fRBV_v \cdot \psi_{Hb} \cdot ( X_{dHb} - X_{oHb}) \cdot \frac{[dHb]_v}{[Hb]} + \chi_0,$$
where the $$$fRBV_v$$$ is the fraction of venous blood in a voxel, $$$\psi_{Hb}$$$ is the volume fraction of Hb in the blood, $$$X_{dHb}$$$ and $$$X_{oHb}$$$ are the volume susceptibilities of pure $$$dHb$$$ and $$$oHb$$$, and the $$$\chi_0$$$ represents the susceptibility sources such as the arterial blood, pure oxygenated blood, or the tissue. The tissue susceptibility in kidney was assumed as $$$\chi_t \approx \frac{kidney \;ferritin \;level \;\cdot\; ferritin \;susceptibility}{kidney \;tissue \;density} = \frac{97.2ng/ml \;\cdot\; 1.10ppb/(ug \;Fe / g \;wet \;tissue)}{1.04g/ml}$$$ = 102.8ppb 5,6. In addition, $$$RBV = MTT \cdot RBF $$$, and the $$$MTT$$$ was indirectly estimated by $$$ MTT_{kidney} \approx \frac{MTT_{brain}}{ATT_{brain}}\cdot ATT_{kidney},$$$ where $$$MTT_{brain}$$$ = 3.0s 7 and the $$$ATT_{brain}$$$ = 1.3s 8. Then $$$RBV_{v} =0.60RBV$$$ and $$$RBV_{a} =0.60RBV$$$ were assumed9.
(MRI Experiments) Six male volunteers (28 ± 1.6Y) were examined on a 3T MRI (Verio, Siemens) on caffeine and control days. Subjects were administered 400mg of caffeine or an empty pill. The caffeine challenge was designed to examine if the measured RMRO2 reflects the changes in renal oxygenation upon the administration of diuretics, which inhibit the active reabsorption as in Figure 1. For pCASL imaging, the multi-slice multi-delay DWASL sequence10 was used to acquire images in coronal, with resolution=3.54$$$\times$$$3.54$$$\times$$$ 5 mm3 and matrix size = 96$$$\times$$$96$$$\times$$$8. For QSM imaging, the single-breath-hold 3D multi-echo gradient echo sequence was used for the acquisition of images in axial orientation with resolution=1.21$$$\times$$$1.21$$$\times$$$3 mm3 and matrix size=256$$$\times$$$192$$$\times$$$26.
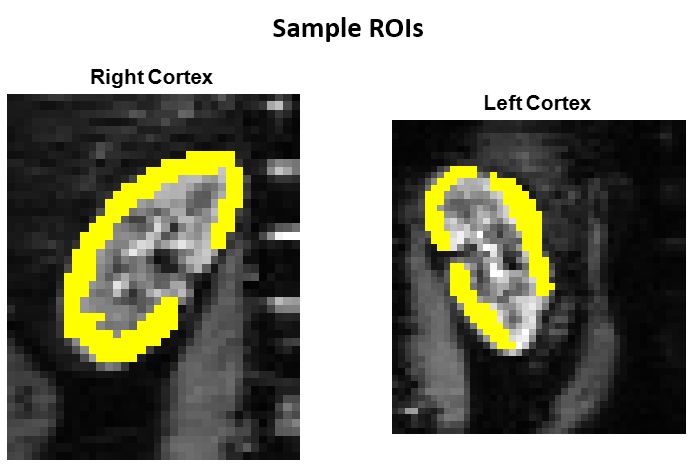
(Data Analysis) By using the pCASL data, the renal blood flow (RBF) and the arterial transit time (ATT) maps were calculated. The QSM maps were processed using the ALOHA method11. The pCASL and QSM parameter maps were registered first by using DICOM headers, and then by the rigid transform using SimpleElastix. The images were cropped and then registered again using the translation transform on SimpleElastix. The Wilcoxon signed-rank test was performed to compare the parameters on the control and caffeine days.
Results
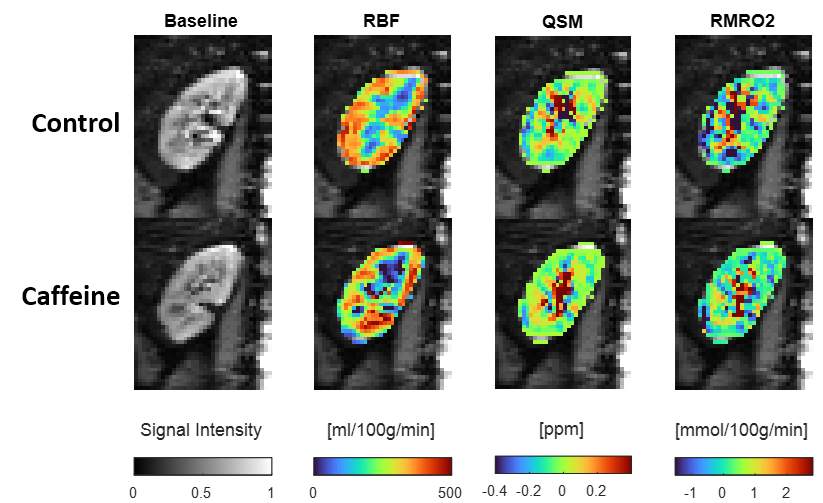
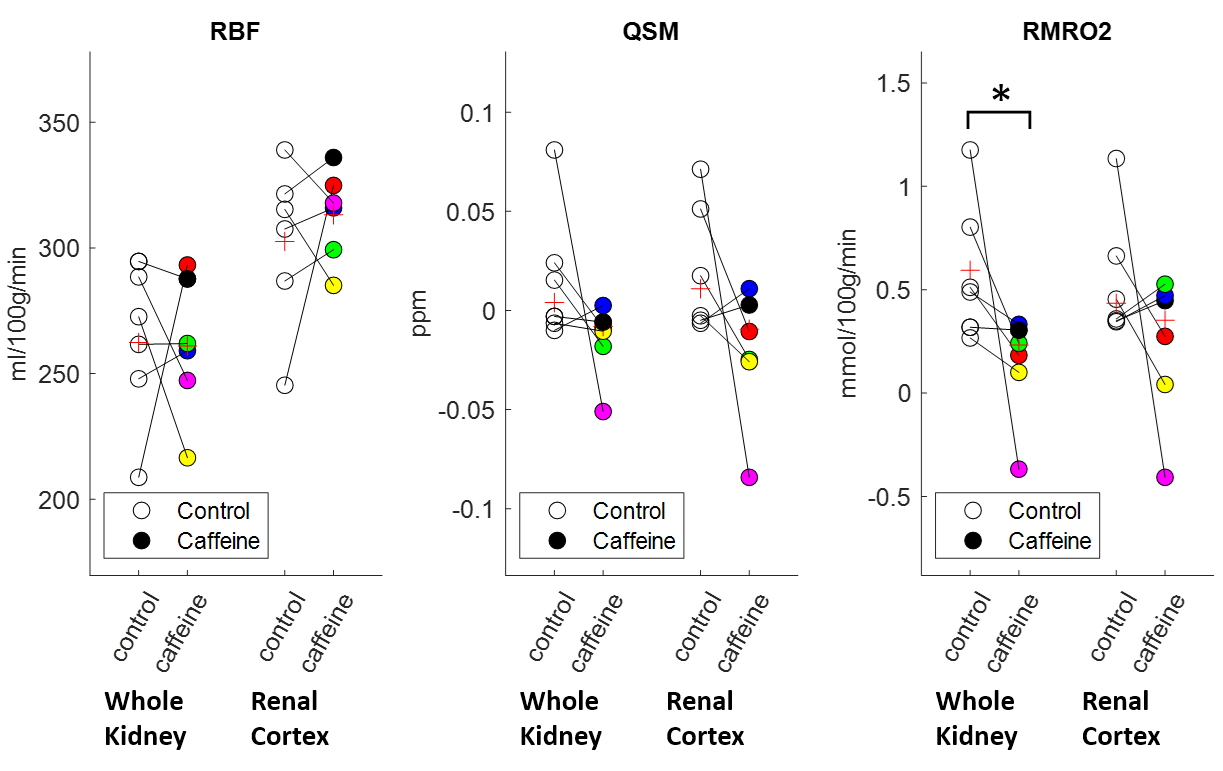
The resulting maps of the control and caffeine days are compared in Figure 2. The RBF maps showed higher blood flow in the renal cortex. The QSM and the RMRO2 values were slightly higher in the medulla than in the cortex. Figure 3 shows the caffeine challenge results of the three parameters of the six subjects. The RBF and QSM values did not change significantly after the caffeine intake. The RMRO2 values were slightly higher in the whole kidney than in the cortex (Figure 4), and the values were significantly reduced after the caffeine intake (p=0.03).Discussion
The loop diuretic drugs, including caffeine, inhibit active transport and oxygen consumption in the medullary thick ascending limb. In this work, the RMRO2 was estimated and the caffeine challenge results were compared. The RMRO2 was higher in the medulla compared to the cortex (Figure 2) for both control and caffeine days. In addition, the value was lower after the administration of caffeine (Figure 3) as expected, especially in the regions that involve the medulla. The calculated RMRO2 values were higher than the cerebral metabolic rate of oxygen (CMRO2) as expected since the kidney uses about 1.4 times more O2 per 100g tissue compared to the brain12. The high RMRO2 was mostly due to the RBF (260 ml/100g/min in the whole kidney in Figure 3), which is reported to be more than six times higher than the CBF13,14. Future studies may include more precisely estimating MTT to improve the RMRO2 values, or measuring oxygen extraction fraction (OEF) maps or venous deoxyhemoglobin concentration maps to further clarify the results.Conclusion
In this work, we demonstrated the feasibility of renal oxygenation using QSM and ASL. We have noninvasively quantified and mapped renal oxygenation in an absolute unit in human for the first time to our knowledge. The results were consistent with the literature and were evaluated with a caffeine challenge. These suggest that this technique can be utilized to measure the RMRO2 and may potentially be applied to identifying the patients at increased risk of kidney diseases with no contrast agent.Acknowledgements
No acknowledgement found.References
1. Singh, P., Ricksten, S.-E., Bragadottir, G., Redfors, B. and Nordquist, L. Renal oxygenation and haemodynamics in acute kidney injury and chronic kidney disease. Clin Exp Pharmacol Physiol. 2013; 40: 138-147.
2. Prasad, P., Edelman R., and Epstein F. Noninvasive Evaluation of Intrarenal Oxygenation With BOLD MRI. Circulation. 1996; 94: 3271-3275.
3. Zhang, J., Liu, T., Gupta, A., Spincemaille, P., Nguyen, T.D. and Wang, Y. Quantitative mapping of cerebral metabolic rate of oxygen (CMRO2) using quantitative susceptibility mapping (QSM). Magn. Reson. Med., 2015; 74: 945-952.
4. Kety S., and Schmidt C. The determination of cerebral blood flow in man by the use of nitrous oxide in low concentrations. Am. J. Physiol. 1945; 33-52
5. Kang, H.-T.; Linton, J.A.; Kwon, S.K.; Park, B.-J.; Lee, J.H. Ferritin Level Is Positively Associated with Chronic Kidney Disease in Korean Men, Based on the 2010–2012 Korean National Health and Nutrition Examination Survey. Int. J. Environ. Res. Public Health 2016, 13, 1058
6. Liu, M., Liu, S., Ghassaban, K., Zheng, W., Dicicco, D., Miao, Y., Habib, C., Jazmati, T. and Haacke, E.M. (2016), Assessing global and regional iron content in deep gray matter as a function of age using susceptibility mapping. J. Magn. Reson. Imaging, 44: 59-71.
7. Ibaraki M, Ito H, Shimosegawa E, et al. Cerebral Vascular Mean Transit Time in Healthy Humans: A Comparative Study with PET and Dynamic Susceptibility Contrast-Enhanced MRI. Journal of Cerebral Blood Flow & Metabolism. 2007;27(2):404-413.
8. Ahn, H-S, et al. Quantication of blood-brain barrier water permeability and arterial blood volume with multi-slice multi-delay diusion-weighted ASL. Proceedings of ISMRM (2020): Vol.470.
9. Wolff, C.B. et al. (2016). A Discussion on the Regulation of Blood Flow and Pressure. In: Elwell, C.E., Leung, T.S., Harrison, D.K. (eds) Oxygen Transport to Tissue XXXVII. Advances in Experimental Medicine and Biology, vol 876. Springer, New York, NY
10. Ahn, H-S, Jung, Y, Park, S-H. Measuring glomerular blood transfer rate in kidney using diffusion-weighted arterial spin labeling. Magn Reson Med. 2022; 88: 2408- 2418.
11. Ahn, HS, Park, SH, Ye, JC. Quantitative susceptibility map reconstruction using annihilating filter-based low-rank Hankel matrix approach. Magn Reson Med. 2020; 83: 858– 871.
12. Rink, C. and Khanna S. Significance of Brain Tissue Oxygenation and the Arachidonic Acid Cascade in Stroke. Antioxidants & Redox Signaling. 2011; 14:1889-1903.
13. Kannenkeril D, Janka R, Bosch A, Jung S, Kolwelter J, Striepe K, Ott C, Martirosian P, Schiffer M, Uder M, Schmieder R, E. Detection of Changes in Renal Blood Flow Using Arterial Spin Labeling MRI. Am J Nephrol. 2021; 52:69-75.
14. Sergio Fantini, Angelo Sassaroli, Kristen T. Tgavalekos, Joshua Kornbluth. Cerebral blood flow and autoregulation: current measurement techniques and prospects for noninvasive optical methods. Neurophoton. 2016; 3(3) 031411.
Figures