1219
Feasibility of integrating 6 diffusion models within a single acquisition and their performance comparison in liver fibrosis staging1magnetic resonance imaging department, Lanzho u university second hospital, LANZHOU, China, 2Lanzhou university, LANZHOU, China, 3Gansu Province Clinical Research Center for Functional and Molecular Imaging, LANZHOU, China, 4Siemens Healthineer, ShangHai, China
Synopsis
Keywords: Liver, Diffusion/other diffusion imaging techniques
DWI has been broadly used in clinical practice, which can provide quantitative parameters. Several DWI models have been used for liver fibrosis staging but diagnostic performance variance in different research because their acquisitions are different and normally difficult to be compared in one study. In this study, we compared 6 DWI models, including 14 parameters in detecting significant liver fibrosis using date from one acquisition. The results showed that the DWI models were similarly valuable in detecting significant liver fibrosis in patients with liver disease. The combined index with the three parameters of CTRW model had the highest AUC.Introduction and purpose
Liver fibrosis, a public health problem, is a dynamic process and actually reversible1. Noninvasive staging liver fibrosis is of great important in clinical practice. This study aimed to evaluate the clinical potential of 6 different MRI diffusion-weighted models in liver fibrosis staging and compare their diagnostic performances using date from one acquisition.Materials and Methods
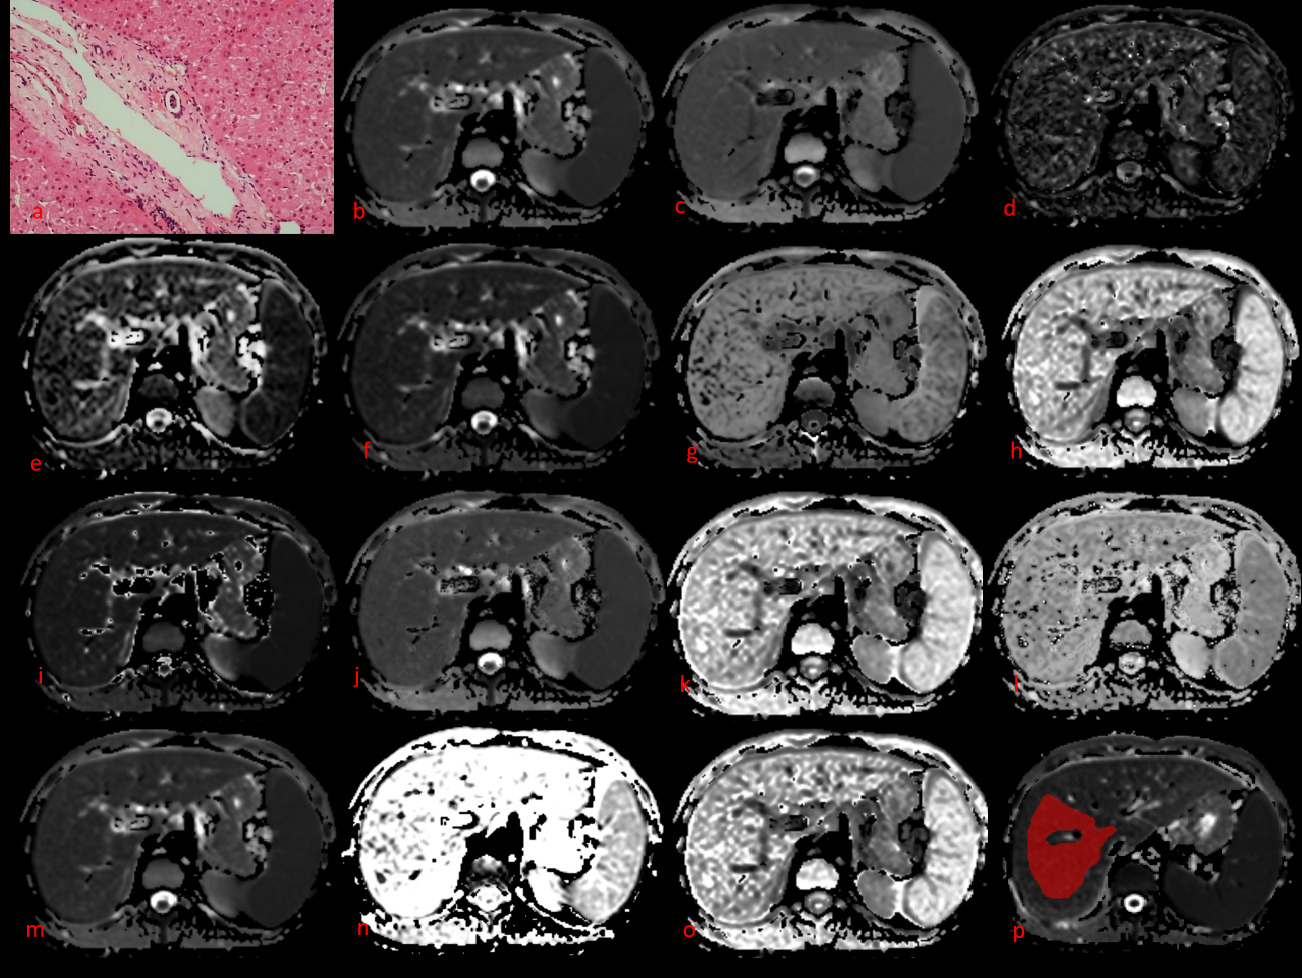
This prospective study enrolled 59 patients suspected of liver disease and scheduled for liver biopsy and 17 healthy participants between October 2021 and June 2022. All participants underwent MRI scan on a 1.5T MR scanner (MAGNETOM Aera, Siemens Healthcare, Erlangen, Germany). Multi-b value DWI was performed based on a breath-free single-shot spin-echo echo planar imaging sequence with the following parameters: repetition time (TR), 6800 ms; time to echo (TE), 58 ms; field of view (FOV), 300×380 mm; matrix, 108×134; section thickness, 6 mm; b values; 0, 50, 100, 150, 200, 400, 600, 800, 1000, 1200, 1500, and 2000 s/mm2; total scan time, 16 min and 48 s. The parametric results of 6 different DWI models were calculated using an in-house prototype software developed by MRStation (Chengdu Zhongying Medical Technology Co.). DWI-derived parameters(Figure 1) included apparent diffusion coefficient (ADC) derived from mono-exponential DWI, perfusion fraction (IVIM-f), pseudo-diffusion coefficient (IVIM-D*), and true diffusion coefficient (IVIM-D) derived from IVIM, mean diffusion (DKI-MD) and mean kurtosis (DKI-MK) derived from diffusion kurtosis imaging (DKI), distributed diffusion coefficient (SEM-DDC) and intravoxel heterogeneity index (SEM-α) derived from the stretched exponential model (SEM), anomalous D (FROC-D), fractional order parameter (FROC-β) and microstructural quantity (FROC-μ) sourced from fractional order calculus model (FROC), and anomalous D (CTRW-D), temporal diffusion (CTRW-α), and spatial diffusion heterogeneity index (CTRW-β) sourced from the continuous-time random-walk model (CTRW). All 59 patients underwent liver biopsy for fibrosis staging. The correlations between DWI-derived parameters and fibrosis stages and the parameters’ diagnostic efficacy in detecting significant fibrosis were assessed and compared.Results
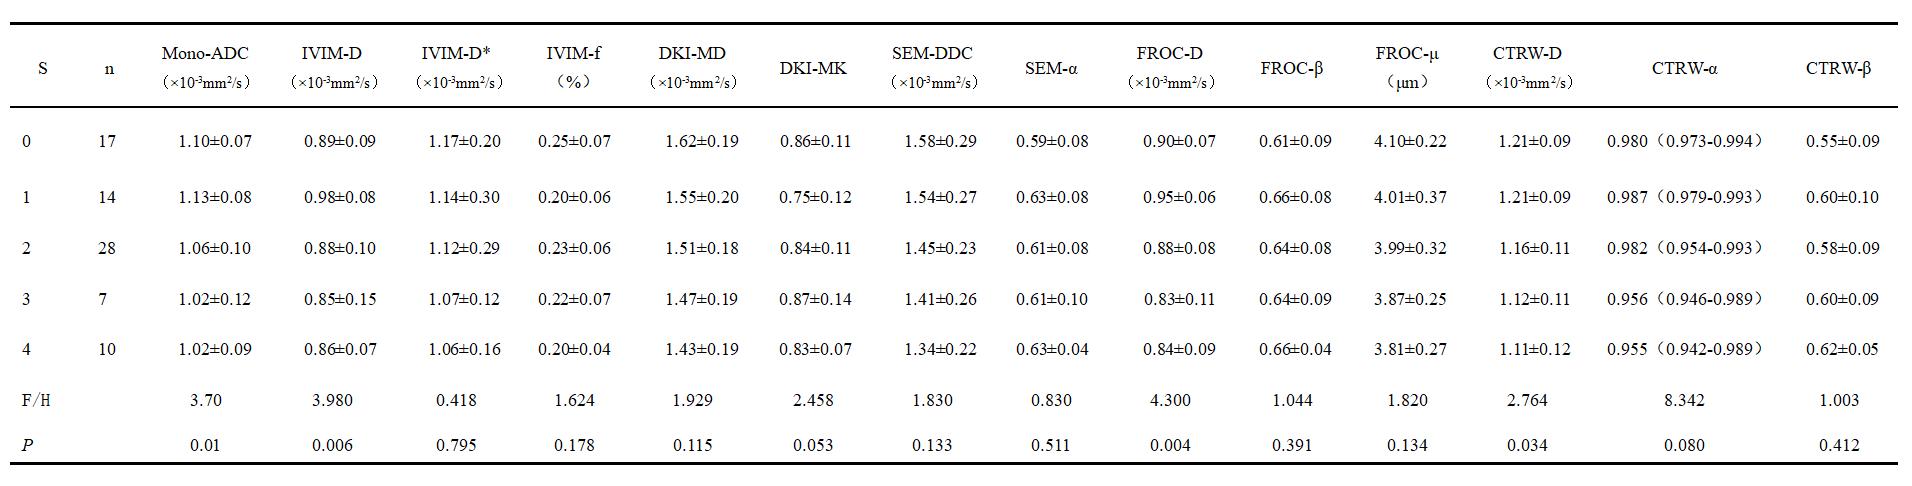
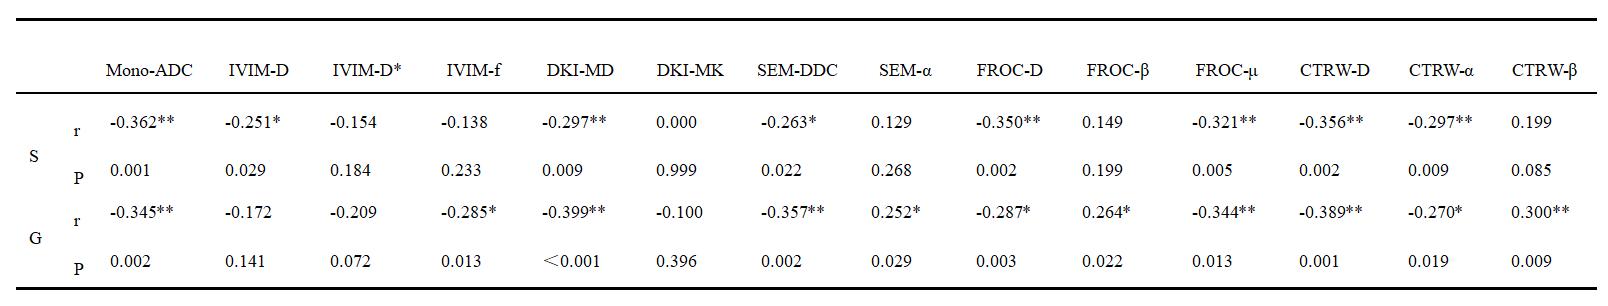
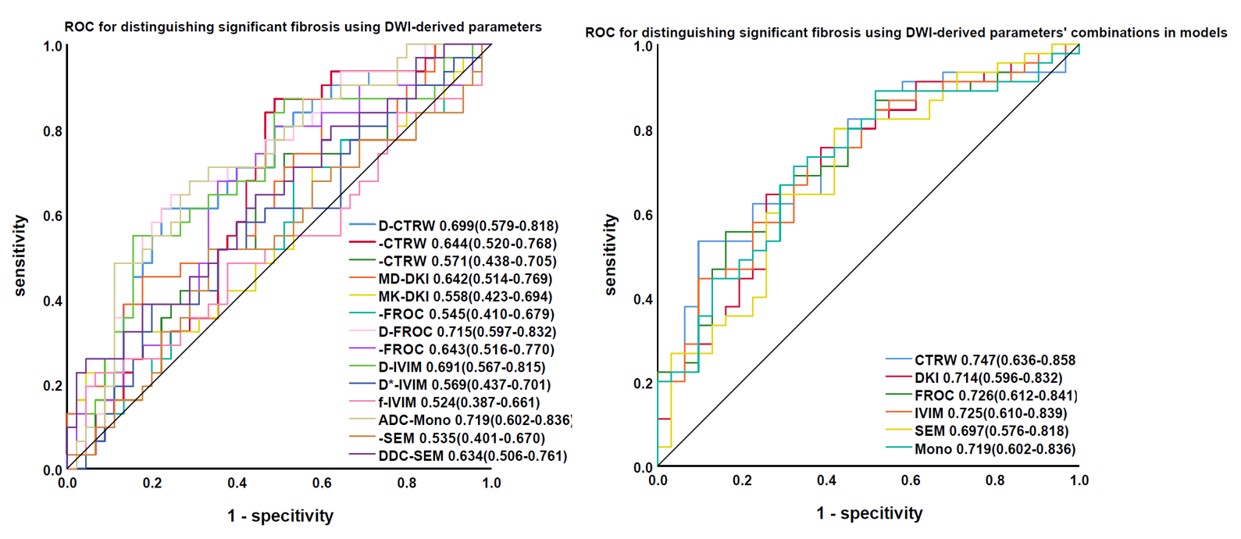
The DWI-derived parameters’ difference in liver fibrosis stages were shown in Table 1. Here existed significant differences among liver fibrosis stages for DWI-derived parameters including Mono-ADC, IVIM-D, FROC-D, CTRW-D, CTRW-α. CTRW-D (r = –0.356), CTRW-α (r = –0.297), DKI-MD (r = –0.297), FROC-D (r = –0.350), FROC-μ (r = –0.321), IVIM-D (r = –0.251), Mono-ADC (r = –0.362), and SEM-DDC (r = –0.263) were significantly correlated with fibrosis stages (Table 2). The areas under the curve (AUCs) of the combined index of the Mono, IVIM, DKI, SEM, FROC, and CTRW models for distinguishing significant fibrosis (0.697–0.747) were higher than each of the parameters alone (0.524–0.719), shown in Figure 2. The single DWI models’ ability to detect significant liver fibrosis was similarly.Discussion and conclusion
In this study, we compared six diffusion models which contain 14 quantitative parameters based on one single acquisition for liver fibrosis staging. Our study found that D values (ADC, IVIM-D, DKI-MD, SEM-DDC, FROC-D, CTRW-D) derived from various DWI models, FROC-μ, and CTRW-α were significantly correlated with the fibrosis stages, demonstrating their potential as noninvasive assessment tools for liver fibrosis. Furthermore, the combined CTRW-derived parameters resulted in a better diagnostic performance than other DWI models.The D values are a core parameter in all the assessed DWI models. These might have different names in the various DWI models, but they all probe the tissue molecular diffusion properties under Gaussian or non-Gaussian diffusion behavior. They all showed a significant negative correlation with the fibrosis stage, as previously reported2-6. This is possibly because the diffusion of water molecules is restricted due to the increased deposition of the extracellular matrix and the aggravation of liver fibrosis. All these D values contributed to the diagnostic performance of the models in distinguishing SF. As a novel DWI model, the CTRW model recognizes time and space intravoxel diffusion heterogeneity. These diffusion heterogeneities can directly reflect intravoxel structural heterogeneity, which is related to tissue complexity and microenvironment heterogeneity7. As liver fibrosis develops, depositions in the extracellular matrix and changes in blood supply lead to increased microstructural complexity8. These changes provide a basis for liver fibrosis staging. To our knowledge, few studies used the CTRW model to assess the liver. However, several studies showed the usefulness of the CTRW model in distinguishing low- from high-grade brain tumors7, 9. In our study, the D and α parameters derived from the CTRW model showed significant negative correlations with the fibrosis stages. The α value is a specific parameter of the CTRW model. It represents the temporal heterogeneity arising from the underlying tissue structural heterogeneity. Another CTRW-specific parameter is β, but its correlation with the fibrosis stages was insignificant. The lack of significance could be due to: 1) a sample size too small to detect an association; 2) uneven distribution of the patients among the fibrosis stages. A more precise relationship awaits our future analysis.Conclusion: In conclusion, the 6 different DWI models were similarly valuable in staging liver fibrosis in patients with liver disease. The combined index with the three CTRW parameters had the highest AUC (0.747).Acknowledgements
No acknowledgement found.References
1. Marcellin P, Gane E, Buti M, et al. Regression of cirrhosis during treatment with tenofovir disoproxil fumarate for chronic hepatitis B: a 5-year open-label follow-up study. 2013;381:468-75.
2. Yoon J, Lee J, Baek J, et al. Evaluation of hepatic fibrosis using intravoxel incoherent motion in diffusion-weighted liver MRI. Journal of computer assisted tomography. 2014;38:110-6.
3. Taouli B, Chouli M, Martin AJ, et al. Chronic hepatitis: role of diffusion-weighted imaging and diffusion tensor imaging for the diagnosis of liver fibrosis and inflammation. J Magn Reson Imaging. 2008;28:89-95.
4. Anderson S, Barry B, Soto J, et al. Characterizing non-gaussian, high b-value diffusion in liver fibrosis: Stretched exponential and diffusional kurtosis modeling. Journal of magnetic resonance imaging : JMRI. 2014;39:827-34.
5. Dyvorne H, Jajamovich G, Bane O, et al. Prospective comparison of magnetic resonance imaging to transient elastography and serum markers for liver fibrosis detection. Liver international : official journal of the International Association for the Study of the Liver. 2016;36:659-66.
6. Fu F, Li X, Liu Q, et al. Noninvasive DW-MRI metrics for staging hepatic fibrosis and grading inflammatory activity in patients with chronic hepatitis B. Abdominal radiology (New York). 2021;46:1864-1875.
7. Karaman M, Sui Y, Wang H, et al. Differentiating low- and high-grade pediatric brain tumors using a continuous-time random-walk diffusion model at high b-values. Magnetic resonance in medicine. 2016;76:1149-57.
8. Yang L, Rao S, Wang W, et al. Staging liver fibrosis with DWI: is there an added value for diffusion kurtosis imaging? European radiology. 2018;28:3041-3049.
9. Karaman M, Zhang J, Xie K, Zhu W, and Zhou X. Quartile histogram assessment of glioma malignancy using high b-value diffusion MRI with a continuous-time random-walk model. NMR in biomedicine. 2021;34:e4485.
Figures