1218
Predicting microvascular invasion of HCC using whole-lesion histogram analysis with the interstitial fluid pressure and velocity model1Shanghai Institute of Medical Imaging, Shanghai, China, 2Department of Radiology, Zhongshan Hospital, Fudan University, Shanghai, China, 3Shenzhen United Imaging Research Institute of Innovative Medical Equipment, Shenzhen, China, 4MR Collaboration, Central Research Institute, United Imaging Healthcare, Shanghai, China
Synopsis
Keywords: Liver, Liver
Most solid tumors have increased interstitial fluid pressure (IFP), and the increased IFP is an obstacle to treatment. This study applied a non-invasive dynamic contrast-enhanced magnetic resonance imaging-based model to acquire IFP and interstitial fluid velocity (IFV). Based on the IFP and IFV maps, histogram analysis was applied to evaluate the spatial distributions of pixel gray levels with reduced sampling bias. IFP- and IFV-derived parameters have proven to be significant predictors of microvascular invasion status. Therefore, this optimal model, together with histogram analysis, offers a new way for in vivo and non-invasive assessment of hepatocellular carcinoma.Introduction
Preoperative assessment of microvascular invasion (MVI) is critical for developing treatment strategies to improve therapeutic outcomes in patients with hepatocellular carcinoma (HCC). Liver magnetic resonance imaging (MRI), especially with the use of contrast agents, its visual assessment by radiologists revealed that some image features were correlated with MVI, including non-smooth tumor margins [1], incomplete tumor capsule [2], arterial rim enhancement [3], and arterial peritumoral enhancement [4]. However, controversy remains regarding the positive predictive value of these anatomical radiological features. The development of advanced MRI techniques, such as dynamic contrast-enhanced (DCE) perfusion MRI, could extend beyond anatomic visualization to characterize tumor physiology. Technically, based on DCE-MRI, the extended Tofts pharmacokinetic model (ETM) can be used to quantify surrogate measures of vascular permeability (i.e., the volume transfer constant, Ktrans [min−1]). Recently, a non-invasive computational fluid model (CFM) was developed to estimate tumor interstitial fluid pressure (IFP) using the volume transfer constant (Ktrans) obtained from the extended Tofts pharmacokinetic (ETM) model. This study aimed to predict the microvascular invasion of hepatocellular carcinoma using whole-lesion histogram analysis with the interstitial fluid pressure and velocity model.Methods
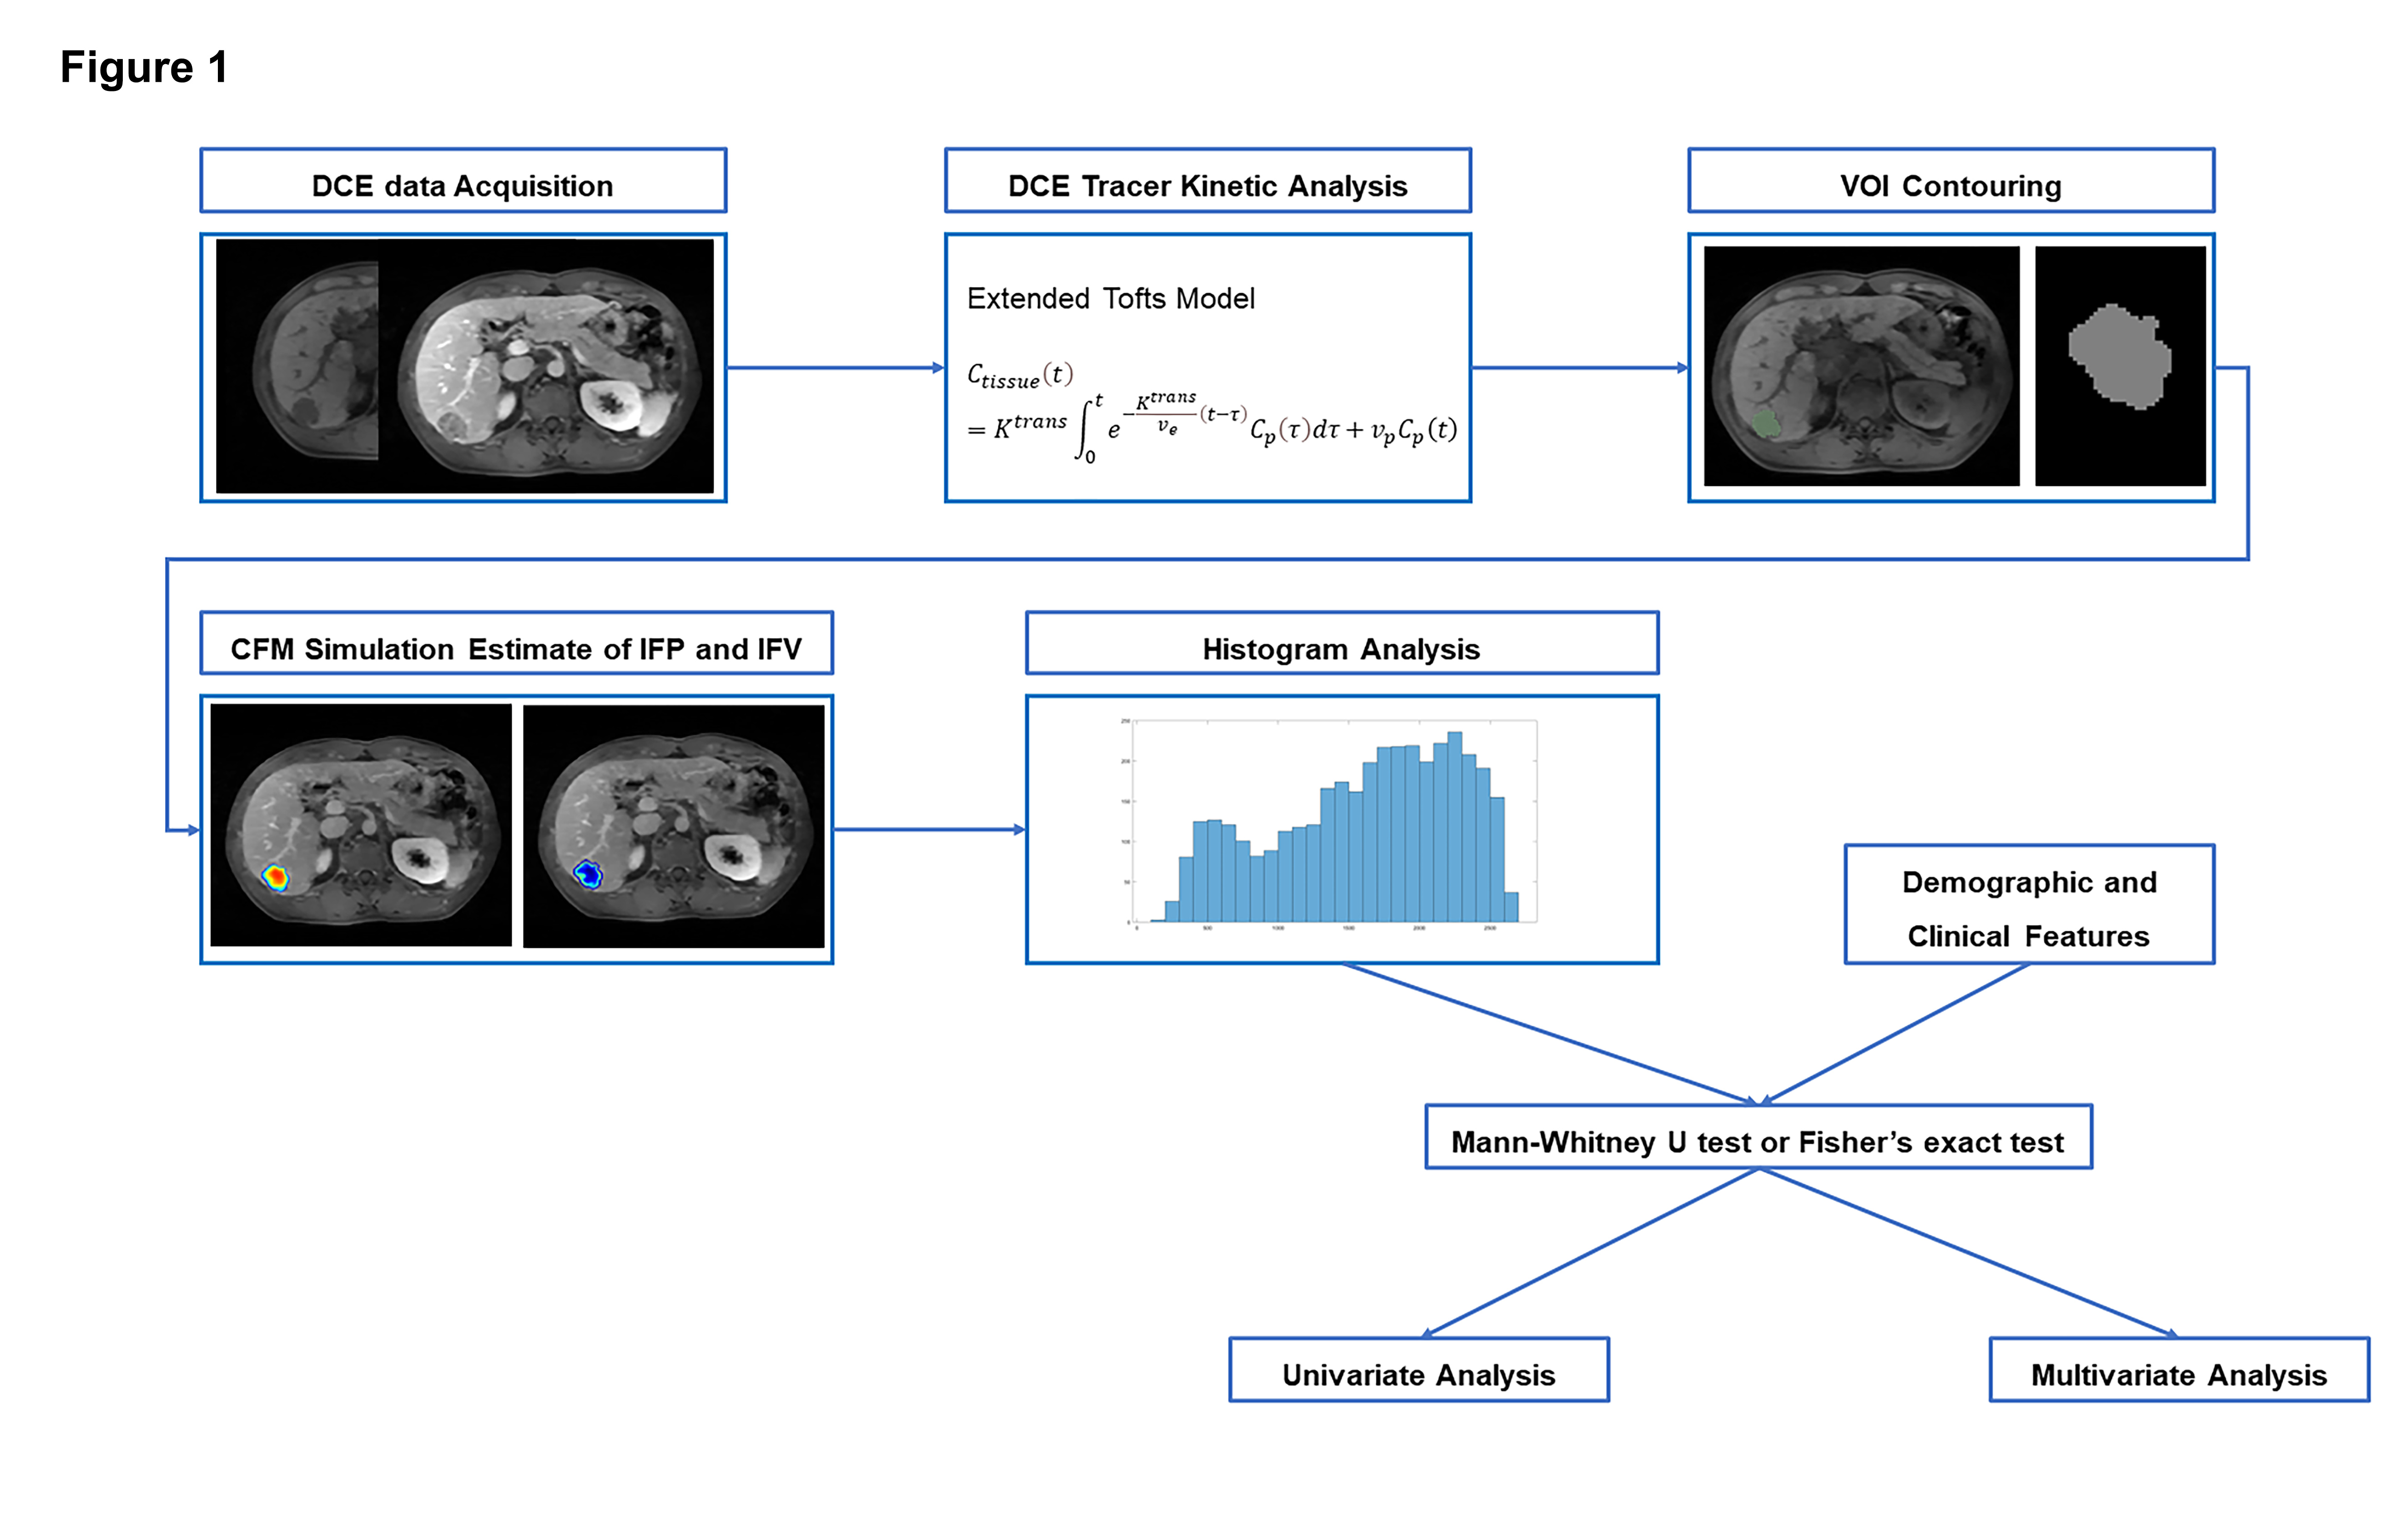
A cohort of 97 patients was included in this study (mean age 57.6 ± 10.9 years, 77.3% males). There were 53 (54.6%) patients in the MVI-positive group and 44 (45.4%) in the MVI-negative group. MRI examinations were performed using a 3T scanner (United Imaging Healthcare, Shanghai, China). The liver imaging protocol included the following sequences in all patients: (1) breath-hold T1-weighted three-dimensional (3D) gradient-recalled echo (GRE) with fat suppression; (2) breath-hold T2-weighted fast spin-echo (FSE) with fat suppression; and (3) Diffusion-weighted imaging (DWI) with a respiratory-triggered single-shot echo-planar imaging sequence with b values of 0, 50 and 500 sec/mm2. To produce robust and accurate quantitative pharmacokinetic analysis, pre-contrast T1 mapping with four flip angles (3°, 7°, 11°, and 15°) was performed. DCE-MRI was acquired by 3D spoiled GRE sequence before, during, and after the injection of a contrast agent bolus. A standard dose of 0.2 mL/kg of gadopentetate dimeglumine was injected intravenously at a rate of 2 mL/s. Immediately afterwards, a 20 mL saline flush was administered at the same injection rate. Sixty timepoints were acquired with a mean temporal resolution of 3.1 s and a total acquisition time of ~3 min. The patients were allowed to breathe freely.A flow diagram of image analysis is shown in Figure 1. The extended tofts model (ETM) was used to estimate the permeability parameters. Subsequently, the continuity partial differential equation (PDE) was implemented and the IFP and IFV were acquired [5]. Based on IFP and IFV maps, histogram analysis was performed, and descriptive statistics, including mean, standard deviation (SD), max, min, median, kurtosis, skewness, and 10th, 25th, 75th, and 90th percentiles were computed. The Mann-Whitney U test was applied to compare the IFP- and IFV-derived parameters between the MVI-positive and -negative groups. For all significant predictors, receiver operating characteristic (ROC) curve analysis was performed.
Results
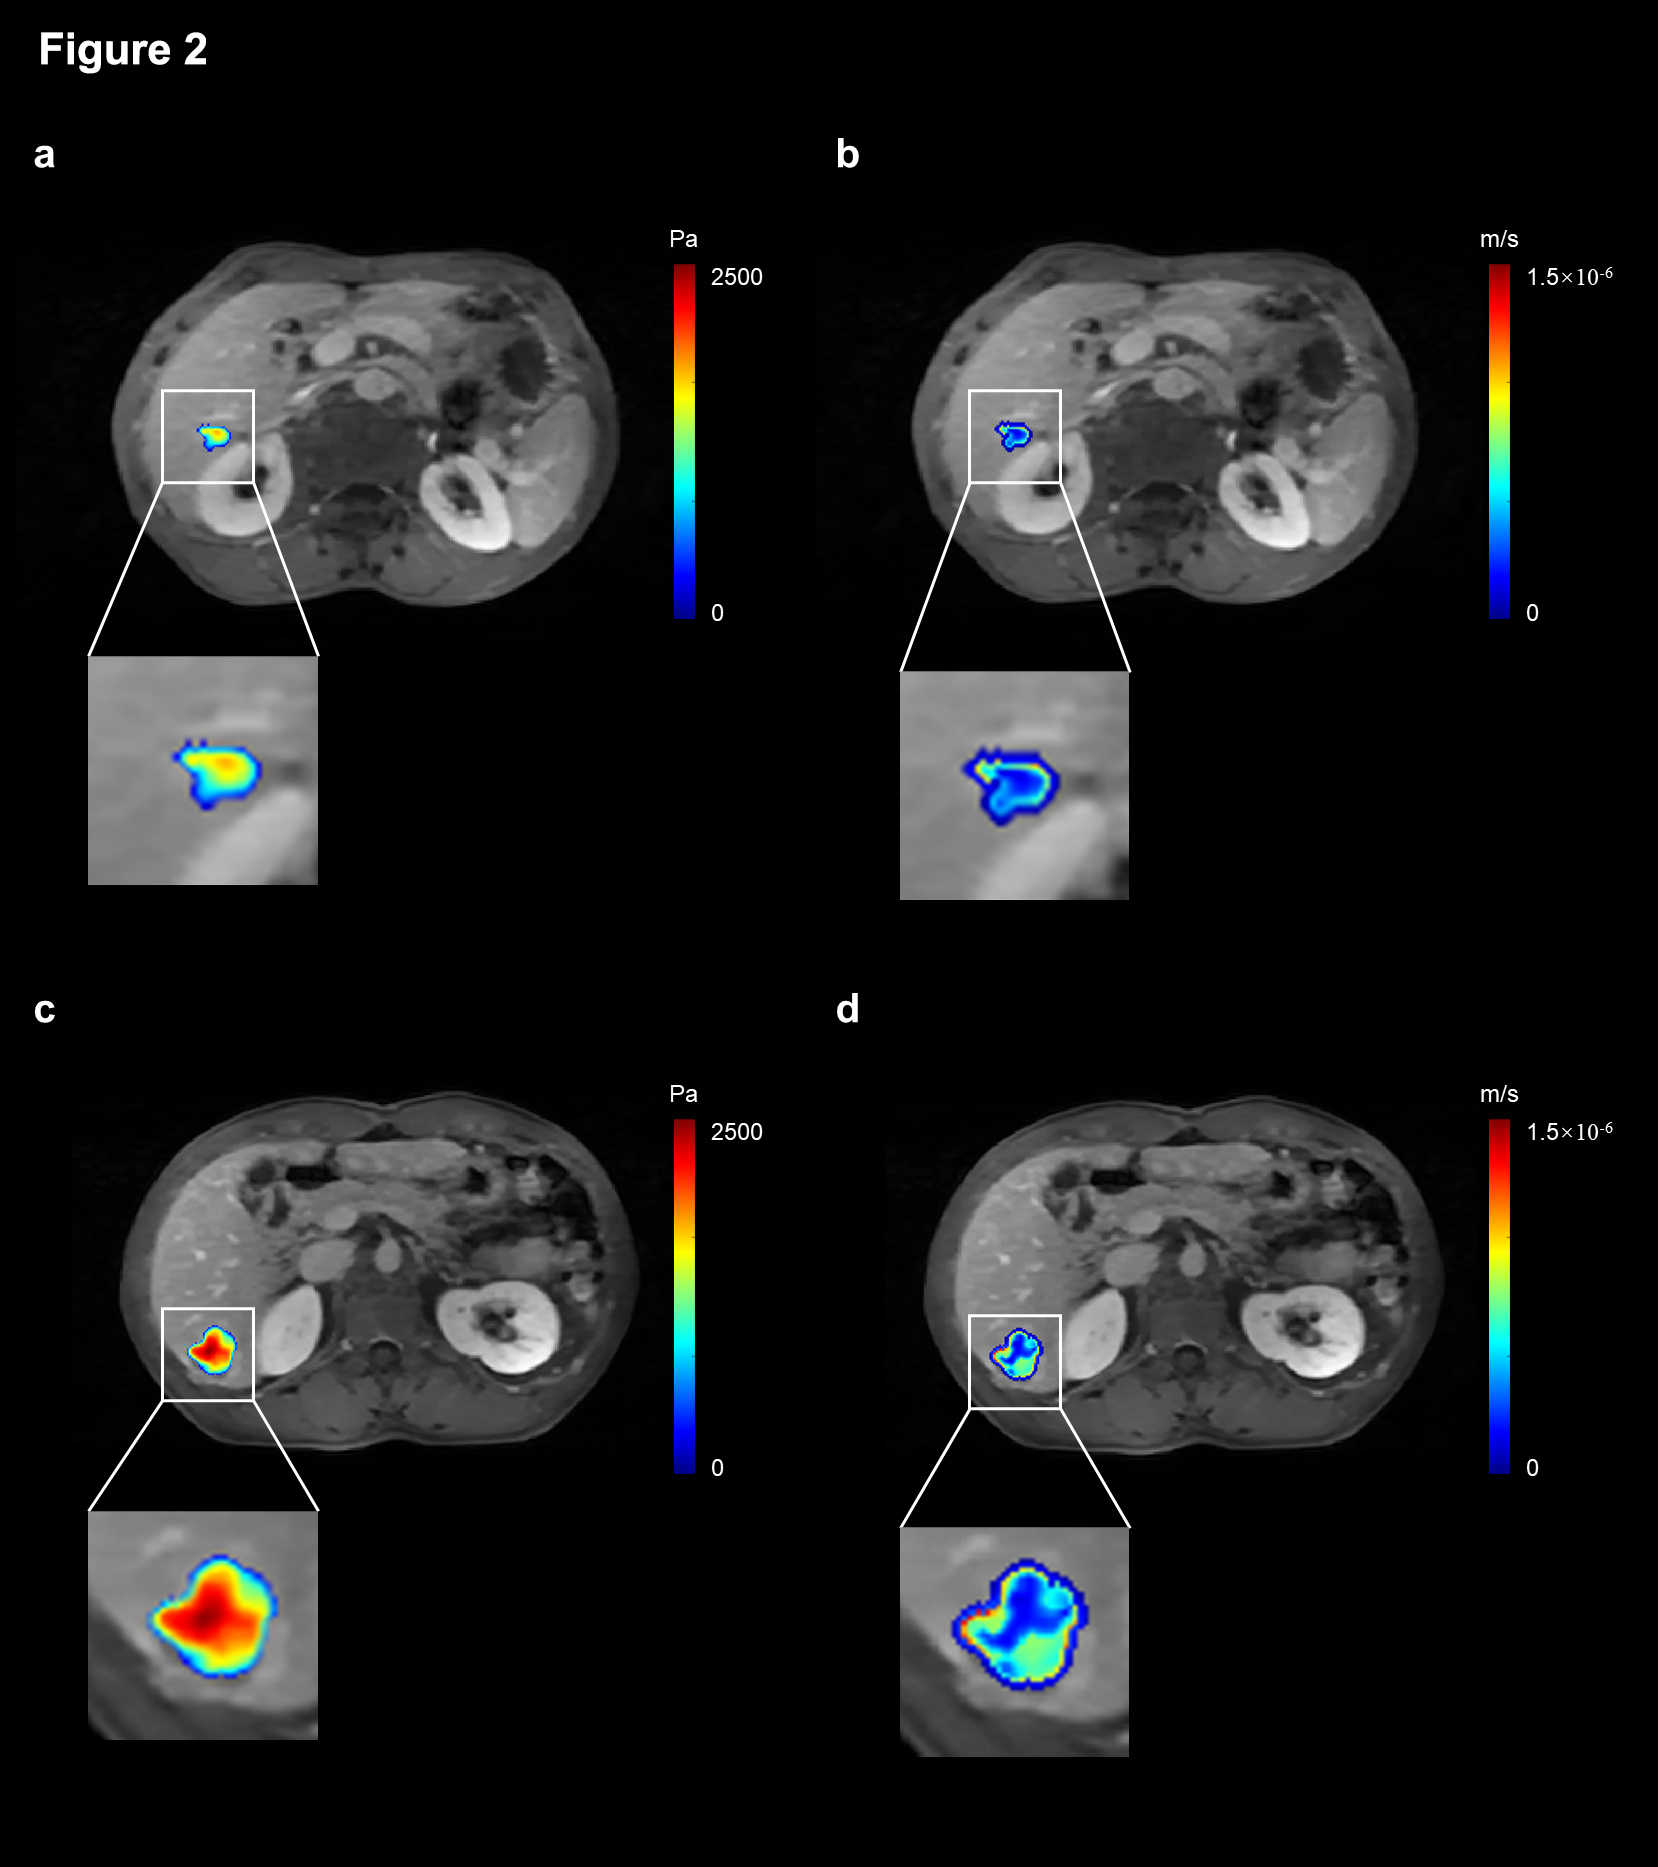
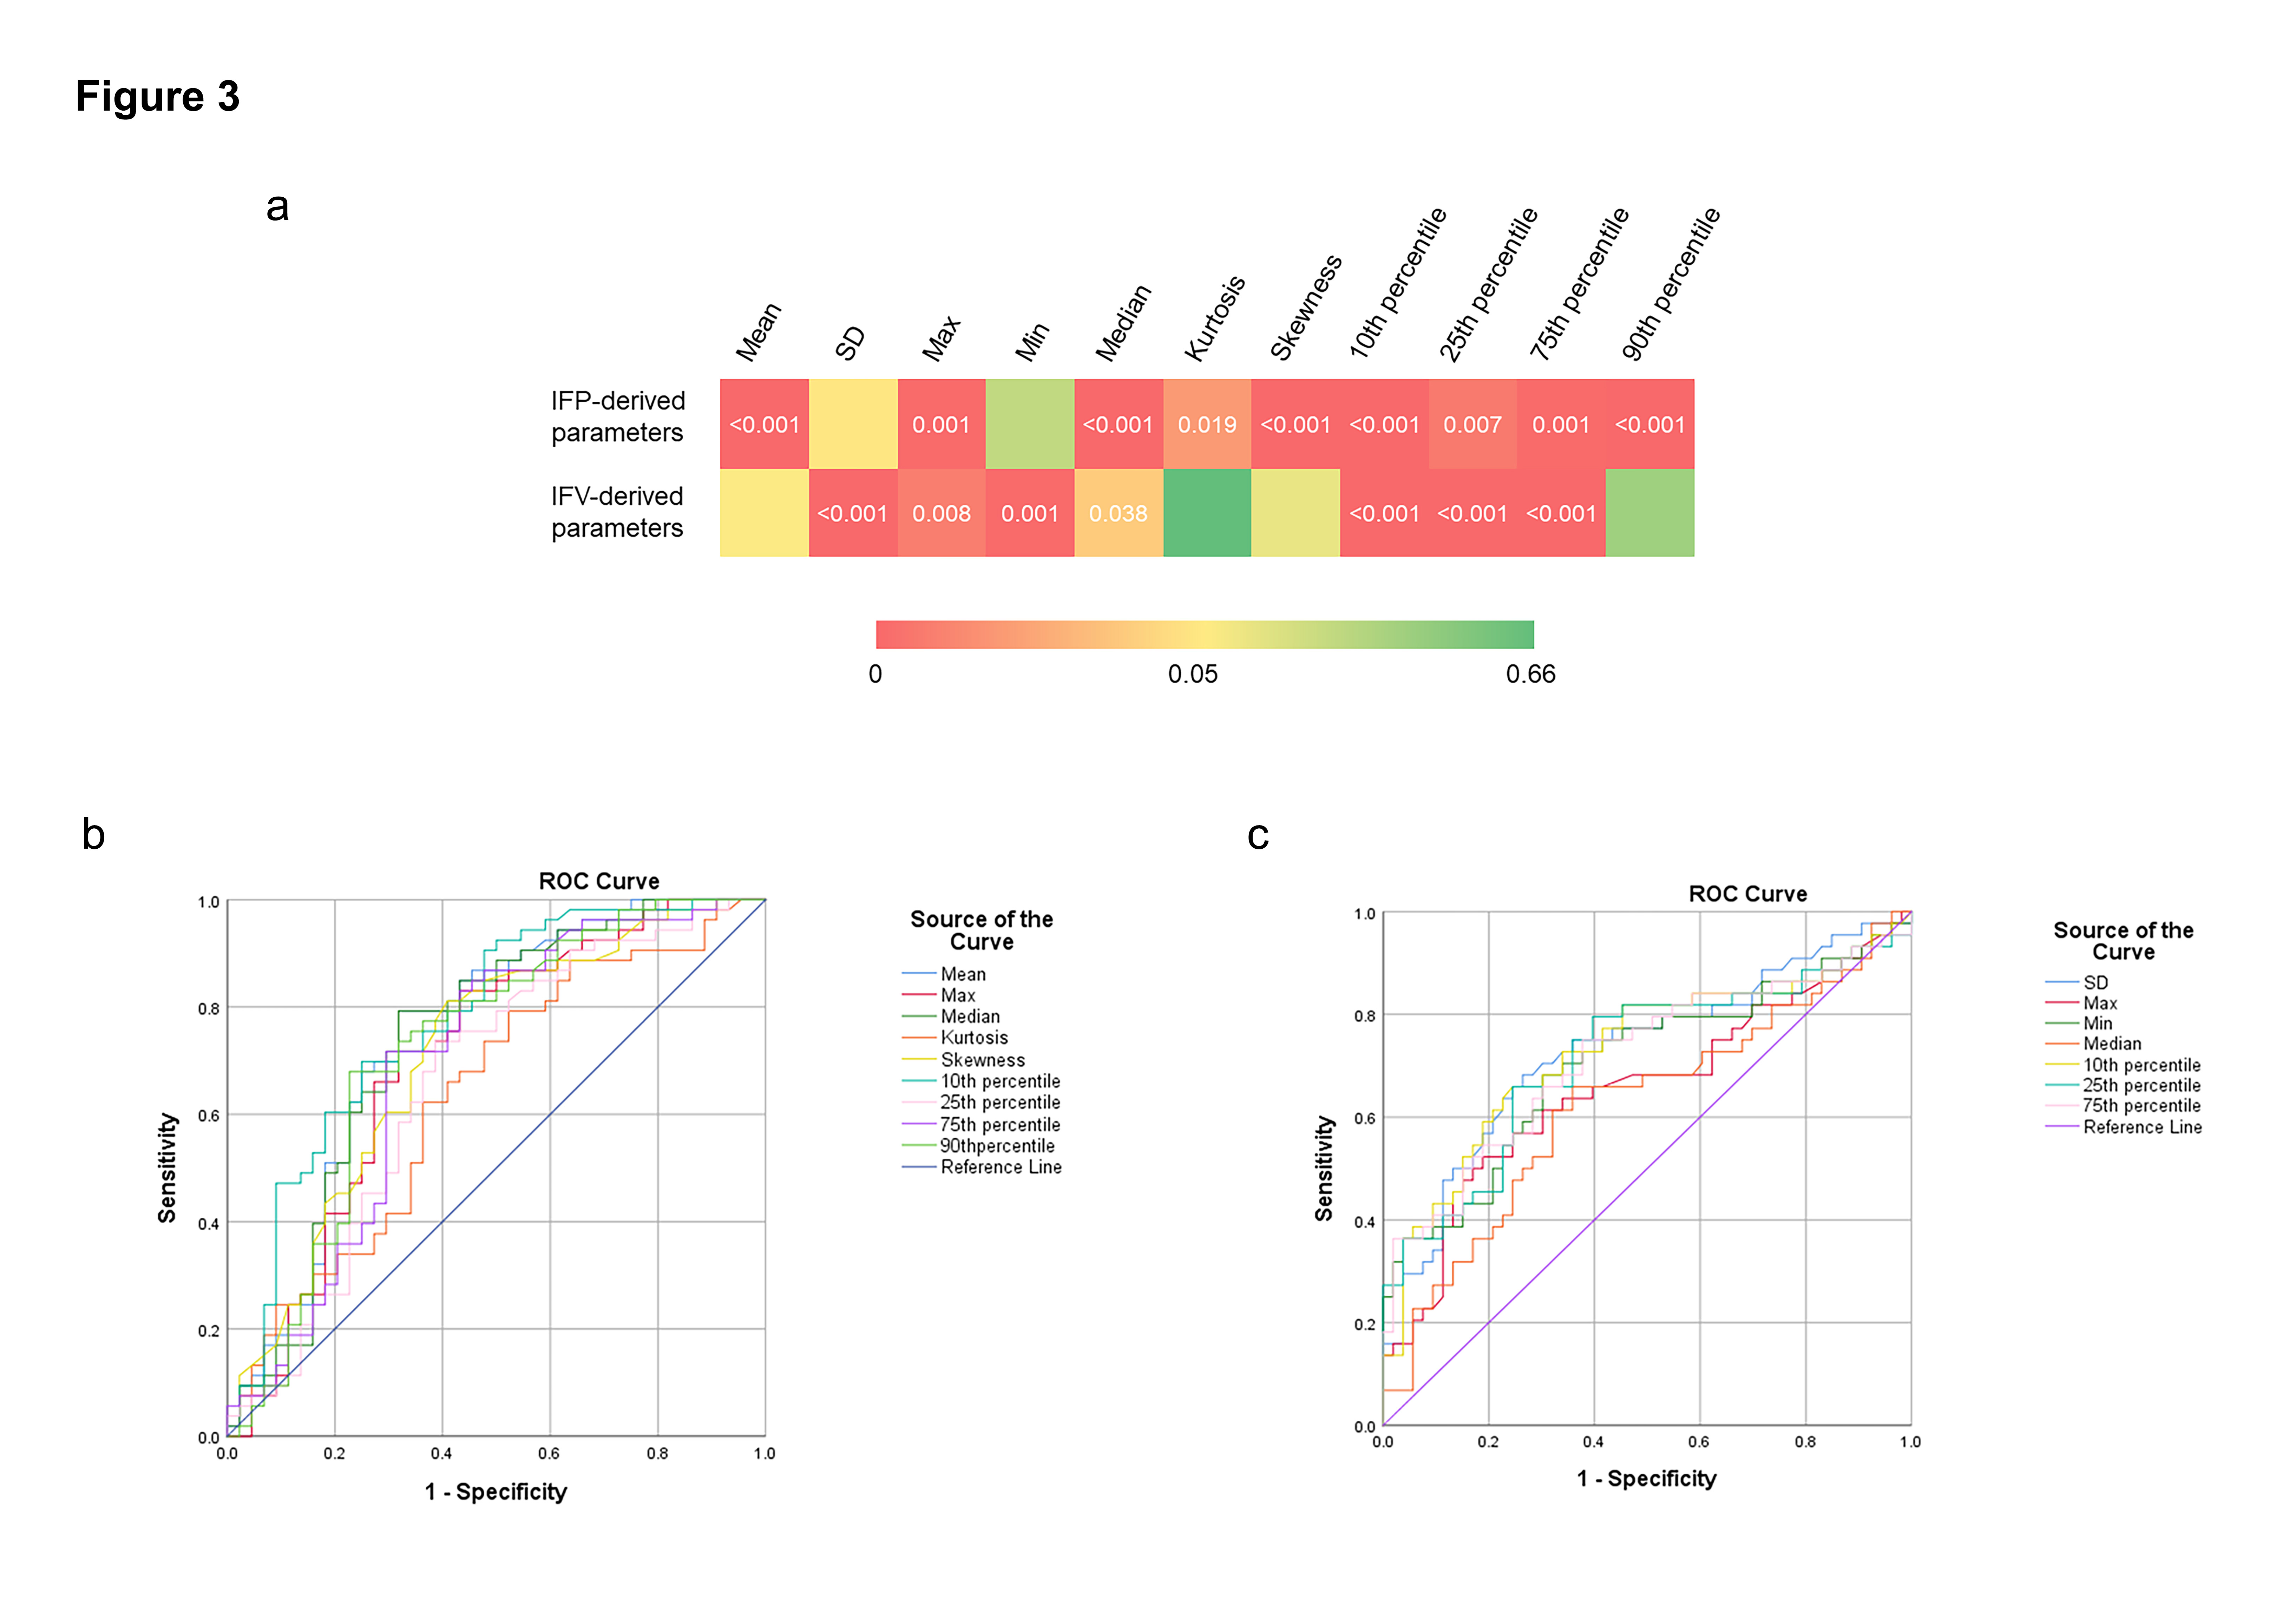
Figure 2 shows the IFP and IFV maps for a 64-year-old patient with MVI-negative HCC and a 49-year-old patient with MVI-positive HCC. The IFP value in MVI-positive tumors was 1.90 ± 0.25 kPa, while the IFP value in MVI-negative tumors was 1.53 ± 0.46 kPa. The IFV value in MVI-positive tumors was 4.66 ± 0.69 ×10⁻⁷ m/s, whereas the IFV value in MVI-negative tumors was 5.00 ± 1.03 ×10⁻⁷ m/s. As shown in Figure 3a, significant differences were found in IFP-derived parameters (including mean, max, median, kurtosis, skewness, and 10th, 25th, 75th, and 90th percentile) between the MVI-positive and -negative groups (P < 0.05). As shown in Figure 3b, among the IFP-derived parameters, the 10th percentile predicted MVI status with the highest AUC (AUC = 0.775, 95% confidence interval 0.662 to 0.858; sensitivity = 69.8%, specificity = 75.0%, accuracy = 72.2%). Skewness had the highest sensitivity (81.1%), but at the cost of having the lowest specificity (59.1%). For the IFV (Figure 3a), the SD, max, min, median, and 10th, 25th, and 75th percentiles all showed a statistically significant difference between the MVI-positive and -negative groups (P < 0.05). As shown in Figure 3c, among IFV-derived parameters, SD predicted MVI status with the highest AUC and accuracy (AUC = 0.729, 95% confidence interval 0.701 to 0.974; sensitivity = 73.6%, specificity = 68.2%, accuracy = 71.2%). Skewness had the highest sensitivity (81.1%), but at the cost of having the lowest specificity (52.3%). In contrast, the 75th percentile had the highest specificity (75.0%), but the lowest sensitivity (62.3%).Discussion/Conclusion
A non-invasive IFP and IFV measurement model for liver tumors was developed. Significant differences were found between the MVI-positive and -negative groups in the IFP- and IFV-derived parameters. IFP- and IFV-derived parameters may be significant predictors of MVI status. This optimal model, together with histogram analysis, offers a new way of probing tumor heterogeneity at the sub-voxel level and has the potential for in vivo assessment of HCC.Acknowledgements
No acknowledgement found.References
1. Yang, C., et al., Microvascular invasion in hepatocellular carcinoma: is it predictable with a new, preoperative application of diffusion-weighted imaging? Clinical imaging, 2017. 41: p. 101-105.
2. Lei, Z., et al., Nomogram for preoperative estimation of microvascular invasion risk in hepatitis B virus–related hepatocellular carcinoma within the milan criteria. JAMA surgery, 2016. 151(4): p. 356-363.
3. Rhee, H., et al., Hepatocellular carcinoma with irregular rim-like arterial phase hyperenhancement: more aggressive pathologic features. Liver cancer, 2019. 8(1): p. 24-40.
4. Ahn, S.Y., et al., Prediction of microvascular invasion of hepatocellular carcinoma using gadoxetic acid-enhanced MR and 18 F-FDG PET/CT. Abdominal imaging, 2015. 40(4): p. 843-851.
5. LoCastro, E., et al., Computational modeling of interstitial fluid pressure and velocity in head and neck cancer based on dynamic contrast-enhanced magnetic resonance imaging: feasibility analysis. Tomography, 2020. 6(2): p. 129-138.
Figures