1216
Reproducibility of M1-optimized Liver DWI Across Field Strengths and Gradient Performance
Timothy J Allen1, Srijyotsna Volety1, Rianne A van der Heijden2, Greg Simchick2, and Diego Hernando1,2
1Medical Physics, University of Wisconsin-Madison, Madison, WI, United States, 2Radiology, University of Wisconsin-Madison, Madison, WI, United States
1Medical Physics, University of Wisconsin-Madison, Madison, WI, United States, 2Radiology, University of Wisconsin-Madison, Madison, WI, United States
Synopsis
Keywords: Liver, Diffusion/other diffusion imaging techniques
Liver DWI using M1-optimized diffusion imaging (MODI) minimizes motion-induced signal dropout while suppressing lesion-mimicking vessel signal. However, early MODI implementations have been confined to 3.0T MR systems with high-performance gradients. The feasibility and reproducibility of MODI DWI on 1.5T systems and systems with conventional gradient performance remains untested. In this work, liver DWI was acquired using conventional and MODI acquisitions in 8 healthy human subjects on 3 separate MR systems with different field strength and gradient performance. ADC estimation with MODI achieved smaller coefficients of variation and reproducibility coefficients across MR systems in comparison to conventional Stejskal–Tanner (monopolar) DWI.Intoduction
DWI of the liver is a useful clinical tool for lesion detection. Further, mapping of quantitative parameters such as the apparent diffusion coefficient (ADC) may enable lesion classification or prediction of therapy response1,2. A major challenge of liver DWI is the sensitivity of diffusion sequences to physiological motion3. Cardiac and respiratory induced liver motion cause signal dropout in DWI and artificially elevate ADC measurements4. This limits the reproducibility of liver DWI and ADC estimation. M1-optimized diffusion imaging (MODI) uses partially motion-compensated diffusion gradients to desensitize liver DWI to motion while preserving suppression of vessel signal which may otherwise mimic liver lesions5. MODI has been previously implemented on a 3.0T MR system with high performance gradients. However, its implementation on conventional gradient systems was delayed due to the longer TEs associated with the weaker gradients. Recent updates to MODI allow for reduced TEs making motion-robust liver DWI on these systems feasible6. Therefore, the purpose of this work is to evaluate the reproducibility of DWI and ADC measured across 3 different MR systems, including 1.5T and 3.0T systems and systems with high-performance and conventional performance gradients.Methods
AcquisitionEight (n=8) healthy human subjects were imaged on three GE Healthcare (Waukesha, Wisconsin) MR systems (Table 1): 3T Signa Premier (scanner 1), 3T Signa PET/MR (scanner 2), and 1.5T Signa Artist (scanner 3). On each scanner, two different DWI acquisitions were performed: 1) a conventional Stejskal–Tanner, “monopolar”, sequence (MONO) and 2) MODI with tetrahedral diffusion directions and M1 = 0.1 s/mm. The tetrahedral encoding was implemented to reduce the TE of MODI. The scan volume covered the whole liver and respiratory triggering was used. Two b-values (50 and 500 s/mm2) were acquired for each sequence (see Table 1 for additional acquisition parameters).
Analysis
A board-certified radiologist delineated one ROI in each of the 9 segments of the liver on the b=50 s/mm2 images7. Average ADC estimates within each ROI were determined. Reproducibility of each sequence was evaluated using the within-subject coefficient of variation (CV). MONO and MODI CV distributions for each ROI were tested for significant difference using Bonferroni-corrected t-tests with a threshold of p < 0.05. Bland-Altman analyses and reproducibility coefficients (RDCs) were used to compare ADC measurements from all ROIs collectively between 1) 1.5T and 3.0T scanners and 2) high (scanner 1) and conventional (scanners 2 and 3) gradient performances.
Results
ADCs across all scanners and subjects for each liver segment are shown in Figure 1. With the MONO acquisition, ADC values in the left lobe of the liver (segments I-IVb) were elevated (mean: $$$1690 \times 10^{-6}$$$ mm2/s) compared to the right lobe (segments V-VIII, mean: $$$1170 \times 10^{-6}$$$ mm2/s). MODI ADC measurements were relatively consistent between the two lobes (left mean: $$$1410 \times 10^{-6}$$$ mm2/s, right mean: $$$1230 \times 10^{-6}$$$ mm2/s).The within-subject CVs distributions for each liver segment can be found in Figure 2. No significant differences between MONO and MODI CVs were found in any segment in the left or right lobes. However, a general trend was observed. CVs in the left lobe tended to be similar between MONO and MODI (mean difference: -1.5%) whereas CVs in the right lobe were consistently lower (mean difference: -5.5%).
Bland-Altman analyses between all ROIs collectively showed that both MONO and MODI had a small mean difference in ADC between field strengths ($$$-18~\times~10^{-6}$$$ vs $$$-16~\times~10^{-6}$$$ mm2/s) (Figure 3), but MODI had smaller RDC ($$$825~\times~10^{-6}$$$ vs $$$579~\times~10^{-6}$$$ mm2/s). Between high and conventional gradient systems, the mean difference was also similar for MONO and MODI ($$$-32~\times~10^{-6}$$$ vs $$$-97~\times~10^{-6}$$$ mm2/s), but MODI again had smaller RDC ($$$819~\times~10^{-6}$$$ vs $$$611~\times~10^{-6}$$$ mm2/s).
Finally, representative ADC maps are shown in Figure 4, which demonstrates the similarity of ADC maps across the three different scanners. In particular, MODI shows resilience to motion-induced elevated ADC in the left liver lobe.
Discussion
This work assessed the feasibility and reproducibility of liver ADC measurements using motion-robust MODI gradient waveforms across systems with different field strength and gradient performance. Within individual ROIs, MODI achieved similar reproducibility in the left lobe and trended toward lower reproducibility in the right lobe. When all ROIs were analyzed collectively, MODI ADC saw superior agreement between field strengths and gradient performance. Moreover, MODI helped to mitigated motion-induced bias in ADC measurements typically seen in the left lobe of the liver. Therefore, MODI could be beneficial for providing reproducible ADC values while reducing motion induced ADC bias.This study has several limitations, including the evaluation of a limited number of healthy volunteers using a single MR vendor, and the lack of comparison to other motion-robust DW waveform designs.
Conclusion
Our results suggest that MODI is feasible on both 1.5T and 3.0T MR systems with conventional gradient performance. Additionally, MODI may provide better reproducibility compared to conventional MONO diffusion. Liver DWI using MODI tended to score better on reproducibility metrics across systems than conventional DWI while also providing better interlobar agreement in ADC measurements of healthy volunteers. MODI may enable motion-robust and reproducible DWI of the liver across field strengths and gradient performance.Acknowledgements
The authors acknowledge support from the NIH (R01 EB030497), from Bracco Diagnostics who provide research support to the University of Wisconsin and from the UW Departments of Radiology, and Medical Physics. Also, GE Healthcare provides research support to the University of Wisconsin-Madison.
References
1. Cui Y, Zhang XP, Sun YS, Tang L, Shen L. Apparent Diffusion Coefficient: Potential Imaging Biomarker for Prediction and Early Detection of Response to Chemotherapy in Hepatic Metastases. Radiology. 2008;248(3):894-900. doi:10.1148/radiol.2483071407
2. Bruegel M, Holzapfel K, Gaa J, et al. Characterization of focal liver lesions by ADC measurements using a respiratory triggered diffusion-weighted single-shot echo-planar MR imaging technique. Eur Radiol. 2008;18(3):477-485. doi:10.1007/s00330-007-0785-9
3. Taouli B, Koh DM. Diffusion-weighted MR imaging of the liver. Radiology. 2010;254(1):47-66. doi:10.1148/radiol.09090021
4. Ozaki M, Inoue Y, Miyati T, et al. Motion artifact reduction of diffusion-weighted MRI of the liver: Use of velocity-compensated diffusion gradients combined with tetrahedral gradients. Journal of Magnetic Resonance Imaging. 2013;37(1):172-178. doi:10.1002/jmri.23796
5. Zhang Y, Peña-Nogales Ó, Holmes JH, Hernando D. Motion-robust and blood-suppressed M1-optimized diffusion MR imaging of the liver. Magn Reson Med. 2019;82(1):302-311. doi:10.1002/mrm.27735
6. Allen TJ, Simchick G, Hernando D, Volety S. M1-optimized Liver DWI using Tetrahedral Diffusion Gradients on Conventional Gradient Systems . In: Annual Meeting of the ISMRM. 2023. [Submitted]
7. Campo CA, Hernando D, Schubert T, Bookwalter CA, Pay AJ van, Reeder SB. Standardized Approach for ROI-Based Measurements of Proton Density Fat Fraction and R2* in the Liver. American Journal of Roentgenology. 2017;209(3):592-603. doi:10.2214/AJR.17.17812
Figures
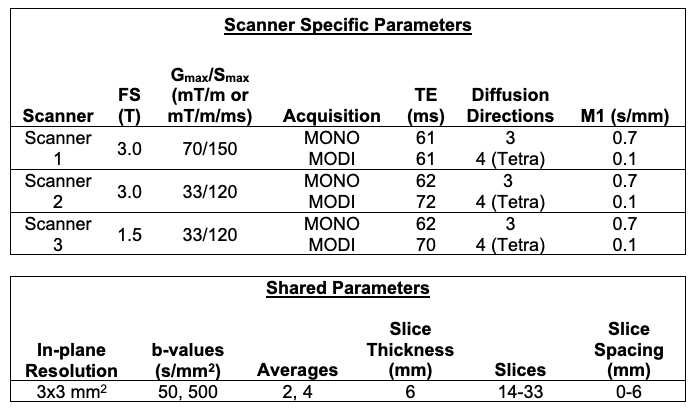
Table 1: Summary of scanners and relevant parameters. FS: Field Strength, Gmax: Maximum gradient amplitude, Smax: Maximum slew rate, NEX: Number of acquisitions per diffusion direction, Tetra: Tetrahedral diffusion encoding, slice spacing was adjusted to achieve full liver coverage.
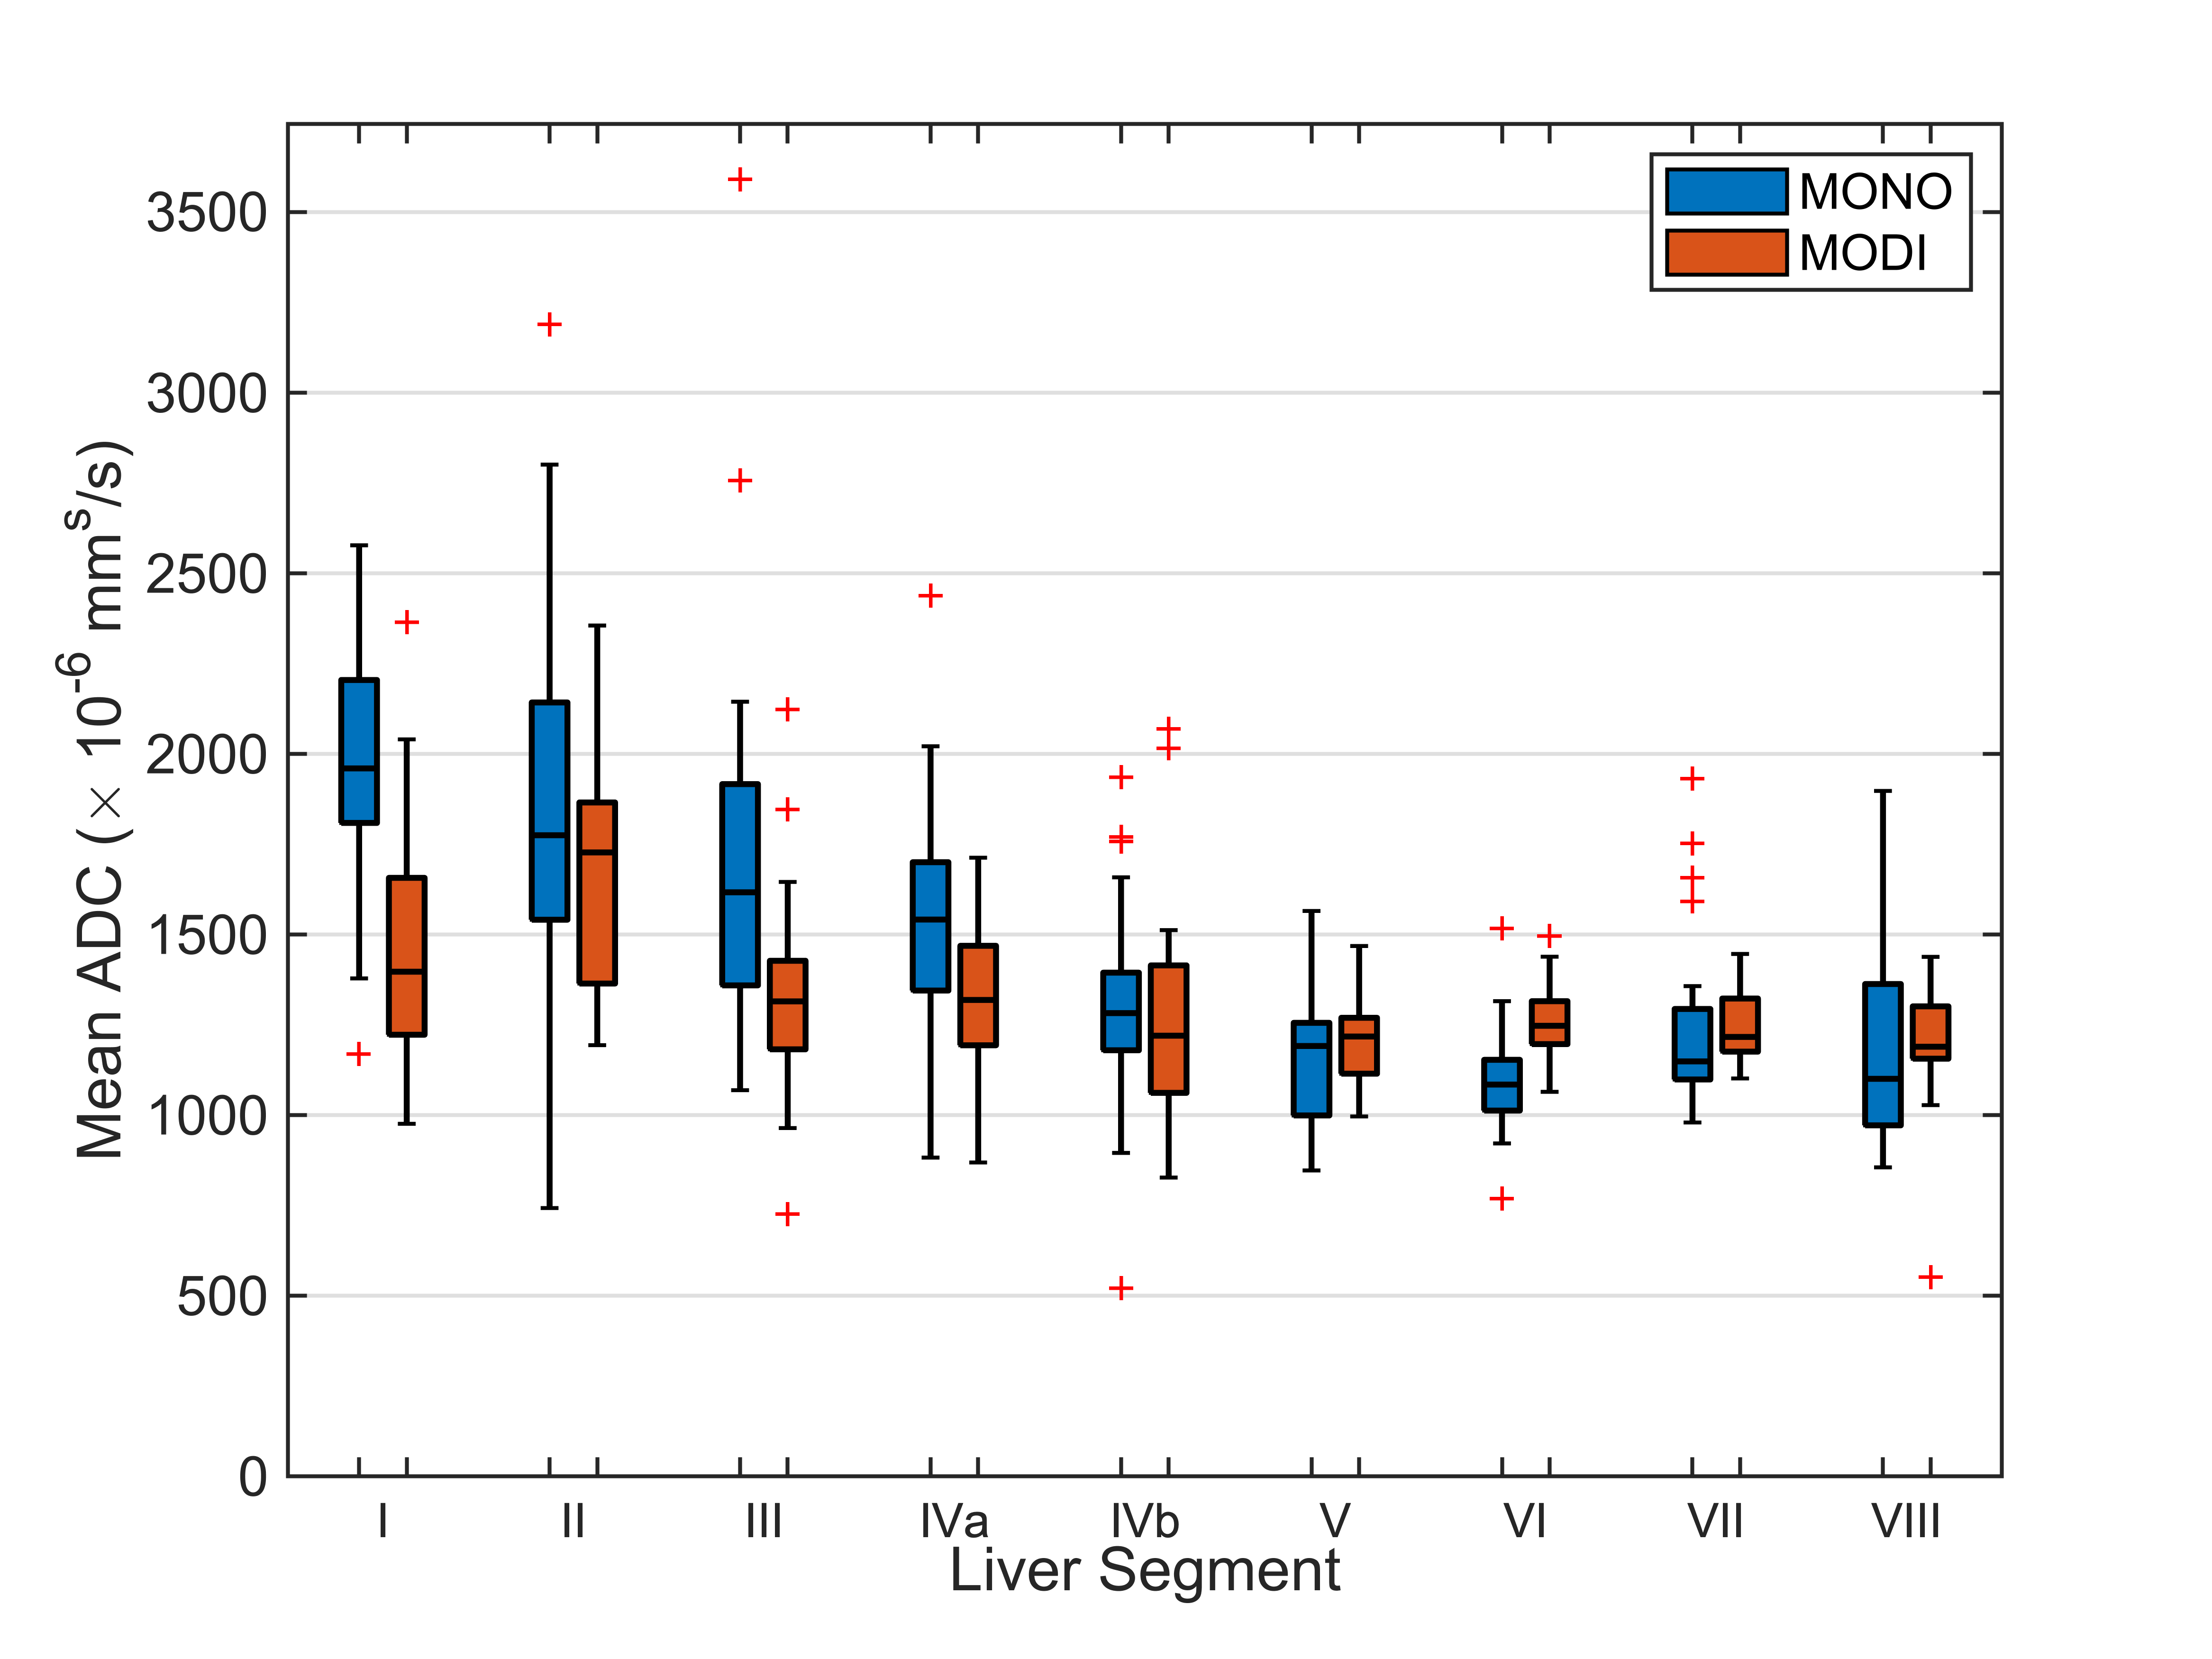
Figure 1: Conventional Stejskal–Tanner (MONO) diffusion waveforms led to elevated ADC values in the left lobe of the liver (segments I – IVb). MODI diffusion waveforms provided a motion-robust ADC measurement with more consistent values across the liver. Shown are measured ADC values from all scanners and subjects for ROIs placed in each of the 9 liver segments .
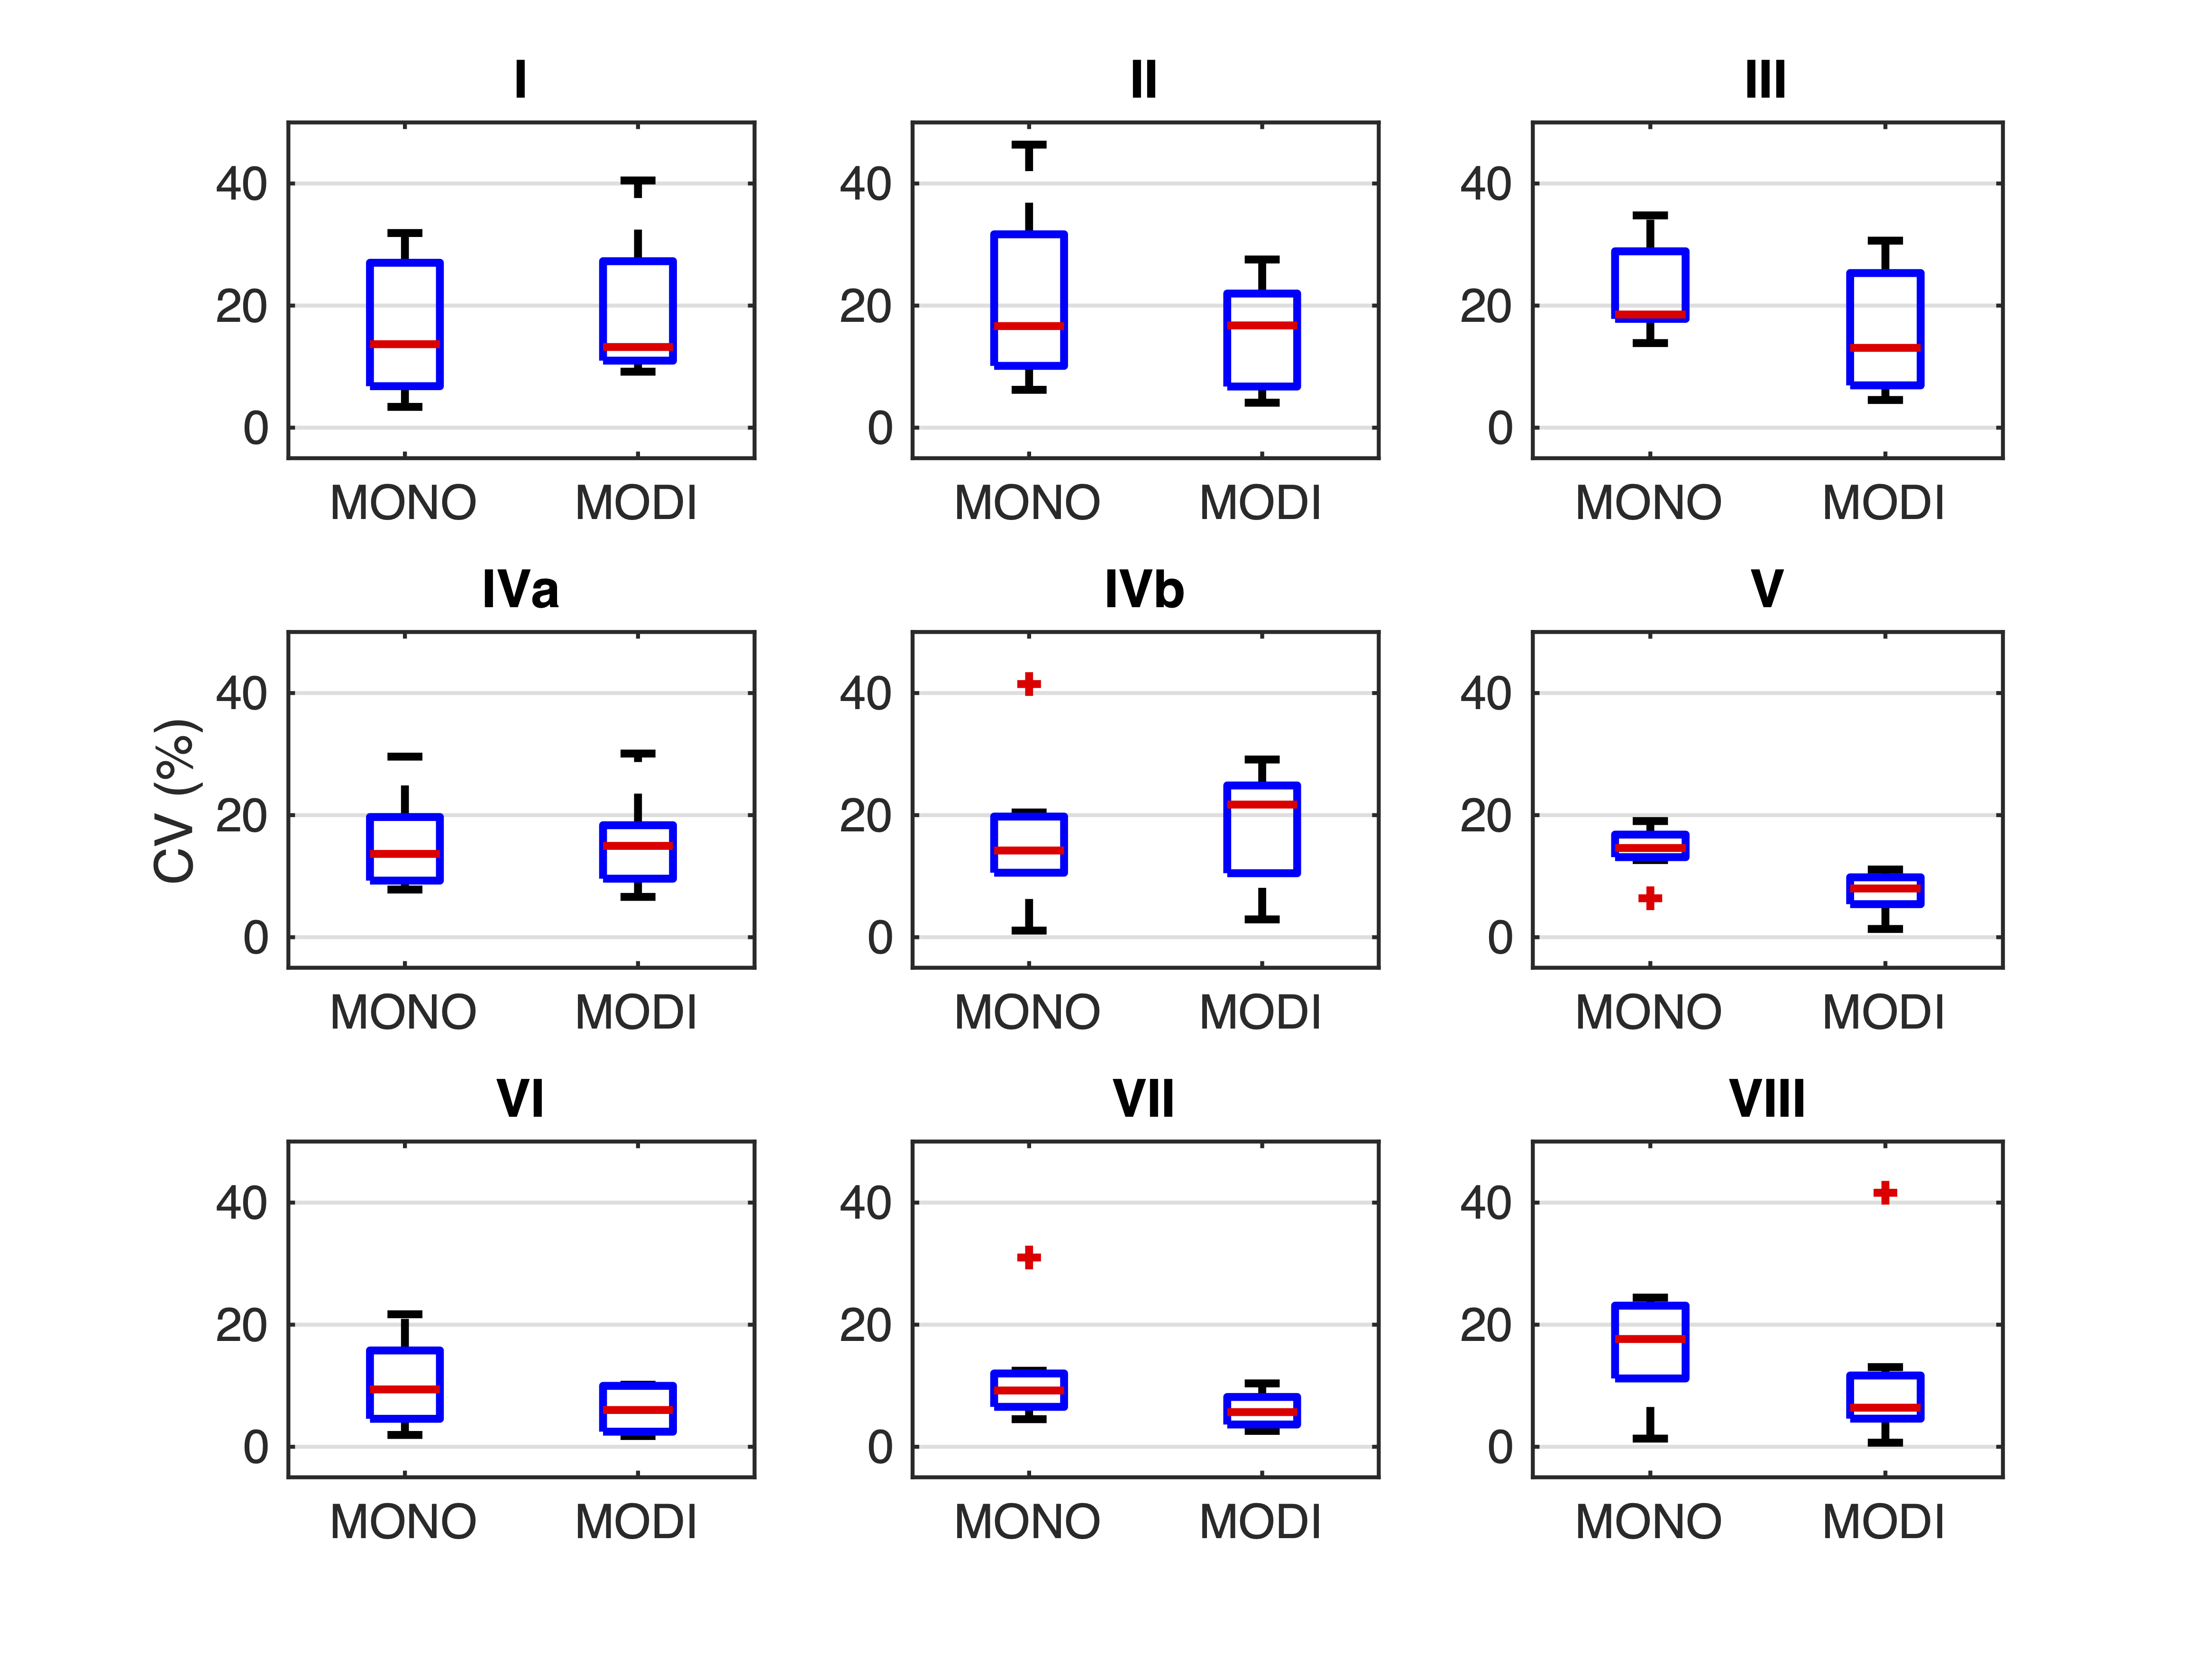
Figure 2: The within-subject coefficients of variation (CV) for ADC measurements were similar between MODI and MONO diffusion sequence for each liver segment in the left liver lobe (segments I-IVb). MODI-derived CVs in the right liver lobe (segments V-VIII) tended to be smaller than MONO-derived CVs. Shown are the CV distributions over all subjects for each liver segment. Statistical t-tests with Bonferroni correction showed no significant difference between the CVs in any of the liver segments.
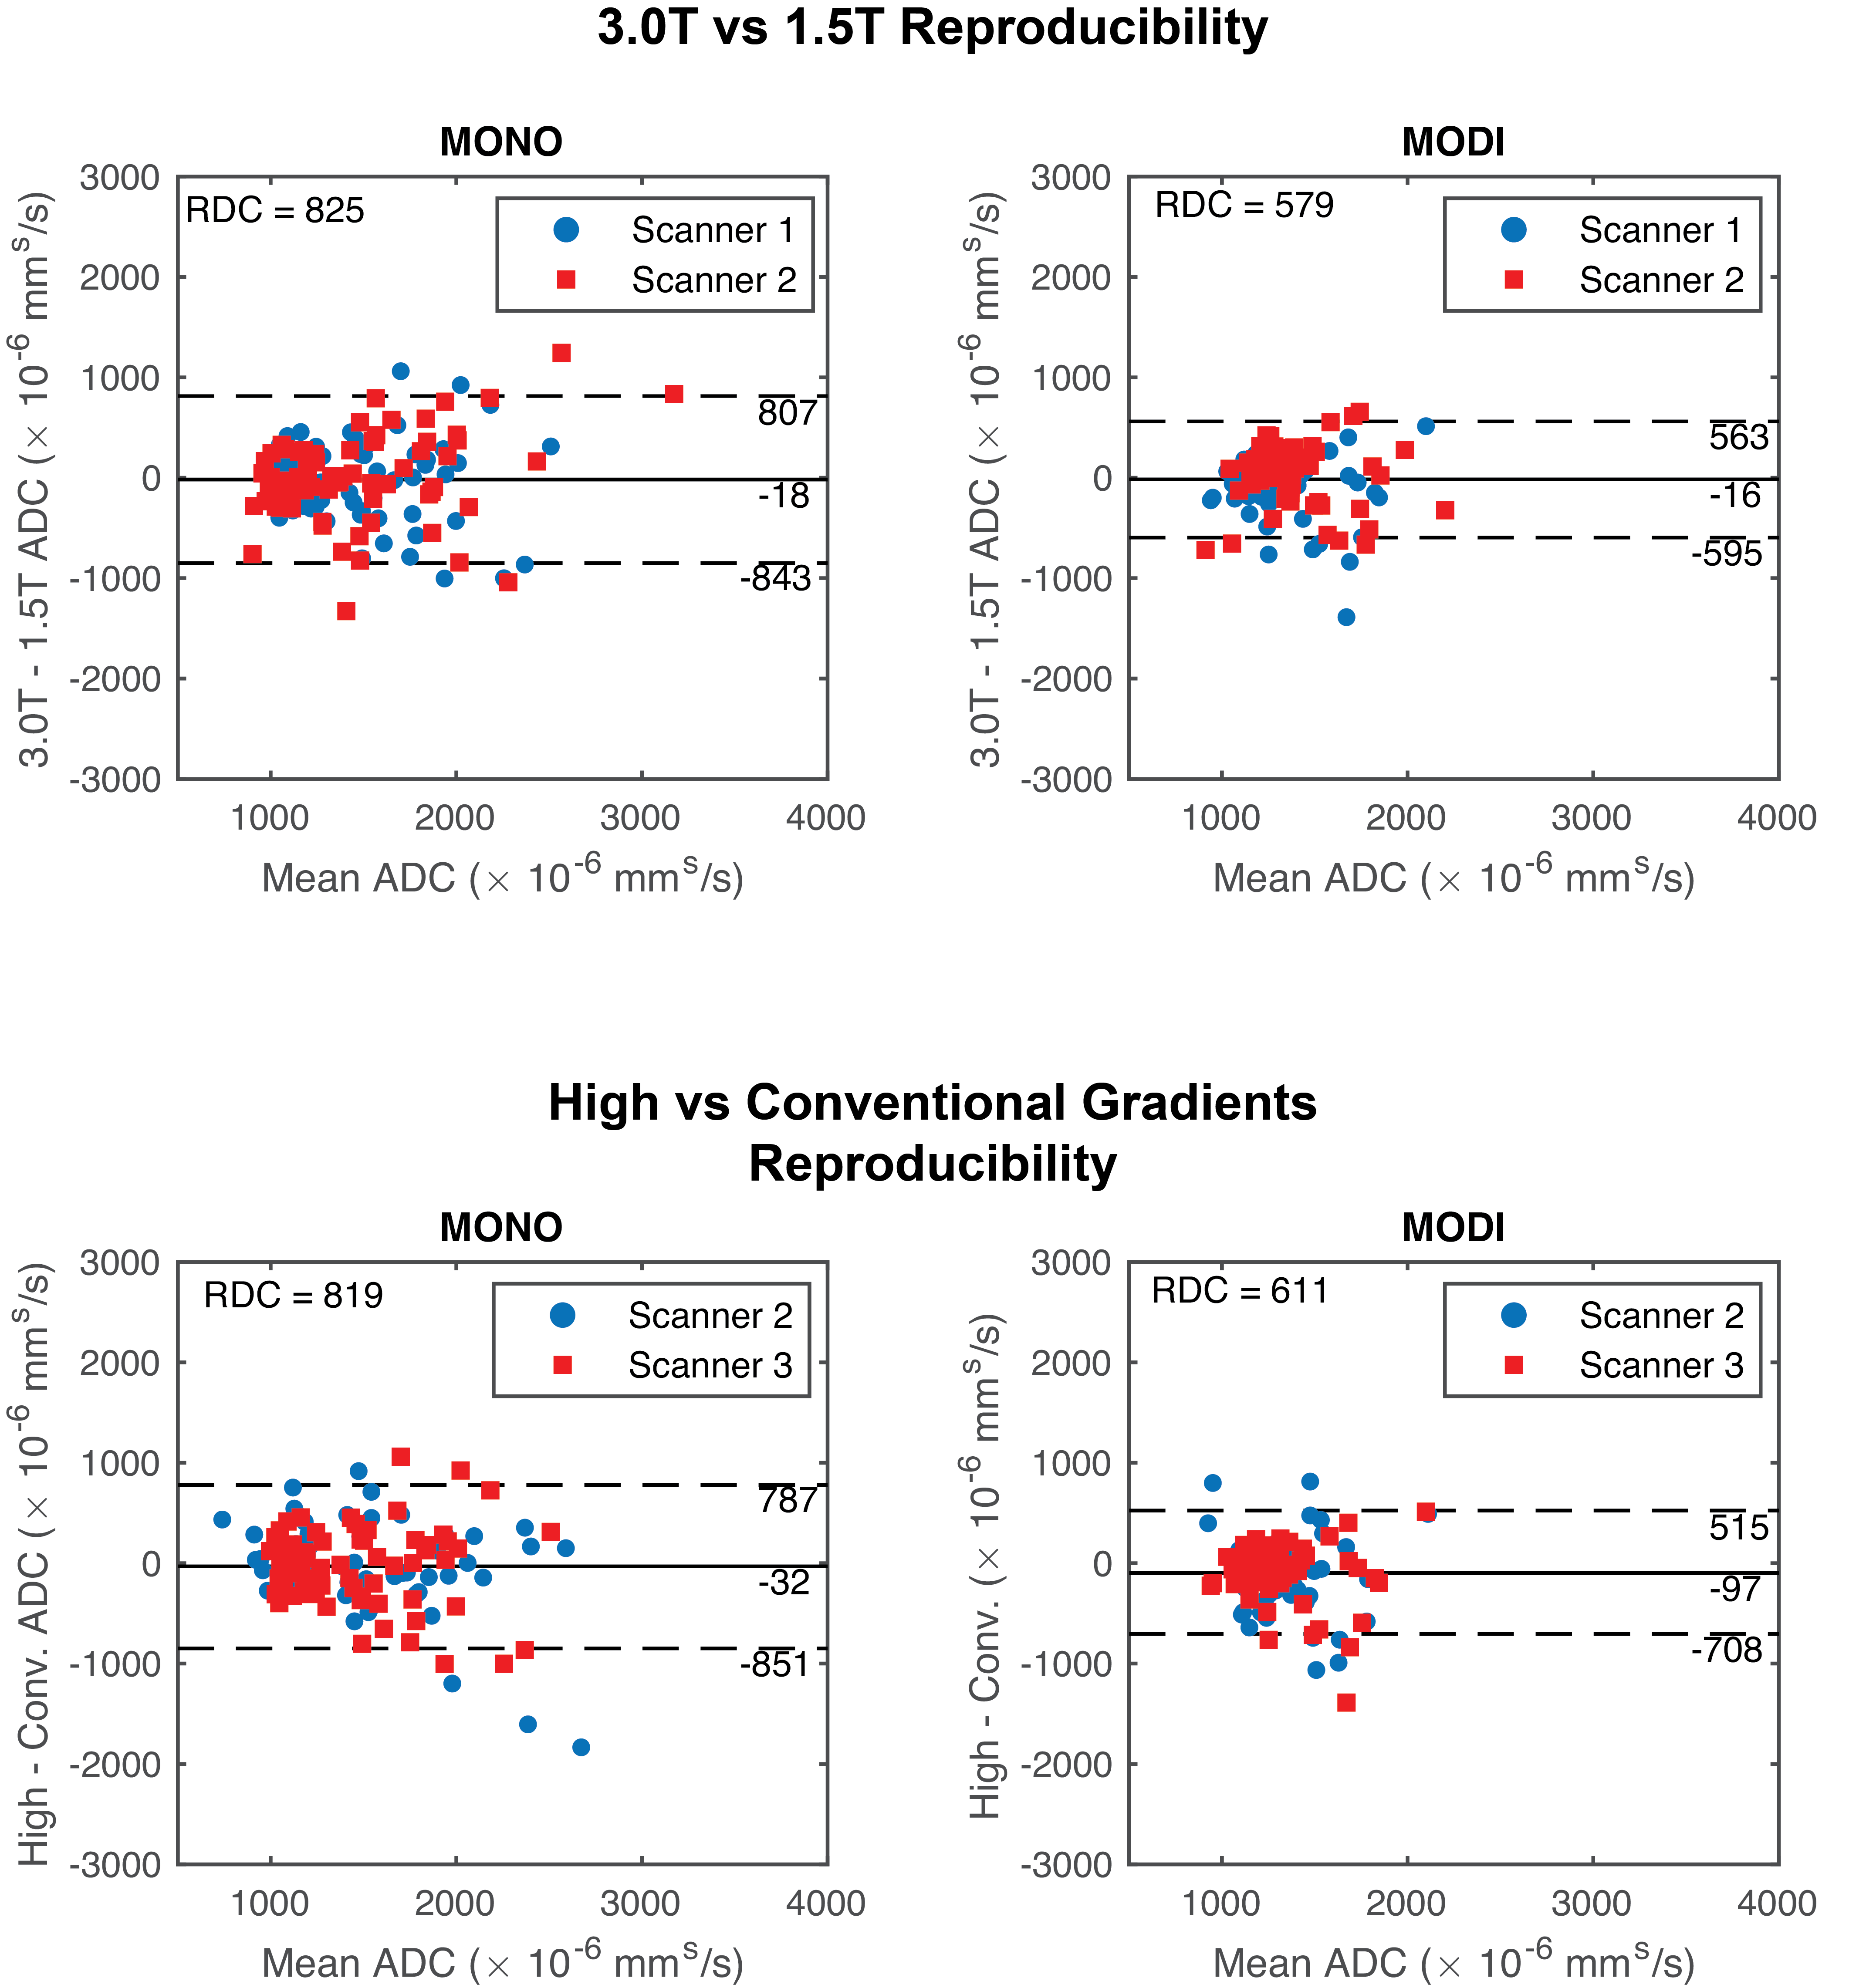
Figure 3: Bland-Altman analysis showed that MODI had a better reproducibility coefficient (RDC) between field strengths (top row) and gradient performances (bottom row). In the Bland-Altman plots, each point represents a different liver segment and volunteer combination. Mean difference (solid black lines) and mean difference ± RDC (dashed black lines) are shown. The different colors show one of the two scanners compared to the third scanner with the different field strength or gradient performance.
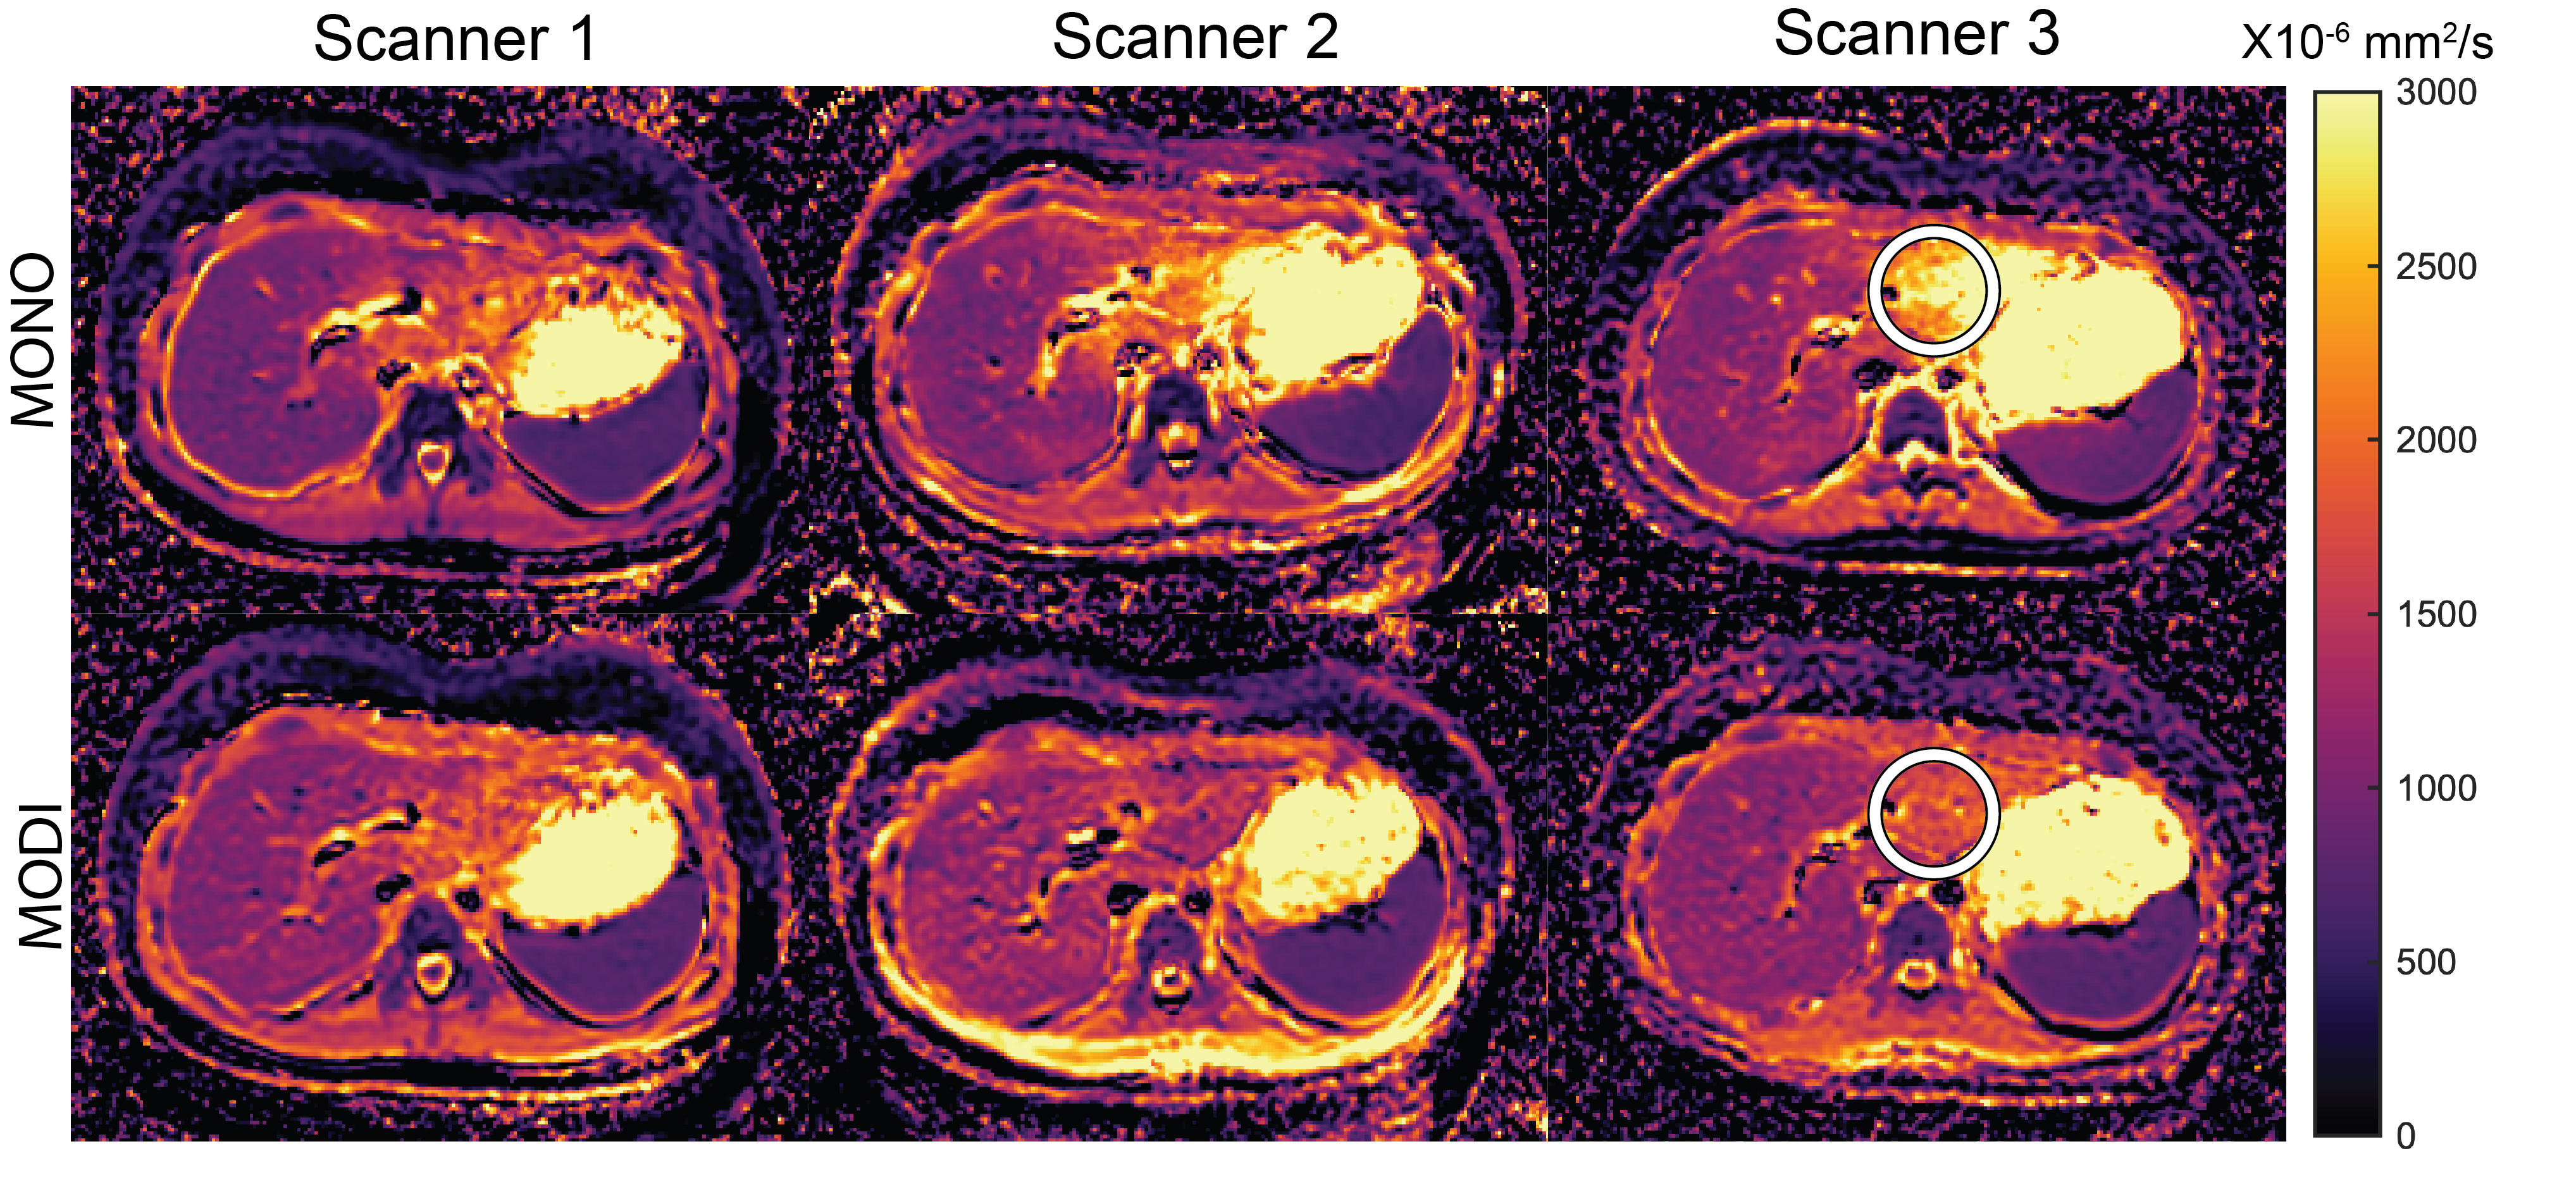
Figure 4: ADC maps generated using MONO and MODI sequences on the three different scanners demonstrated strong inter-scanner similarity. The white circle highlights the left lobe of the liver in which MONO produced elevated ADC values due to respiratory and cardiac-induced motion. MODI sequence provided an ADC in this region which more closely matches the rest of the liver.
DOI: https://doi.org/10.58530/2023/1216