1215
Dynamic glucose-enhanced imaging of the liver using breath-hold black blood quantitative T1rho MRI
Yurui Qian1, Vincent Wai-Sun Wong2, Jian Hou1, Baiyan Jiang1,3, Xinrong Zhang2, Grace Lai-Hung Wong2, Zhigang Wu4, Queenie Chan5, Simon Chun Ho Yu1, Winnie Chiu-Wing Chu1, and Weitian Chen1
1Imaging and Interventional Radiology, The Chinese University of Hong Kong, Hong Kong, Hong Kong, 2Medical Data Analytics Centre (MDAC), Department of Medicine & Therapeutics, The Chinese University of Hong Kong, Hong Kong, Hong Kong, 3Illuminatio Medical Technology Limited, Hong Kong, Hong Kong, 4Philips Healthcare, Shenzhen, China, 5Philips Healthcare, Hong Kong, Hong Kong
1Imaging and Interventional Radiology, The Chinese University of Hong Kong, Hong Kong, Hong Kong, 2Medical Data Analytics Centre (MDAC), Department of Medicine & Therapeutics, The Chinese University of Hong Kong, Hong Kong, Hong Kong, 3Illuminatio Medical Technology Limited, Hong Kong, Hong Kong, 4Philips Healthcare, Shenzhen, China, 5Philips Healthcare, Hong Kong, Hong Kong
Synopsis
Keywords: Liver, Liver
Non-alcoholic fatty liver disease (NAFLD) is often associated with abnormal metabolic syndrome. In this study, we investigated dynamic glucose enhanced imaging of the liver using T1rho MRI after glucose ingestion. We hypothesize this approach can be used to assess metabolic activities in the liver. Sixteen young volunteers and four patients with NAFLD were recruited in this study. The preliminary results suggest that the proposed approach has the potential to detect metabolic variations between normal subjects and subjects with fatty liver.Introduction
Dynamic glucose-enhanced (DGE) imaging of the liver after the intake of glucose can be used to detect the metabolic changes in the liver. Such a technique has significant potential in the assessment of liver diseases. The 18F fluorodeoxyglucose (FDG)-PET imaging (1-2) and 13C-labeled glucose MRS (3) have been reported for DGE imaging to measure the glucose metabolism in the liver. The FDG-PET imaging results show potential in detecting NASH (1-2). However, these methods require extra hardware or specially labeled glucose which brings radiation risks to subjects. Chemical Exchange Saturation Transfer (CEST) and Chemical Exchange Spin-Lock (CESL) techniques have been developed for DGE imaging (4-5). However, the application of these methods in the liver has not been reported in previous studies. In this work, we report DGE imaging using a breath-hold black blood T1rho mapping technique (6) and show preliminary results on healthy young volunteers and patients with NAFLD.Method
The workflow designed for this study is illustrated in Figure 1. All subjects were asked to fast overnight before the MRI exam. Two repeated baseline T1rho scan were performed at the beginning of the MRI exam. After that, subjects drank natural D-glucose (75g, 30% solution, DEXTROSOL, Germany) with a straw and without moving the scan position. Multiple T1rho scans were followed and lasted for about 50 minutes. A total of 20 subjects were recruited in this study, including four patients with NAFLD confirmed by biopsy (age: 53.3±10.6 years, BMI: 24.3±2.6 kg/m2, three male) and 16 young volunteers (age: 26.4±2.8 years, BMI: 22.5±4.3 kg/m2, eight male). Three patients (2 male and 1 female) were confirmed with NASH by liver biopsy.This study was conducted under the approval of the institutional review board. All scans were conducted using a 3.0T MRI scanner (Philips Achieva TX, Philips Healthcare, Best, Netherlands). A 32-channel cardiac coil (Invivo Corp, Gainesville, USA) was used as the receiver and the body coil was used as the RF transmitter. The detail of black-blood T1rho imaging pulse sequence was described in our previous study (6). The T1rho imaging parameters include: resolution 2×2 mm, slice thickness 7 mm, time of spin-lock (TSL) 0, 30, 50 ms, frequency of spin-lock (FSL) 400 Hz, TE/TR 17/2000 ms. Spectral Attenuated Inversion Recovery (SPAIR) and Double inversion recovery (DIR) were applied to suppress the fat and blood signal, respectively. Two coronal slices were acquired in each T1rho scan. At the beginning of exam, an mDIXON QuantTM (Philips Healthcare) scan was performed to measure liver fat fraction. We measured the difference between the peak R1rho and the baseline R1rho before glucose ingestion, denoted as ∆R1rho and use its mean from the ROIs within the right lobe of the liver for analysis. The statistical difference between two groups was tested by one-way ANOVA. A p-value < 0.05 is considered statistically significant.
Results
Liver R1rho value increases after glucose ingestion among most young volunteers. The increase of liver R1rho is significantly reduced among most patients and volunteers with fatty liver. Figure 2 shows examples of dynamic R1rho changes from a healthy volunteer without fatty liver (fat fraction < 5%) and a biopsy-confirmed NASH patient, respectively. Figure 3 compared ∆R1rho between the two groups with or without fatty liver, and the two groups with or without biopsy-confirmed NASH, respectively. The fatty liver is based on the fat fraction measured using mDixon Quant.Discussion and Conclusion
In this preliminary study, the dynamic change of glucose-enhanced liver R1rho was different between healthy volunteers and subjects with fatty liver. We observed such a difference is more significant in the male subjects than the female subjects.The preliminary result is consistent with the results previously reported using PET imaging (2). Our study shows dynamic glucose-enhanced liver R1rho has the potential to reflect the metabolism difference between healthy and subjects with fatty liver diseases.
In our protocol, the subjects drink natural glucose with the dosage same as that used in standard clinical glucose tolerance test (75g). Our studies show our approach is capable to detect the DGE signal with this dosage. In addition, we used blood suppression technique when measuring T1rho in the liver (6). This is expected to reduce the confounding effect from the glucose level changes in the blood when measuring metabolism of the liver.
One limitation of this study is small sample size. The influence of gender and age on R1rho dynamic changes requires further investigation. Further larger cohort studies are required to investigate the robustness and sensitivity of this method.
Acknowledgements
This study was supported by a grant from the Innovation and Technology Commission of the Hong Kong SAR (Project MRP/046/20X).References
- Sarkar S, Matsukuma KE, Spencer B, Chen S, Olson KA, Badawi RD, Corwin MT, Wang G. Dynamic Positron Emission Tomography/Computed Tomography Imaging Correlate of Nonalcoholic Steatohepatitis. Clin Gastroenterol Hepatol. 2021;19(11):2441–3.
- Sarkar S, Corwin MT, Olson KA, Stewart SL, Liu CH, Badawi RD, Wang G. Pilot study to diagnose nonalcoholic steatohepatitis with dynamic 18 F-FDG PET. Am J Roentgenol. 2019 Mar 1;212(3):529–37.
- Stender S, Zaha VG, Malloy CR, Sudderth J, DeBerardinis RJ, Park JM. Assessment of Rapid Hepatic Glycogen Synthesis in Humans Using Dynamic 13C Magnetic Resonance Spectroscopy. Hepatol Commun. 2020 Mar 1;4(3):425–33.
- Chan KWY, McMahon MT, Kato Y, Liu G, Bulte JWM, Bhujwalla ZM, Artemov D, Van Zijl PCM. Natural D-glucose as a biodegradable MRI contrast agent for detecting cancer. Magn Reson Med. 2012 Dec 1; 68(6):1764–73.
- Jin T, Mehrens H, Hendrich KS, Kim S-G. Mapping brain glucose uptake with chemical exchange-sensitive spin-lock magnetic resonance imaging. J Cereb Blood Flow Metab. 2014;34:1402–10.
- Chen W, Chan Q, Wáng Y-XJ. Breath-hold black blood quantitative T1rho imaging of liver using single shot fast spin echo acquisition. Quant Imaging Med Surg. 2016 Apr;6(2):168–77.
Figures
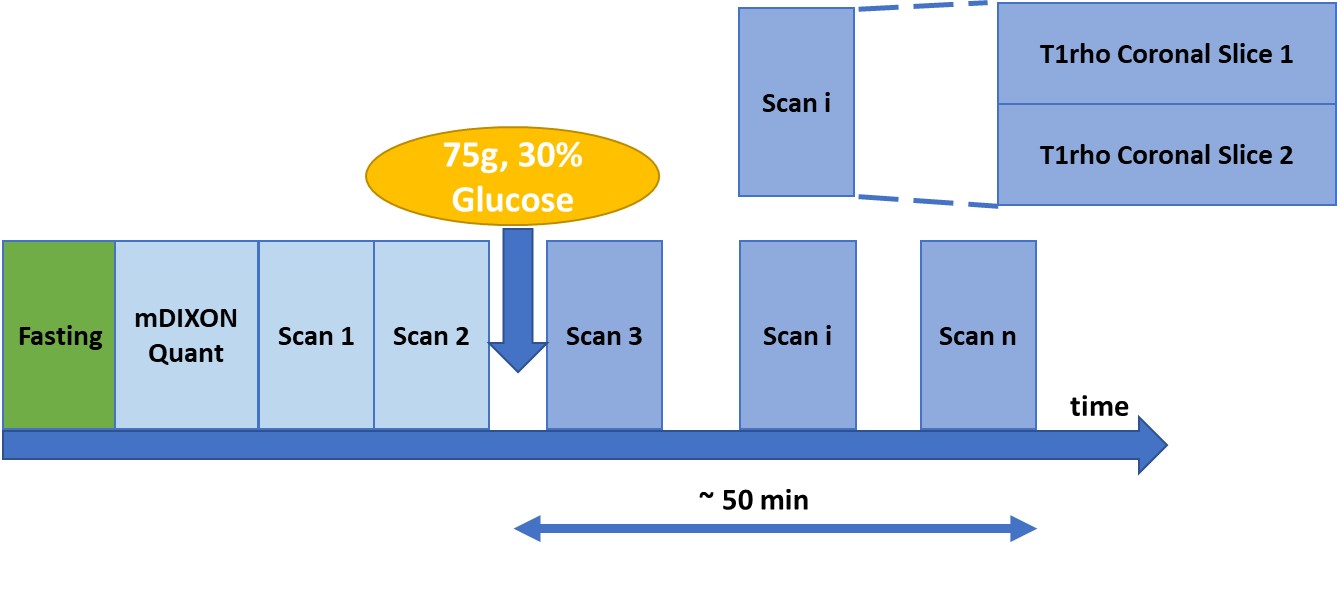
Figure 1. MRI scan workflow. Two baseline T1rho scans are
performed before glucose ingestion. Repeated T1rho scans are performed
afterwards. At each temporal point, two slices of T1rho map are acquired.
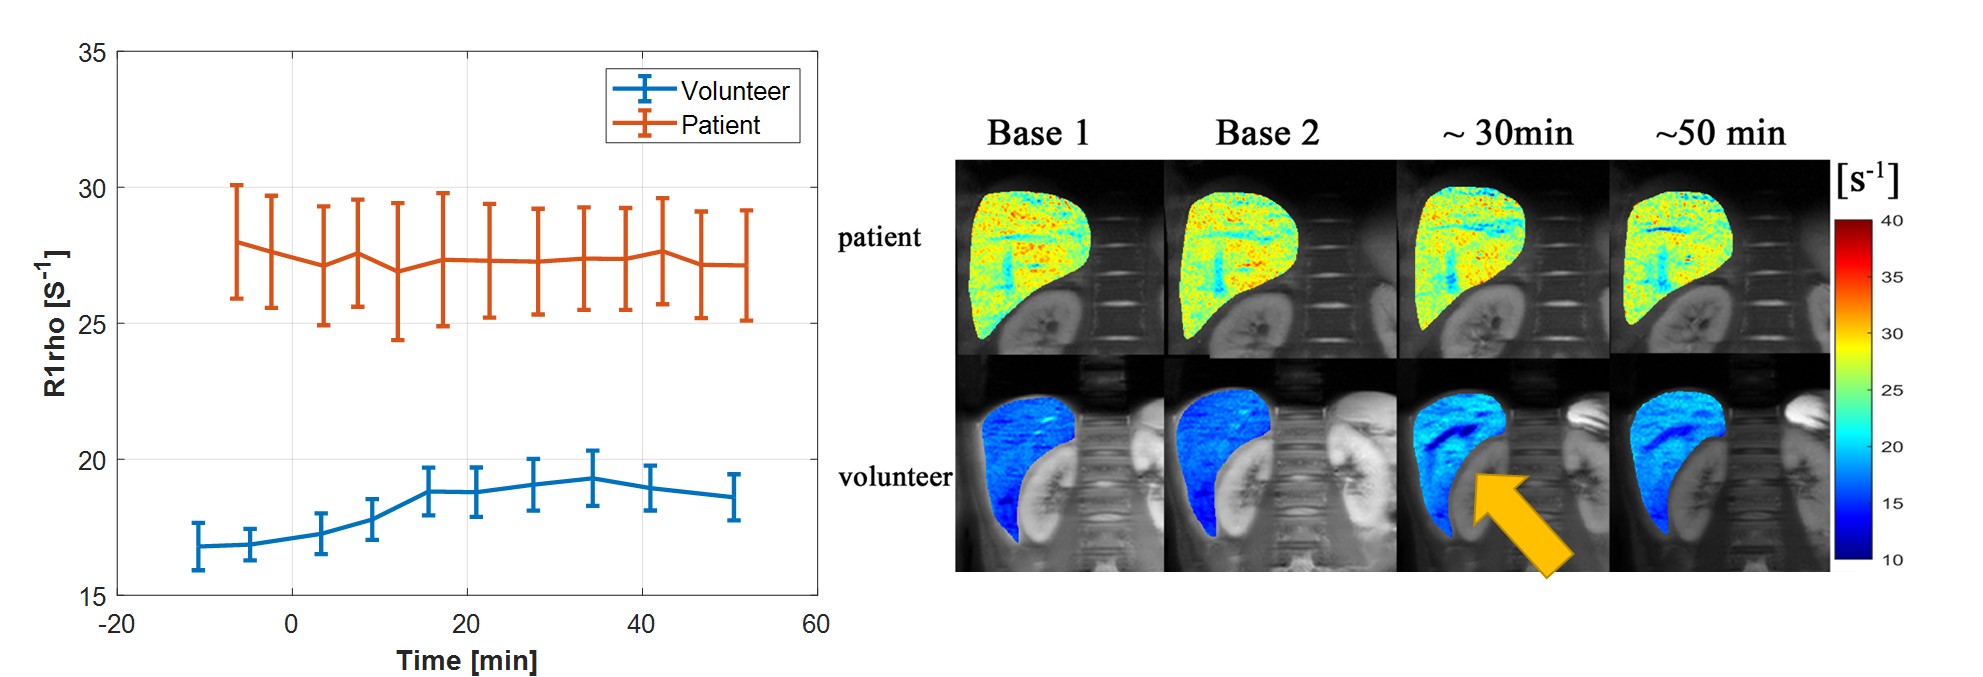
Figure 2. The temporal liver R1rho from one healthy
volunteer (fat fraction: 1%) and one patient (fat fraction: 22%, biopsy-confirm
with NASH, Fibrosis stage F2). Glucose ingestion time was set at zero. Right:
the R1rho dynamic change; left: R1rho maps at different temporal points.
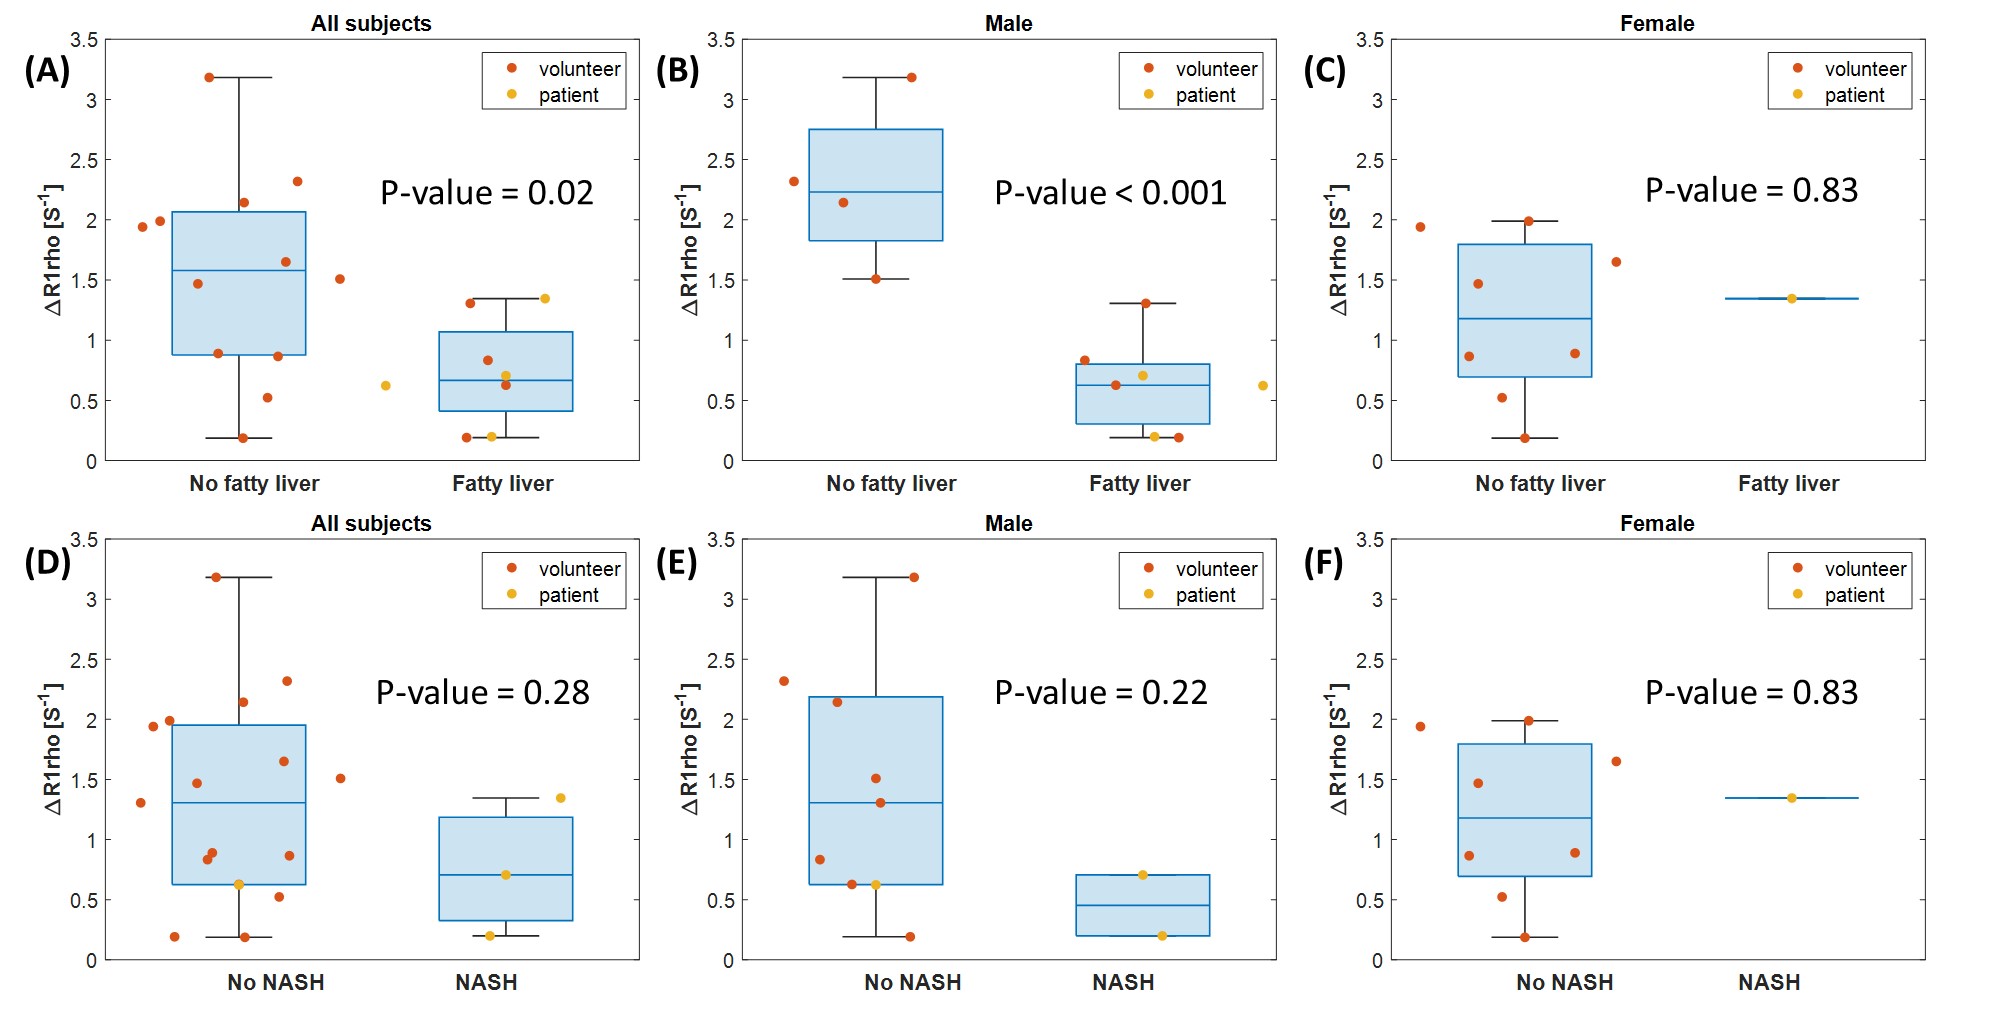
Figure 3. Comparing ΔR1rho between groups. (A-C) no fatty liver vs. fatty liver subjects, (D-F)
biopsy-confirmed NASH patients vs. young volunteers. (A) and (D) all subjects;
(B) and (E) male subjects; (C) and (F) female subjects. The difference of ΔR1rho between two
groups is more significant in male subjects than female subjects, p-value < 0.05 in (A) and (B).
DOI: https://doi.org/10.58530/2023/1215