1214
A Noninvasive Method with Three-Dimensional MR elastography in Assessing of Liver Fibrosis and Inflammation1Ruijin Hospital, Shanghai Jiaotong University School of Medicine, Shanghai, China
Synopsis
Keywords: Liver, Liver, MR elastography
Differentiating fibrosis and inflammation is vital important clinical distinction in patients with chronic liver disease (CLD). Liver histopathology is the worldwide reference standard for staging fibrosis and inflammation. Therefore, there is urgent need to develop non-invasive and low risk methods for staging liver fibrosis and inflammation. Current researches has been demonstrated that three-dimensional MRE allows showed higher diagnosis accuracy for staging liver fibrosis even inflammation than 2D MRE. Here, we prospectively evaluate the diagnosis efficacy of the parameters 3D MRE-derived for staging liver fibrosis and grade of inflammation in real clinical situations.Introduction
Chronic liver disease (CLD) is the leading cause of morbidity and mortality worldwide. Liver fibrosis and inflammation in CLD patients are dynamic process that can be reversed with treatment, especially in the early stages. Thus, in managing of patients with CLD, it is important to evaluate the severity of liver fibrosis and inflammation. The liver histopathology has been the worldwide reference standard in clinical practice for staging fibrosis and inflammation including some limitations. The development of non-invasive markers of staging liver fibrosis and inflammation is highly desirable. Considered one of the most accurate imaging methods for this purpose, 3D MRE has been adopted worldwide. By comparison, 3D MRE allows for basic viscoelastic modeling of tissue. However, these were less researches focus on mechanical properties of tissue with 3D MRE. The purpose of our study was to evaluate the diagnostic efficacy of the parameters 3D MRE-derived for staging liver fibrosis and grade of inflammation.Methods
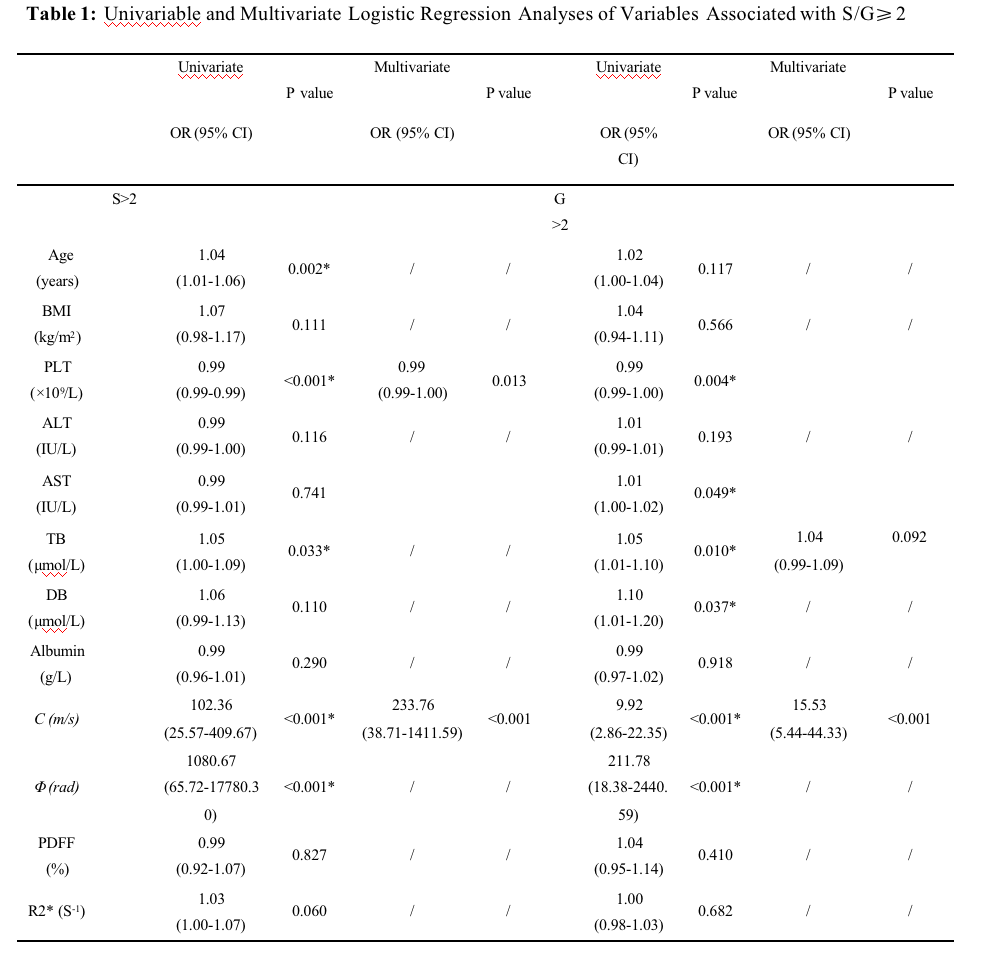
This prospective study included 396 consecutive patients who simultaneously underwent MRE examinations and liver biopsy from June 2020 and February 2022. According to the Scheuer system, 396 patients were divided into fibrosis groups(S<2, ≥2) and inflammation groups (G<2, ≥2). The 3D MRE viscoelastic parameters (shear wave speed [c]) and loss angle of the complex shear modulus [φ]) were measured by two observers. The intraclass correlation coefficient (ICC) and Bland-Altman analysis were performed for assessing the inter-observer agreement of measurements, and the Student’s t-test and Fisher exact tests were used to evaluate differences in subgroups. The multivariable logistic analysis was performed to assess associations of viscoelastic parameters with biopsy results. The efficacy of the different models was assessed by receiver operating characteristic (ROC) curve analysis.Results
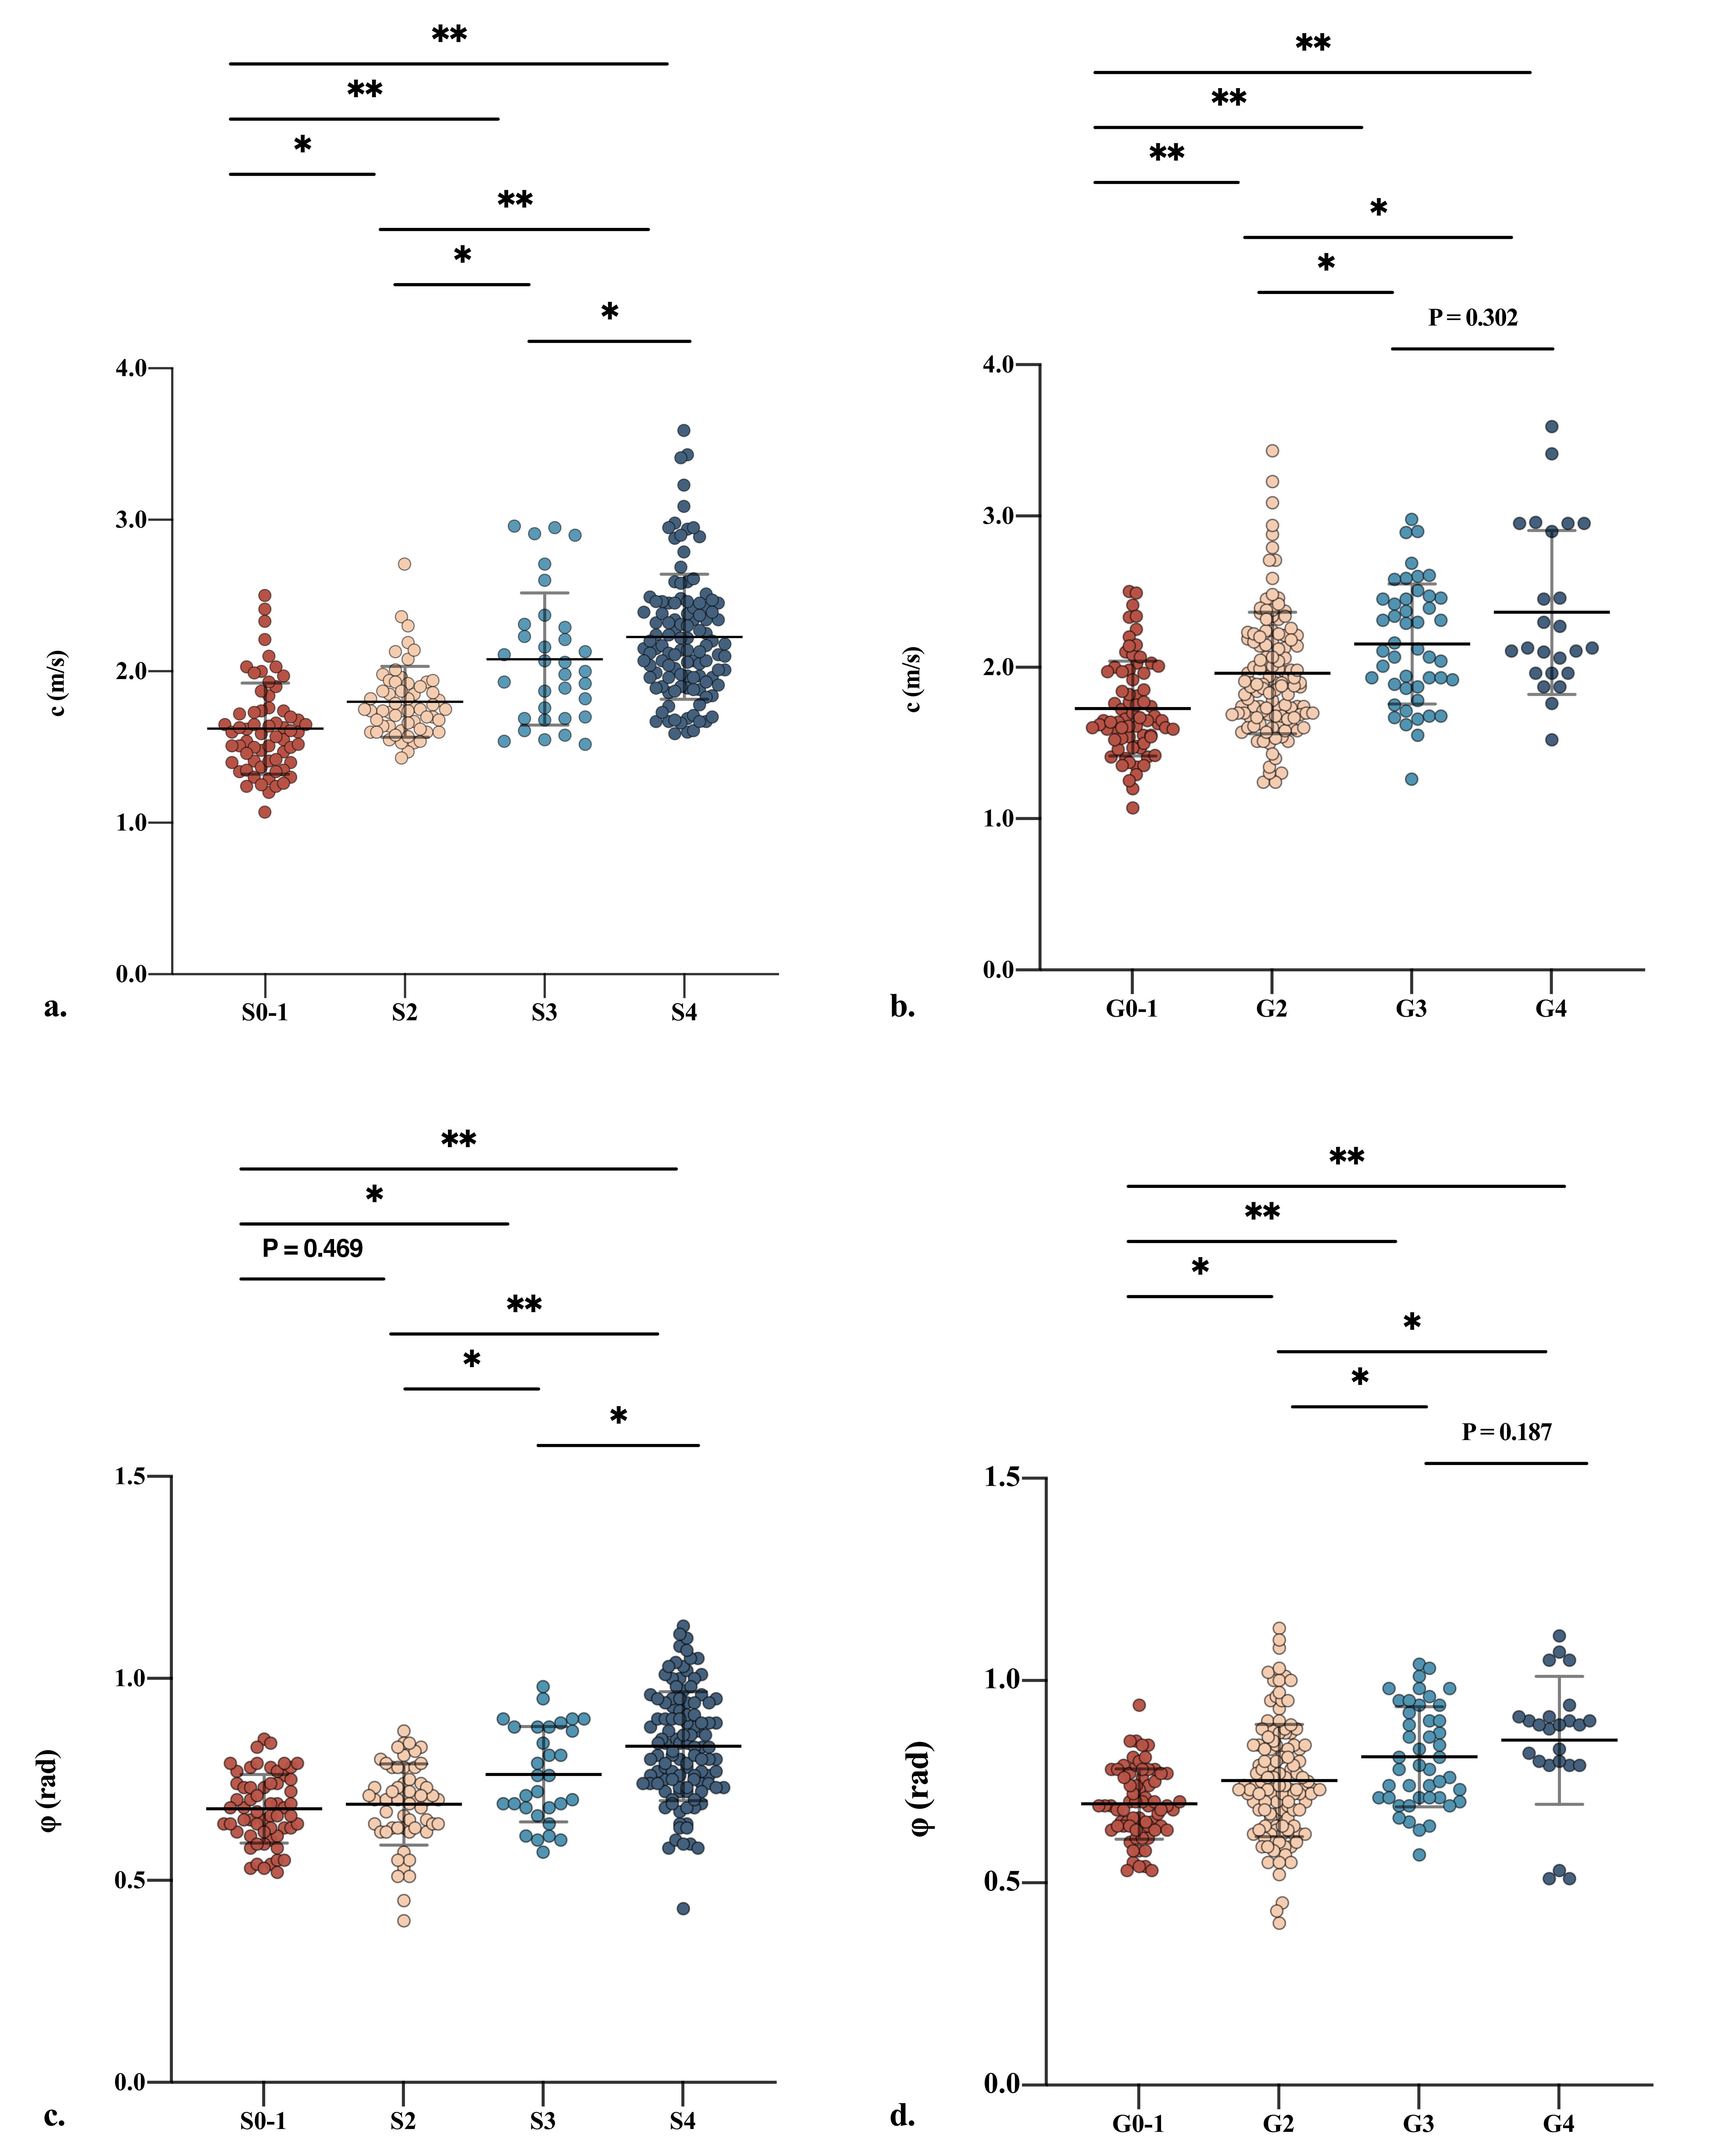
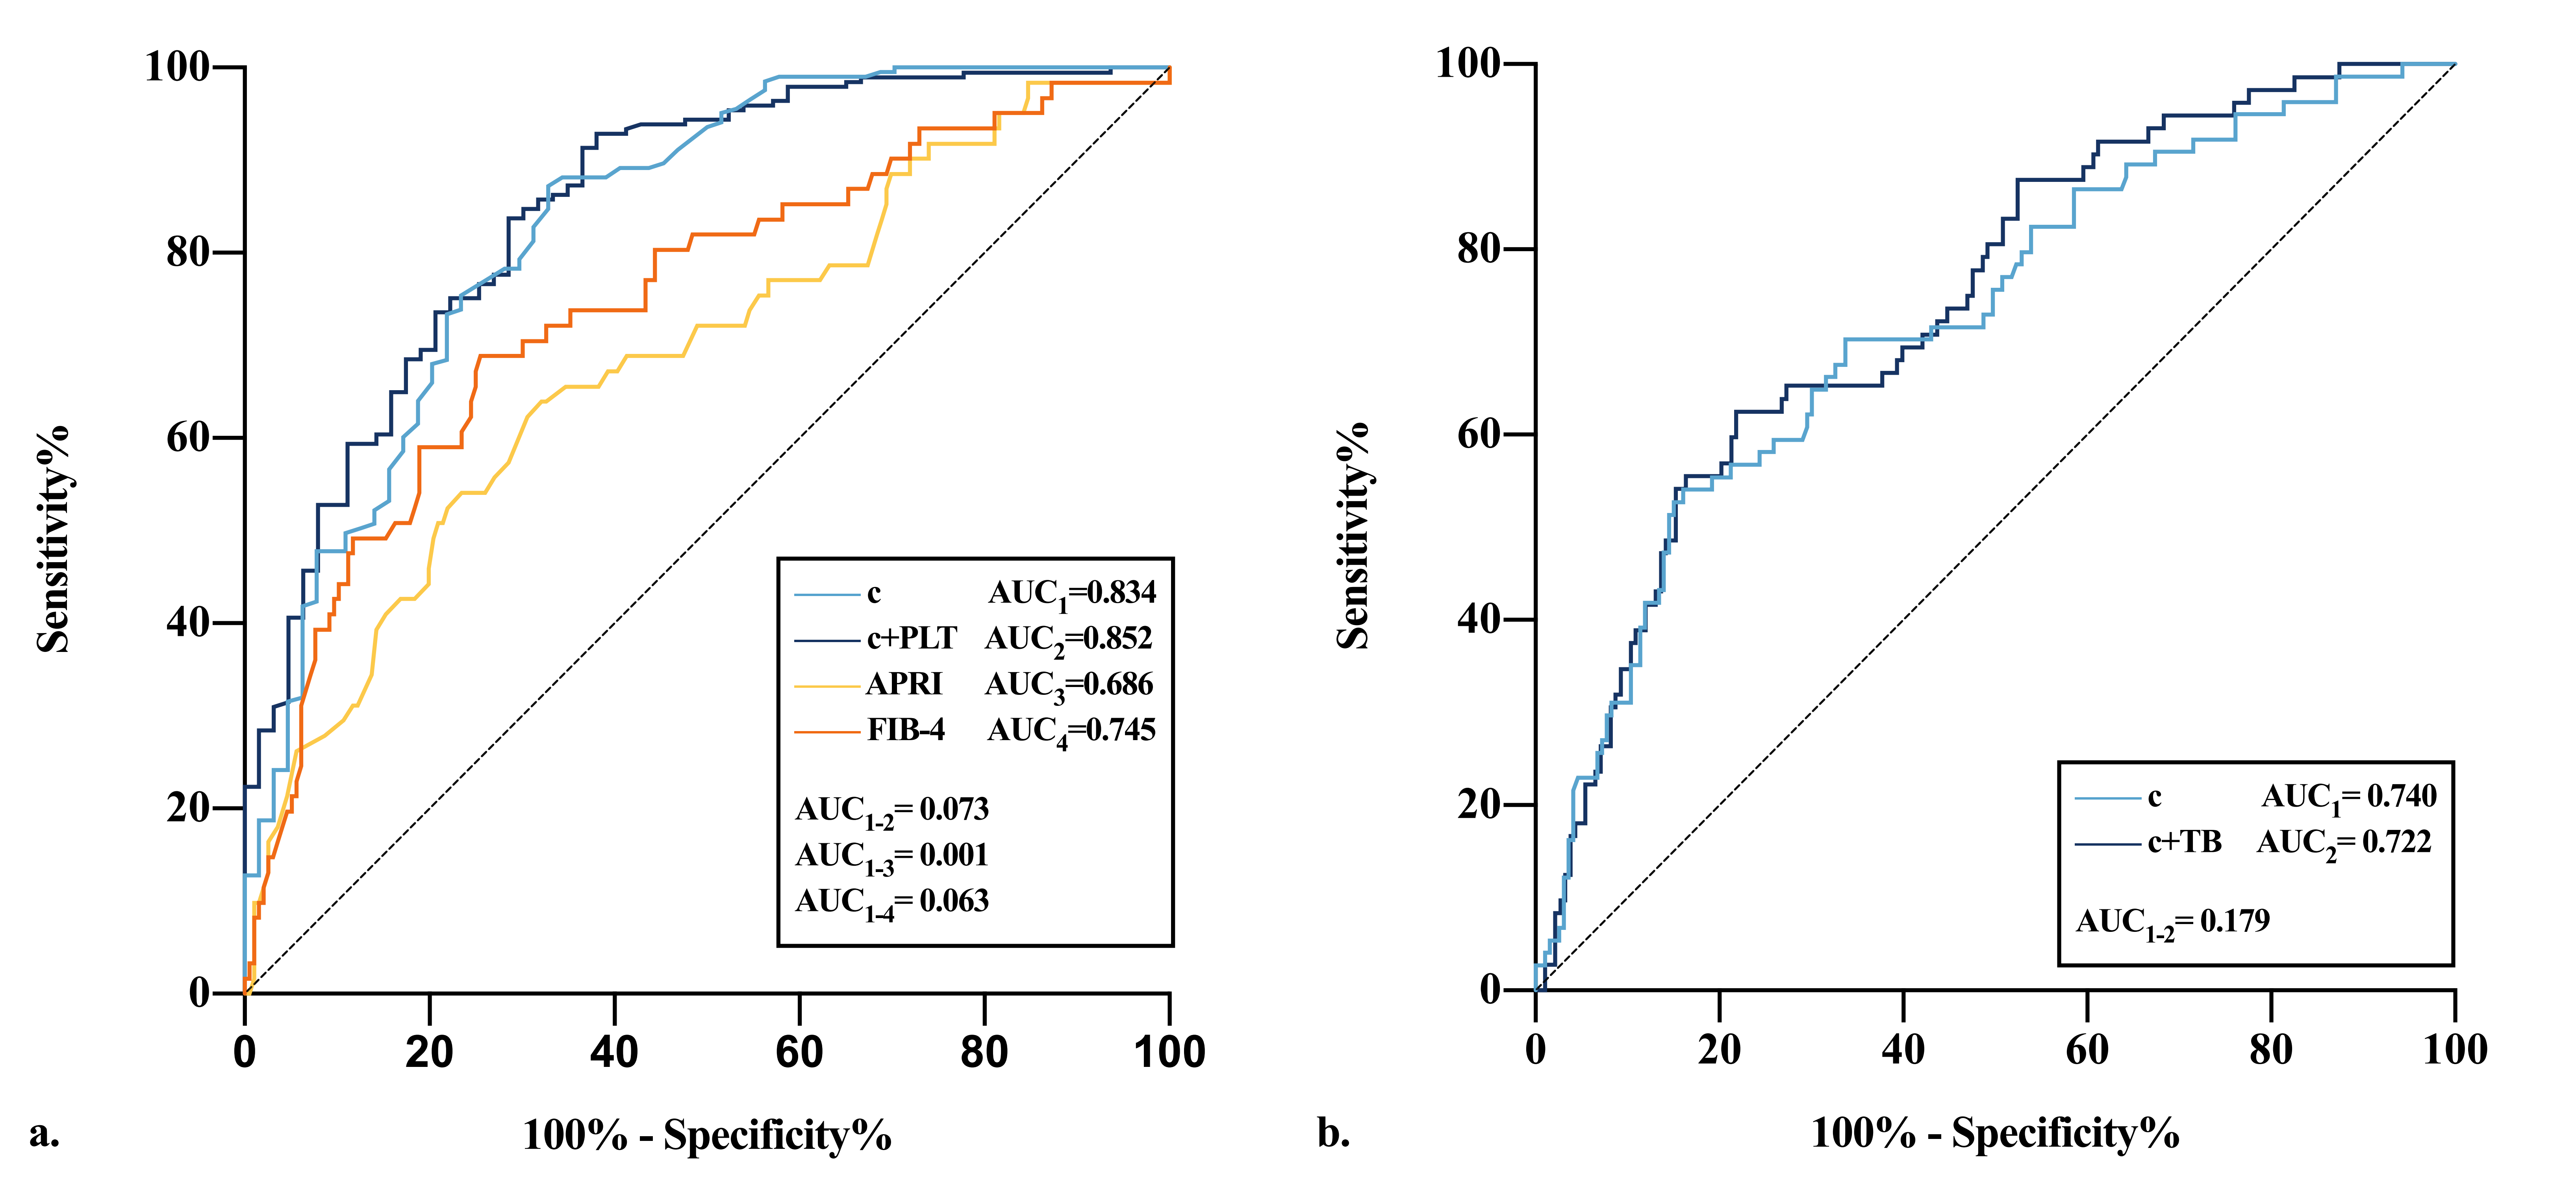
A total of 396 patients, 203 patients in advanced fibrosis group and 193 in severe inflammation group. The increase in c and φ values corresponded to the increase in the degree of histopathological stages with p <0.05. The c value alone showed excellent efficacy for diagnosing of advanced fibrosis and severe inflammation (AUC, 0.834 [95%CI: 0.797,0.970] vs AUC, 0.722 [95%CI: 0.654,0.791], respectively). The optimal cut-offs of c value for diagnosing fibrosis or inflammation at ≥80% sensitivity and ≥80% specificity were (1.70 m/s and 1.87m/s) or (1.69 m/s and 2.02 m/s).Discussion and Conclusion
In this prospective study, we demonstrated the diagnostic accuracy of 3D MRE for detecting liver fibrosis and inflammation in patients regardless of etiology. We observed that both c and φ increased gradually as the stages of fibrosis or inflammation progressed. In additional, we also found that the c value was retained as an independent risk factor of liver cirrhosis and inflammation with AUC of 0.834, 0.722, respectively. Current research suggests that patients with hepatitis receiving antiviral therapy at early stages of liver fibrosis and inflammation is conducive to the reversal of the pathological changes and prevention of the occurrence of complications. For this purpose, we altered the threshold values at least 80% sensitivity and specificity instead of the Youden index. We favor using 1.70 and 1.69 m/s as cut-off values in CLD patients for screening who had higher relative risk. The 1.87 and 2.20 m/s cut-off values could be applied in low-risk patients in order to avoid unnecessary liver biopsy. Our study has several limitations. First, the fibrosis and inflammation of the liver were evaluated by liver biopsy as the reference standard, which might cause interobserver variability. Second, it is a single center, retrospective study subject to potential unmeasured confounding, which needs validation at the multi-center level. In conclusion, 3D MRE could detect early inflammation and fibrosis and prove the diagnosis in patients with chronic liver disease.Acknowledgements
This study has received funding by National Natural Science Foundation of China (81901694).References
1.Asrani SK, Devarbhavi H, Eaton J, Kamath PS. Burden of liver diseases in the world. J Hepatol 2019; 70(1):151-171.
2.Gleeson J, Barry J, O'Reilly S. Use of Liver Imaging and Biopsy in Clinical Practice. N Engl J Med 2017; 377(23):2296.
3.Imajo K, Honda Y, Kobayashi T, Nagai K, Ozaki A, Iwaki M, Kessoku T, Ogawa Y, Takahashi H, Saigusa Y et al. Direct Comparison of US and MR Elastography for Staging Liver Fibrosis in Patients With Nonalcoholic Fatty Liver Disease. Clin Gastroenterol Hepatol 2022; 20(4):908-917 e911.
4.Shi Y, Qi YF, Lan GY, Wu Q, Ma B, Zhang XY, Ji RY, Ma YJ, Hong Y. Three-dimensional MR Elastography Depicts Liver Inflammation, Fibrosis, and Portal Hypertension in Chronic Hepatitis B or C. Radiology 2021; 301(1):154-162.
5.Sofue K, Onoda M, Tsurusaki M, Morimoto D, Yada N, Kudo M, Murakami T. Dual-frequency MR elastography to differentiate between inflammation and fibrosis of the liver: Comparison with histopathology. J Magn Reson Imaging 2020; 51(4):1053-1064.
6.Arena U, Vizzutti F, Corti G, Ambu S, Stasi C, Bresci S, Moscarella S, Boddi V, Petrarca A, Laffi G et al. Acute viral hepatitis increases liver stiffness values measured by transient elastography. Hepatology 2008; 47(2):380-384.
7.Yoshimitsu K, Mitsufuji T, Shinagawa Y, Fujimitsu R, Morita A, Urakawa H, Hayashi H, Takano K. MR elastography of the liver at 3.0 T in diagnosing liver fibrosis grades; preliminary clinical experience. Eur Radiol 2016; 26(3):656-663.
Figures