1213
3D MR Elastography: Exploring Quality Assurance Measures1Center for Medical Imaging Science and Visualization, Linköping University, Linköping, Sweden, 2Department of Medical Radiation Physics, and Department of Health, Medicine and Caring Sciences, Linköping University, Linköping, Sweden, 3Department of Biomedical Engineering, Linköping University, Linköping, Sweden, 4Department of Radiology in Linköping, and Department of Health, Medicine and Caring Sciences, Linköping University, Linköping, Sweden, 5Department of Gastroenterology and Hepatology, and Department of Health, Medicine and Caring Sciences, Linköping University, Linköping, Sweden, 6School of Biomedical Engineering and Imaging Science, King’s College London, London, United Kingdom
Synopsis
Keywords: Liver, Elastography, 3D MRE
Magnetic resonance elastography (MRE) is a powerful tool that can grade liver fibrosis non-invasively. In comparison with 2D MRE, 3D MRE can provide additional biomechanical tissue parameters for evaluating liver fibrosis. However, there is a great need to develop a quality assurance protocol for 3D MRE measurements. In this study, we have investigated quality assurance parameters for a 3D MRE research system and identified the cut-off values of the quality parameters to assign the 3D MRE data into three quality categories. A confidence map was constructed based on the evaluation of these quality parameters.Introduction
Chronic liver disease (CLD) is a major and increasing cause of morbidity and mortality globally 1. Patients with diabetes have a high prevalence of liver disease. CLD can result in fibrosis and ultimately develop into cirrhosis if it is untreated. Early fibrosis can be reversible, but CLDs are usually diagnosed at late stages. So, identifying fibrosis at early stages is crucial for improving the management of CLDs 2.Magnetic resonance elastography (MRE) is a well-established tool that can identify and stage liver fibrosis non-invasively 3,4. The current commercial MRE systems for clinical use are based on two-dimensional (2D) analysis. A more advanced version is three-dimensional (3D) MRE, which can image the shear wave field of the liver in three dimensions, providing high image quality and also additional biomechanical tissue parameters for evaluating liver fibrosis 5. However, unlike clinical 2D MRE systems which have a well-developed quality assurance (QA) protocol, there is a critical need for the development of a streamlined QA for 3D MRE. Therefore, this study aims to investigate the QA parameters for a 3D MRE research system.
Methods
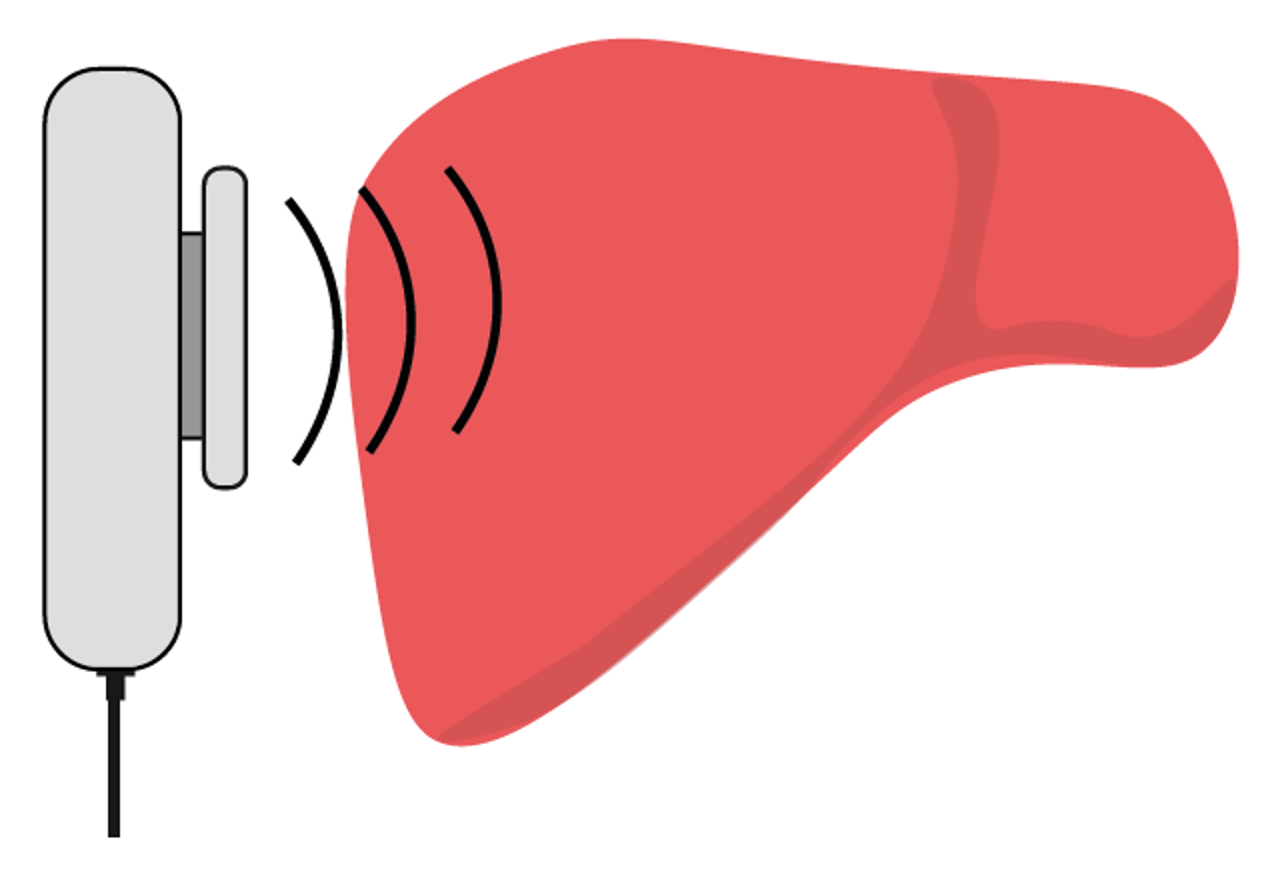
This study accessed data from 96 patients with type 2 diabetes (T2DM) who underwent 3D MRE examinations. The 3D MRE research system includes an Achieva dStream 1.5 T MR-scanner (Philips Healthcare, Best, The Netherlands) and an active electromagnetic transducer (Philips Medical, Hamburg, Germany) generating continuous mechanical waves at 60 Hz. The measurements were performed using a rapid multislice 3D motion encoding MRE sequence, which is based on a gradient echo (GRE) phase-contrast sequence, namely eXpresso 6. A phased array body coil was employed. Acquisition parameters: FOV (ap * fh * rl) = 256 * 32 * 320 mm3, matrix size = 80 * 80, slice thickness = 4 mm, # slice = 8, FA = 25°, TR = 137.5 ms, TE = 114 ms. The electromagnetic transducer was placed on the right hemiliver during the examination, as shown in Fig. 1.Elastograms were reconstructed and evaluated on a pixel-per-pixel basis using a custom software package, KIR (Kings College, London, UK), which is based on an open-source data analysis framework, ROOT 7. A region of interest (ROI) used for calculating biomechanical properties (complex shear modulus, storage modulus, loss modulus, attenuation and wave speed) was drawn close to the placement of the transducer, while at the same time avoiding large blood vessels and liver edges. The magnitude of the complex shear modulus (GAbs) was used to describe the elasticity value in this study. Three quality parameters (nonlinearity, signal-to-noise ratio (SNR) and total wave displacement amplitude (Atot)) estimated using the ROI data were applied to assess the quality of 3D MRE measurements. Nonlinearity is the ratio of the second harmonic frequency to the base frequency, describing the deviation from a perfect sinusoid without any noise 8.
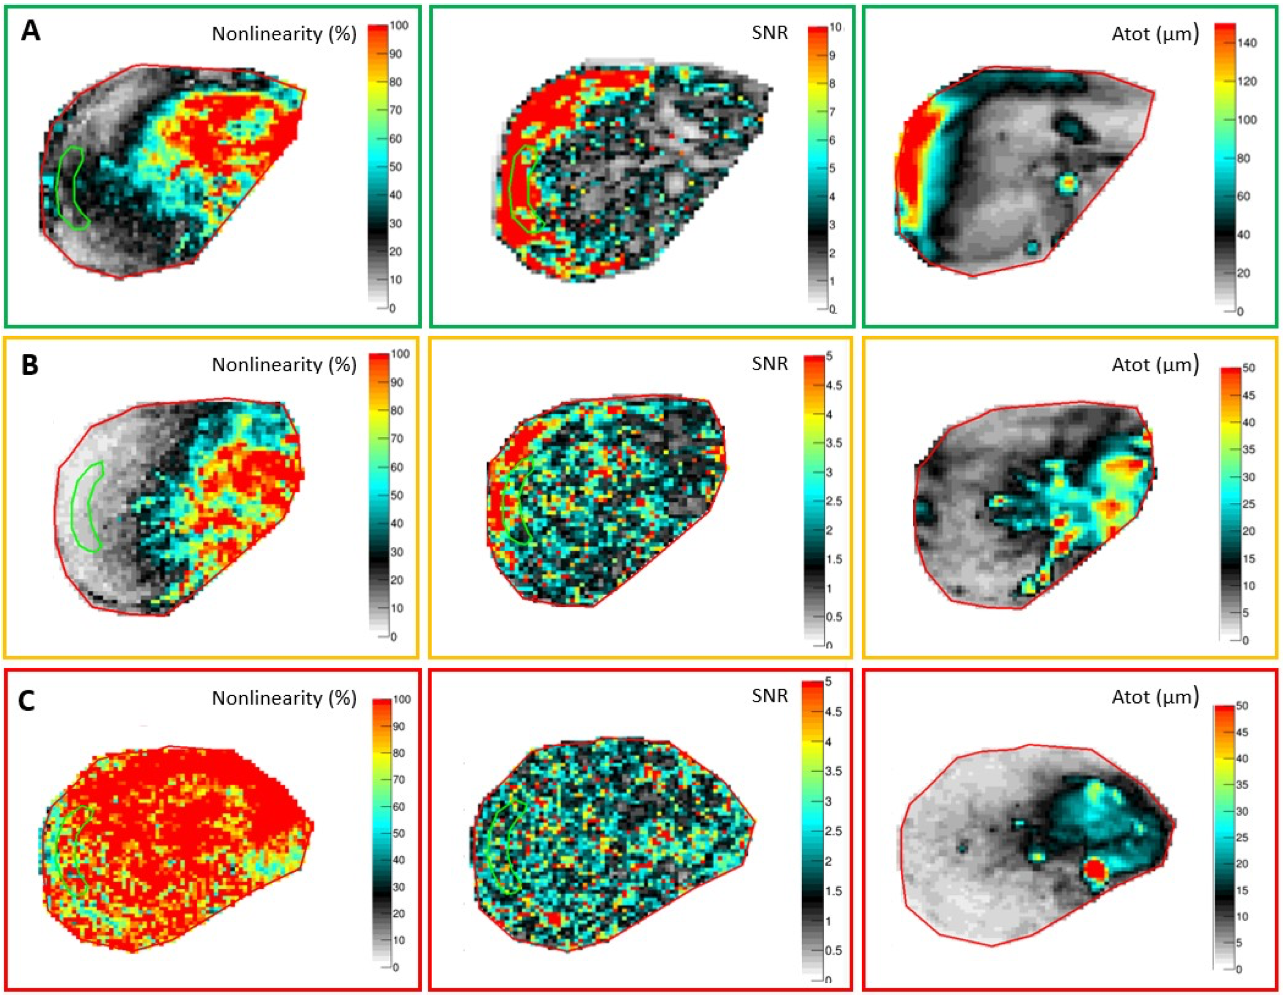
Elastograms were assigned to three quality groups: excellent-quality, intermediate-quality and no-wave elastograms (no current to the transducer), based on the mean values of the nonlinearity and SNR of the selected ROI and the observation of the wave displacement. The excellent-quality elastogram has an average ROI nonlinearity below 30%, an average ROI SNR exceeding 4 and an observable displacement close to the placement of the transducer in the Atot map. The elastograms with an average ROI nonlinearity below 30%, but an average ROI SNR less than or equal to 4, or no clear displacement observed, were assigned to the intermediate-quality group. The non-wave elastograms were sorted with an average ROI nonlinearity larger than 30%.
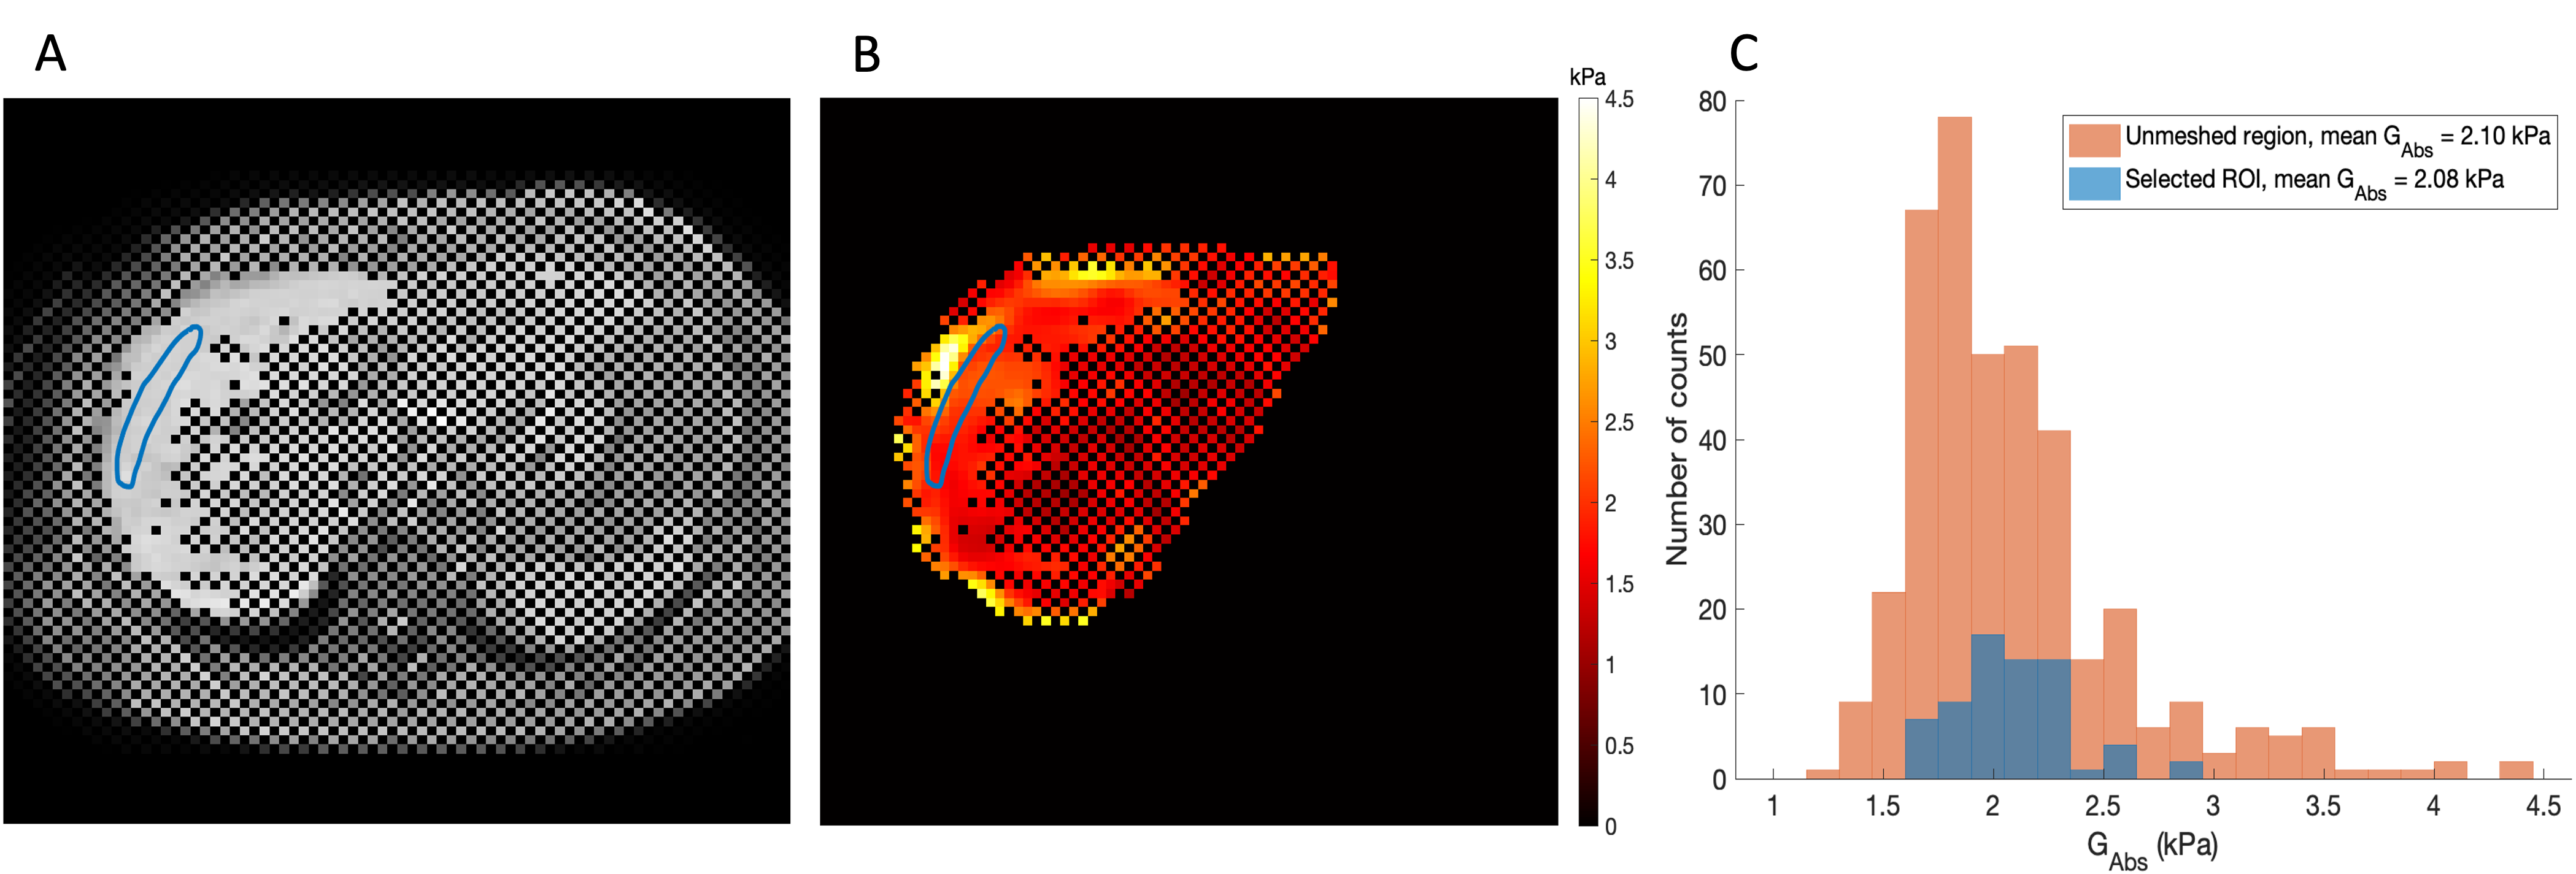
A confidence or quality map was constructed using the binary masks obtained from nonlinearity < 30% (M1) and SNR > 4 (M2), respectively. The confidence map was then obtained using the intersection mask, M1 $$$\cap$$$ M2, superimposed on the GAbs map of the liver.
Results and Discussion
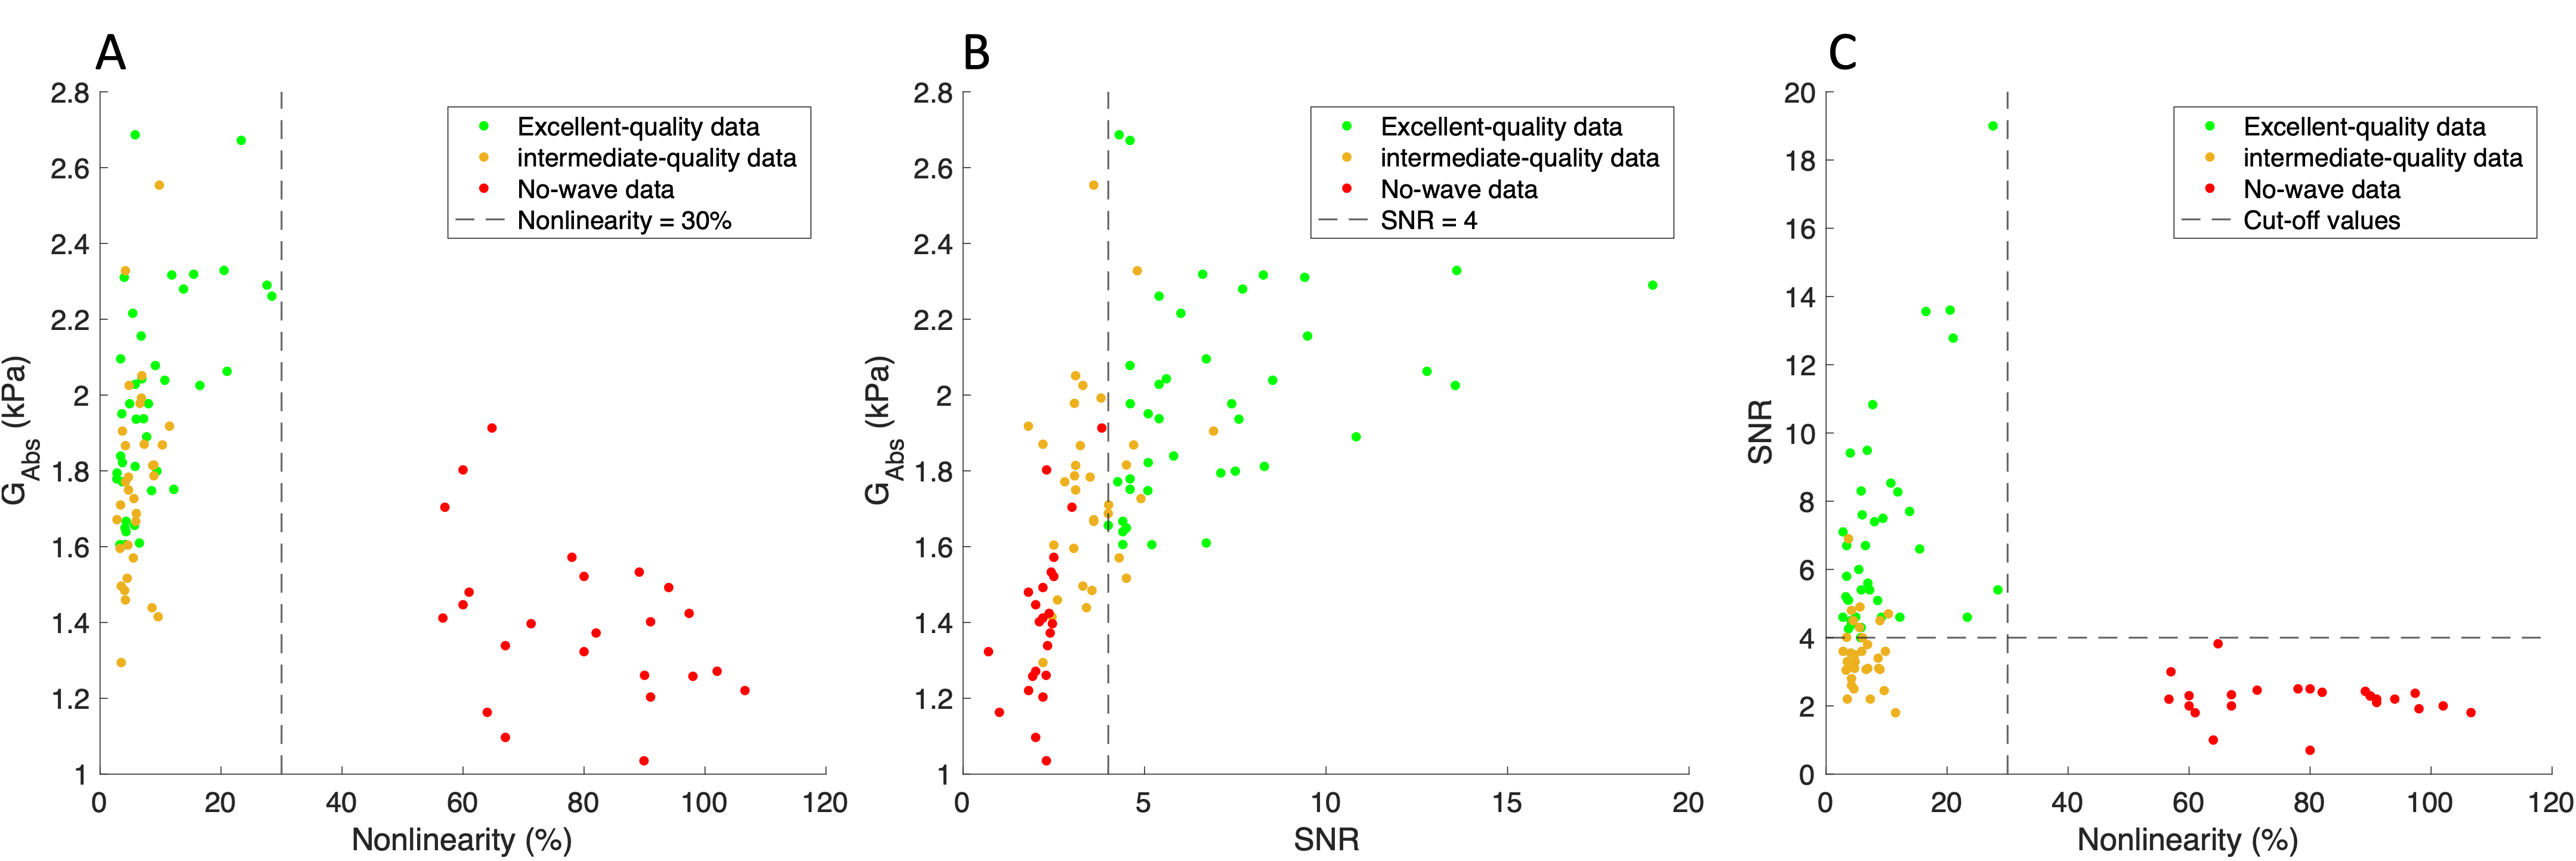
After the quality evaluation, 40 measurements were categorized as excellent-quality, 32 as intermediate-quality and 24 as no waves. Typical examples for each quality group are shown in Fig. 2. Fig. 3 illustrates the distribution of SNR, nonlinearity and elasticity value (GAbs) for each quality group. As expected, low values of liver elasticity for each subject were estimated. No-wave data presents a lower value of GAbs (Figs. 3A and 3B). As can be observed in Fig. 3C, the cut-off values of the nonlinearity and SNR performed well in sorting the three quality groups for most cases, especially for the separation of the non-wave data, suggesting the possibility of using these two cut-off values to generate a confidence map to indicate the region of reliable data for 3D MRE analysis. Fig. 4 shows an example of performing QA for 3D MRE with a confidence map to draw an ROI.Conclusion
The data quality of 3D MRE can successfully be accessed by evaluating three main quality parameters, nonlinearity, SNR and Atot. It was then possible to generate a confidence map using suitable cut-off values of nonlinearity and SNR, which provided reliable data for 3D MRE analysis.Acknowledgements
No acknowledgement found.References
1. Younossi ZM, Stepanova M, Afendy M, et al. Changes in the prevalence of the most common causes of chronic liver diseases in the United States from 1988 to 2008. Clin Gastroenterol Hepatol. 2011;9(6):524-530.e1; quiz e60.
2. Shiha G, Ibrahim A, Helmy A, et al. Asian-Pacific Association for the Study of the Liver (APASL) consensus guidelines on invasive and non-invasive assessment of hepatic fibrosis: a 2016 update. Hepatol. 2017;11, 1–30.
3. Huwart L, Peeters F, Sinkus R, et al. Liver fibrosis: non-invasive assessment with MR elastography. NMR Biomed. 2006;19(2):173-9.
4. Singh S, Venkatesh, SK and Wang Z, et al. Diagnostic Performance of Magnetic Resonance Elastography in Staging Liver Fibrosis: A Systematic Review and Meta-analysis of Individual Participant Da. Clin Gastroenterol Hepatol. 2015;13(3):440–451.e6.
5. Li M, Yang H, Liu Y, et al. Comparison of the diagnostic performance of 2D and 3D MR elastography in staging liver fibrosis. Eur Radiol. 2021;31(12):9468-9478.
6. Garteiser P, Sahebjavaher RS, Ter Beek, LC, et al. Rapid acquisition of multifrequency, multislice and multidirectional MR elastography data with a fractionally encoded gradient echo sequence. NMR Biomed. 2013; 26: 1326-1335.
7. Brun R, Rademakers F, ROOT - An object oriented data analysis framework. Nucl. Inst. & Meth. in Phys. Res. A. 1997;389(1-2): 81-86. See also “ROOT”, ver. 5.34/17 [software]. Available from: https://root.cern/.
8. Runge JH, Hoelzl SH, Sudakova J, et al. A novel magnetic resonance elastography transducer concept based on a rotational eccentric mass: preliminary experiences with the gravitational transducer. Physics in Medicine & Biology. 2019;64(4):045007.
Figures