1212
Combining radiomic features with background parenchymal enhancement from DCE-MRI data for predicting treatment response in breast cancer
Kalina Polet Slavkova1, Eric A Cohen1, Rhea Chitalia2, Snekha Thakran1, Walter C Mankowski1, Alex Nguyen2, Hannah Horng2, Elizabeth S McDonald3, Michael D Feldman4, Angela DeMichele5,6, and Despina Kontos7
1Department of Radiology, University of Pennsylvania, Philadelphia, PA, United States, 2Department of Bioengineering, University of Pennsylvania, Philadelphia, PA, United States, 3Department of Radiology, Hospital of the University of Pennsylvania, Philadelphia, PA, United States, 4Division of Surgical Pathology, Hospital of the University of Pennsylvania, Philadelphia, PA, United States, 5Division of Hematology Oncology, Perelman Center for Advanced Medicine, Philadelphia, PA, United States, 6Abramson Cancer Center, University of Pennsylvania, Philadelphia, PA, United States, 7Radiology, University of Pennsylvania, Philadelphia, PA, United States
1Department of Radiology, University of Pennsylvania, Philadelphia, PA, United States, 2Department of Bioengineering, University of Pennsylvania, Philadelphia, PA, United States, 3Department of Radiology, Hospital of the University of Pennsylvania, Philadelphia, PA, United States, 4Division of Surgical Pathology, Hospital of the University of Pennsylvania, Philadelphia, PA, United States, 5Division of Hematology Oncology, Perelman Center for Advanced Medicine, Philadelphia, PA, United States, 6Abramson Cancer Center, University of Pennsylvania, Philadelphia, PA, United States, 7Radiology, University of Pennsylvania, Philadelphia, PA, United States
Synopsis
Keywords: Breast, Breast, radiomics, DCE-MRI
Our objective is to predict pathological complete response (pCR) outcome to neoadjuvent chemotherapy in breast cancer patients. We combine radiomic features with background parenchymal enhancement -- computed from standard-of DCE-MRI data from the ISPY-2 trial -- and model treatment outcome via multivariable logistic regression. During training and testing, we demonstrate that models including BPE alongside radiomic and clinical covariates yielded the highest AUC values among all tested regression models, thus improving the prediction of pCR outcome.Introduction
The ability to noninvasively predict pathological complete response (pCR) to neoadjuvant chemotherapy (NAC) for breast cancer patients using standard-of-care MRI data would enable clinicians to determine optimal treatment strategies based on expected response1,2, potentially optimizing patient care and surgical outcome. Thus, there is a push to develop predictive methods that rely on clinically available data, such as dynamic contrast-enhanced (DCE) MRI data, with less barriers to clinical translation3,4. The field of radiomics aims to extract high-throughput features from clinical images that characterize tumor biology, which can be subsequently leveraged for predicting clinical outcomes5–7. Background parenchymal enhancement (BPE), defined as the enhancement of healthy tissue in clinical DCE-MRI scans, is a physiological feature shown to be associated with pCR outcome8–10. Here we demonstrate an improved ability to predict pCR outcome from a combination of radiomic features and BPE measures using DCE-MRI data collected in the community setting.Methods
Datasets. The BMMR2 dataset contains DCE-MRI images from 191 women recruited by the ACRIN 6698/ISPY-2 trial11–14 with annotated tumor regions of interest (ROIs). The data were split 60%/40% into training and testing sets, respectively. A subset of 140 datasets (88 training and 52 testing) with readily available data were analyzed in this work. Images from two visits were included for analysis: T0 (prior to NAC) and T1 (early in treatment after three weeks of NAC). Hormone receptor (HR) and HER2 status, MRI-measured longest diameter (LD) at T0, and pCR outcome (for the training set alone with 23 pCR and 65 non-pCR outcomes) were provided.Image preprocessing. For feature extraction, all images (Figure 1A) were first bias-field corrected15 and resampled to 0.9×0.89×2.5 mm, which was the lowest available spatial resolution across all datasets. Four standard kinetic maps were computed from these preprocessed images: wash-in slope (WIS), wash-out slope (WOS), percent enhancement (PE), and signal enhancement ratio (SER).
Feature extraction. Three types of radiomic texture features were calculated from the four kinetic maps (Figure 1B) within the ROI. These types include the textures of the T0 SER maps, the differences between the texture features from the four T1 kinetic maps and corresponding T0 maps, and the differences between the registered T1 kinetic maps and corresponding T0 maps. In each case, we calculated the features using the publicly available CaPTk software16. We normalized and then harmonized the features using OPNested ComBat17, considering manufacturer, magnetic field strength, and through-plane resolution as batch effects. Three established tumor size measures were also computed for both T0 and T1 images: longest diameter, functional tumor volume, and clinical size.
BPE quantification. BPE was estimated quantitatively from the T0 precontrast and first postcontrast phase images using a previously validated automated algorithm18 (Figure 1C). The final BPE metrics for each dataset were the median BPE (mBPE) across the ipsilateral breast as well as the ratio of volume of tissue exhibiting BPE to whole breast volume (vBPE). The mBPE and vBPE distributions across datasets were transformed to the standard normal distribution (mean 0, standard deviation 1).
Statistical analysis. Principal component analysis was applied to the extracted features, resulting in two primary principal components (PC1 and PC2). We modeled pCR outcome via multivariable logistic regression (Figure 1D), considering combinations of up to five covariates from the following: HR status, HER2 status, PC1, PC2, mBPE, and vBPE. We evaluated the models on the training data via cross-validated area under the receiver operating characteristic curve (AUC) (5-fold, 200 repetitions). The Kolmogorov-Smirnov (KS) two-sample test was used to determine similarity in AUC distributions across models and replicates at a significance level of p<0.05.
Results
Example of pre- and post-contrast images with resulting BPE volume maps are displayed in Figure 2 for a pCR and non-pCR subject, demonstrating more diffuse BPE volume throughout the breast in the pCR case. In Figure 3, Tables A and B report the mean AUCs from model performance on the model-building and held-out folds, respectively. On the model-building folds, the model parameterized by PC1, PC2, HR, HER2, and mBPE performed the best with AUC=0.83. On the held-out folds, the model parameterized by PC1, HR, HER2, and mBPE yielded the highest AUC of 0.78. For these two best-performing models, Table C reports the p-values from the KS test comparing the AUC distributions across models. Combining radiomics features with median BPE as a covariate yielded a significantly different AUC distribution on the held-out fold (p<0.05), when compared to nested models that excluded mBPE. The vBPE covariate did not significantly improve performance.Discussion and Conclusion
In this work, we demonstrated an increased performance in predicting pCR outcome in breast NAC by combining radiomic features with BPE. Combining mBPE with clinical and radiomic covariates yielded the highest AUC values among all seven regression models, thus improving the prediction of pCR outcome. Interestingly, vBPE did not improve model performance, suggesting that the volume of enhancing parenchyma is less predictive than the value of BPE itself. Ongoing work involves expanding the proposed analysis to all 191 patients in the ISPY2 dataset. Additionally, we are working to incorporate BPE measures from both T0 and T1 images as well as changes in BPE measures across imaging visits as additional covariates.Acknowledgements
This study was supported by the NCI at the NIH through 5R01CA223816-05 and 5R01CA197000-05. We offer a sincere thank you to all of the women who were enrolled in the ISPY-2 trial.References
- Bonnefoi H, Litière S, Piccart M, et al. Pathological complete response after neoadjuvant chemotherapy is an independent predictive factor irrespective of simplified breast cancer intrinsic subtypes: a landmark and two-step approach analyses from the EORTC 10994/BIG 1-00 phase III trial. Annals of Oncology. 2014;25(6):1128-1136. doi:10.1093/annonc/mdu1182.
- Granzier RWY, van Nijnatten TJA, Woodruff HC, Smidt ML, Lobbes MBI. Exploring breast cancer response prediction to neoadjuvant systemic therapy using MRI-based radiomics: A systematic review. Eur J Radiol. 2019;121:108736. doi:10.1016/j.ejrad.2019.1087363.
- Abramson RG, Burton KR, Yu JPJ, et al. Methods and Challenges in Quantitative Imaging Biomarker Development. Acad Radiol. 2015;22(1):25-32. doi:10.1016/j.acra.2014.09.0014.
- Abramson RG, Su PF, Shyr Y. Quantitative metrics in clinical radiology reporting: a snapshot perspective from a single mixed academic-community practice. Magn Reson Imaging. 2012;30(9):1357-1366. doi:10.1016/j.mri.2012.04.0185.
- Parekh VS, Jacobs MA. Integrated radiomic framework for breast cancer and tumor biology using advanced machine learning and multiparametric MRI. NPJ Breast Cancer. 2017;3:43. doi:10.1038/s41523-017-0045-36.
- Ashraf A, Gaonkar B, Mies C, et al. Breast DCE-MRI Kinetic Heterogeneity Tumor Markers: Preliminary Associations With Neoadjuvant Chemotherapy Response. Transl Oncol. 2015;8(3):154-162. doi:10.1016/j.tranon.2015.03.0057.
- Chitalia RD, Rowland J, McDonald ES, et al. Imaging phenotypes of breast cancer heterogeneity in preoperative breast dynamic contrast enhanced magnetic resonance imaging (DCE-MRI) scans predict 10-year recurrence. Clinical Cancer Research. 2020;26(4):862-869. doi:10.1158/1078-0432.CCR-18-40678.
- Li W, Newitt DC, Gibbs J, et al. Predicting breast cancer response to neoadjuvant treatment using multi-feature MRI: results from the I-SPY 2 TRIAL. NPJ Breast Cancer. 2020;6(1):63. doi:10.1038/s41523-020-00203-79.
- Arasu VA, Kim P, Li W, et al. Predictive Value of Breast MRI Background Parenchymal Enhancement for Neoadjuvant Treatment Response among HER2- Patients. J Breast Imaging. 2020;2(4):352-360. doi:10.1093/jbi/wbaa02810.
- Moliere S, Oddou I, Noblet V, Veillon F, Mathelin C. Quantitative background parenchymal enhancement to predict recurrence after neoadjuvant chemotherapy for breast cancer. Sci Rep. 2019;9(1):19185. doi:10.1038/s41598-019-55820-511.
- Li W, Newitt DC, Gibbs J, et al. Predicting breast cancer response to neoadjuvant treatment using multi-feature MRI: results from the I-SPY 2 TRIAL. NPJ Breast Cancer. 2020;6(1):63. doi:10.1038/s41523-020-00203-712.
- Partridge SC, Zhang Z, Newitt DC, et al. Diffusion-weighted MRI Findings Predict Pathologic Response in Neoadjuvant Treatment of Breast Cancer: The ACRIN 6698 Multicenter Trial. Radiology. 2018;289(3):618-627. doi:10.1148/radiol.201818027313.
- Clark K, Vendt B, Smith K, et al. The Cancer Imaging Archive (TCIA): Maintaining and Operating a Public Information Repository. J Digit Imaging. 2013;26(6):1045-1057. doi:10.1007/s10278-013-9622-714.
- Newitt DC, Zhang Z, Gibbs JE, et al. Test–retest repeatability and reproducibility of ADC measures by breast DWI: Results from the ACRIN 6698 trial. Journal of Magnetic Resonance Imaging. 2019;49(6):1617-1628. doi:10.1002/jmri.2653915.
- Tustison NJ, Avants BB, Cook PA, et al. N4ITK: improved N3 bias correction. IEEE Trans Med Imaging. 2010;29(6):1310-1320. doi:10.1109/TMI.2010.204690816.
- Davatzikos C, Rathore S, Bakas S, et al. Cancer imaging phenomics toolkit: quantitative imaging analytics for precision diagnostics and predictive modeling of clinical outcome. Journal of Medical Imaging. 2018;5(01):1. doi:10.1117/1.jmi.5.1.01101817.
- Horng H, Singh A, Yousefi B, et al. Improved generalized ComBat methods for harmonization of radiomic features. Sci Rep. 2022;12(19009).18.
- Wei D, Jahani N, Cohen E, et al. Fully automatic quantification of fibroglandular tissue and background parenchymal enhancement with accurate implementation for axial and sagittal breast MRI protocols. Med Phys. 2021;48(1):238-252. doi:10.1002/mp.14581
Figures
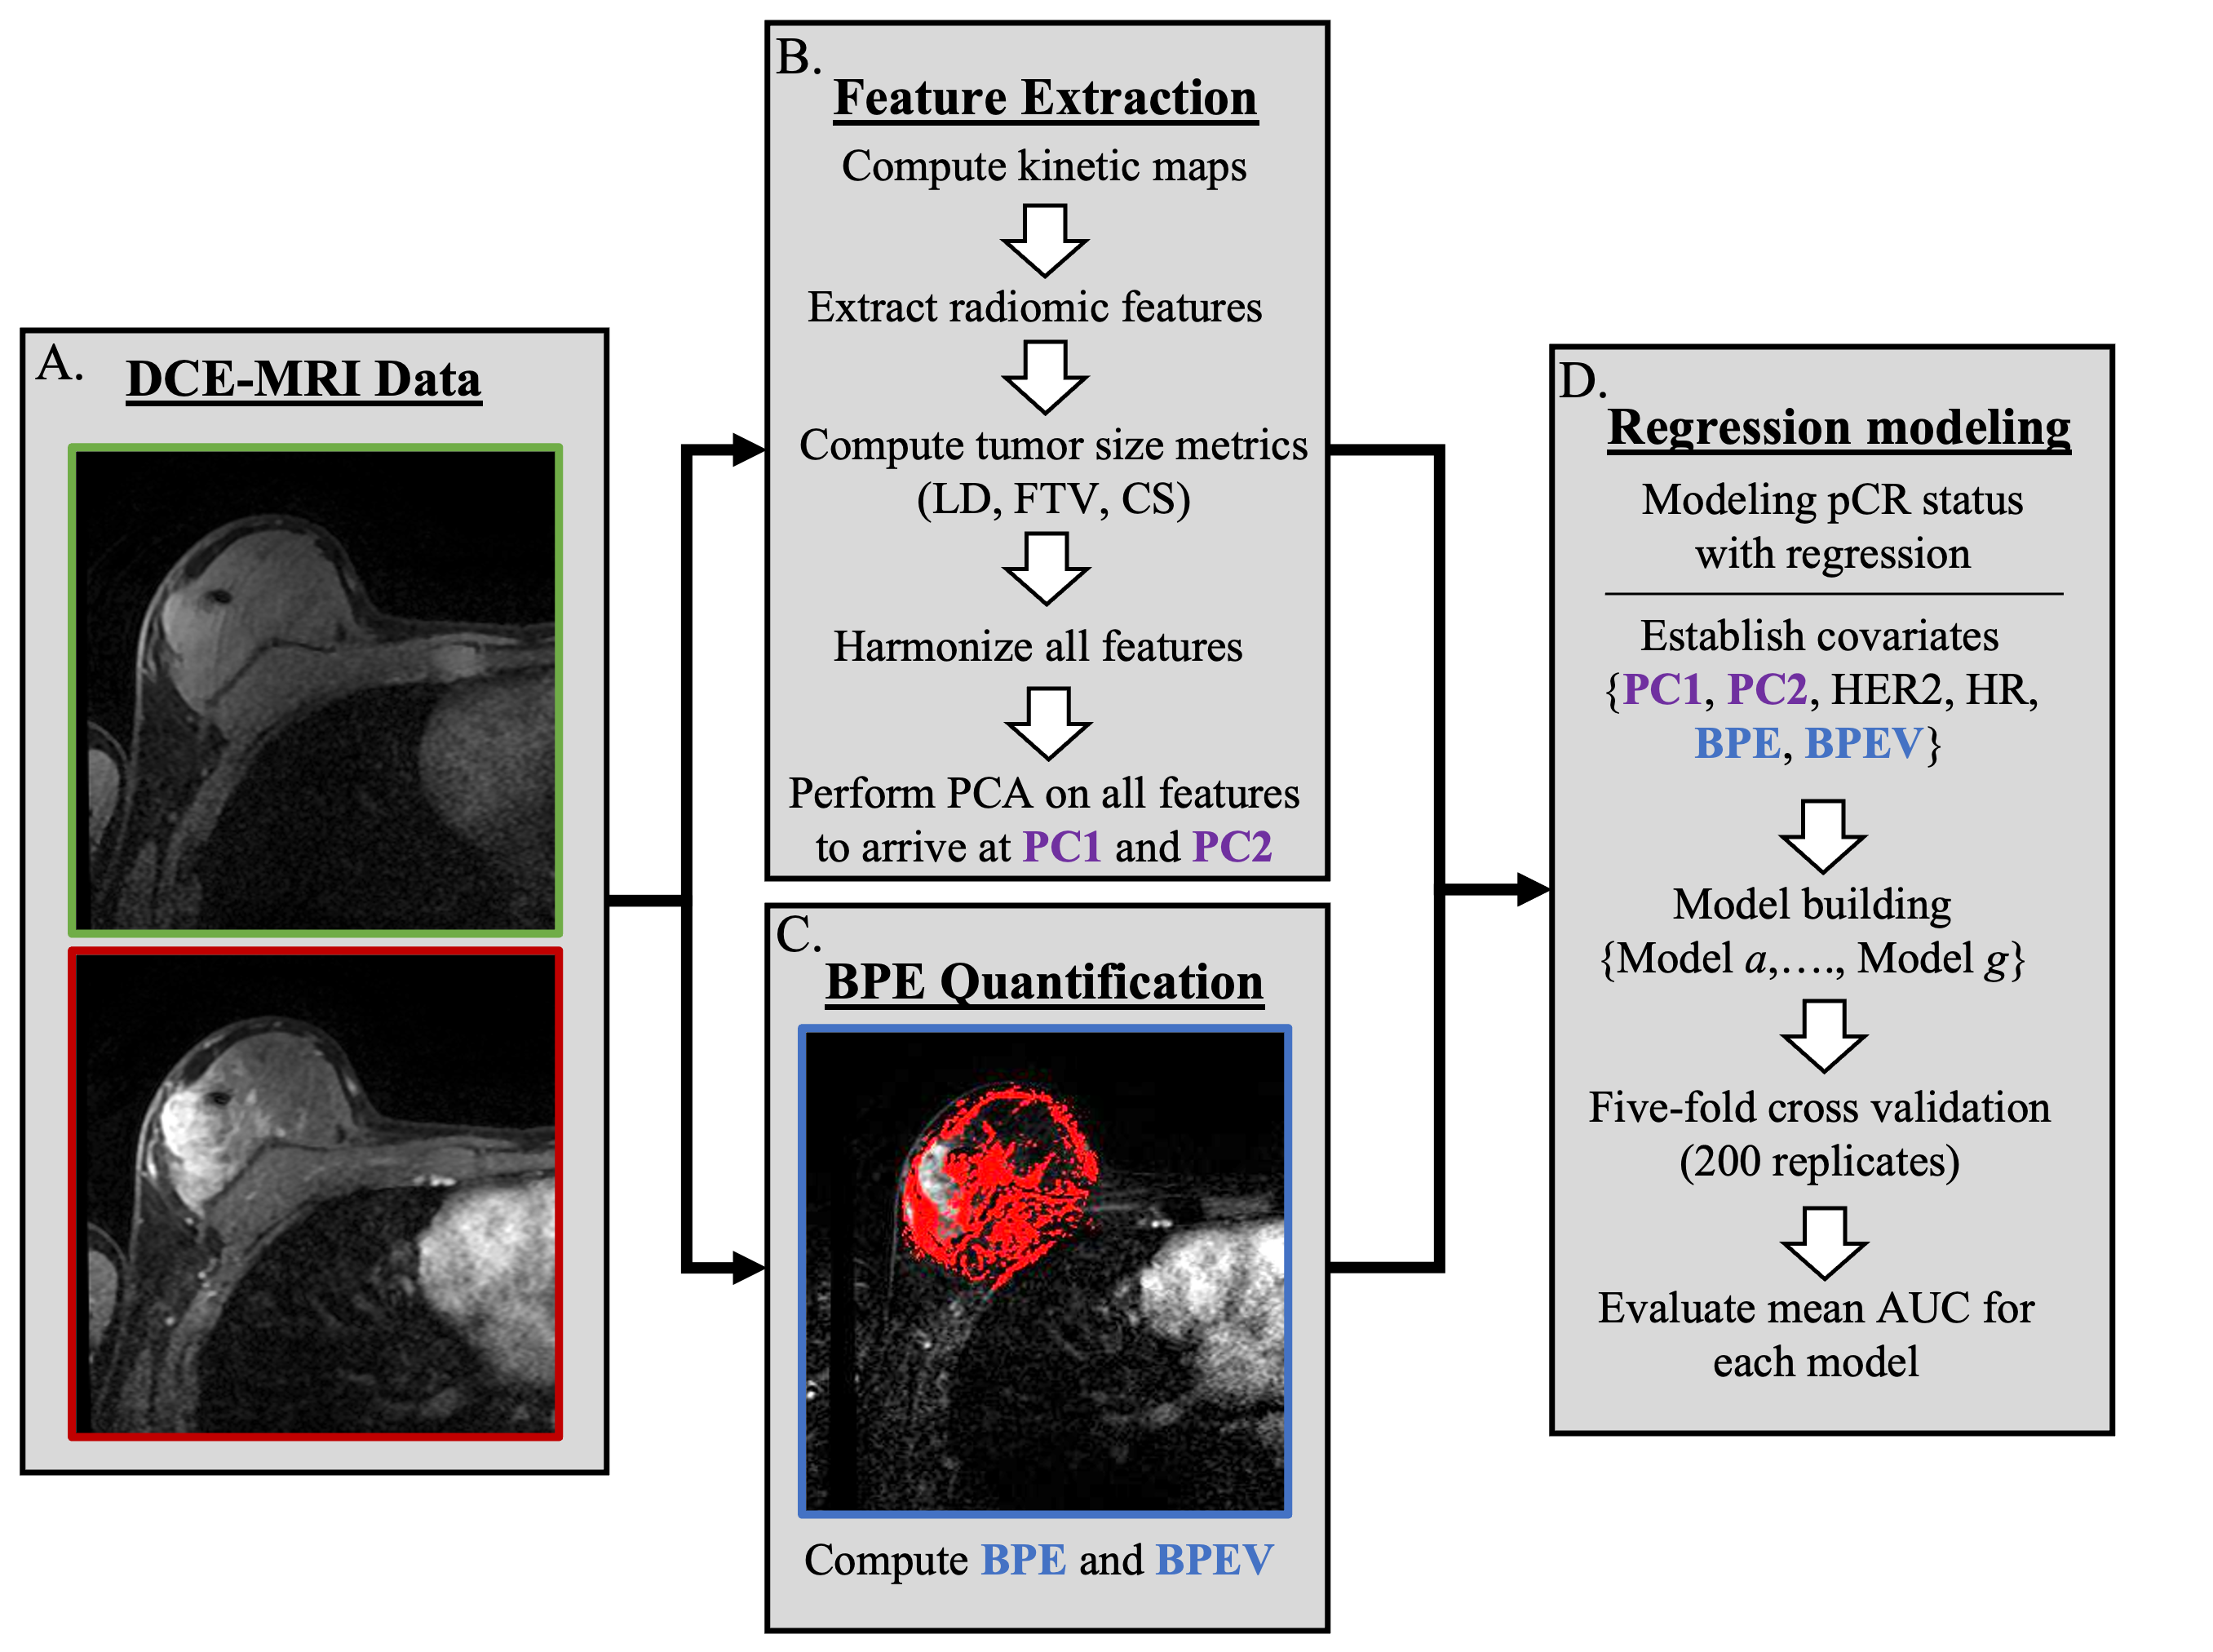
Figure 1. Proposed prediction pipeline. (A) The pre- and post-contrast images from the DCE-MRI series are collected and preprocessed. (B) Four kinetic maps are computed from the DCE-MRI data, and radiomic features are extracted using the CaPTk software. (C) The median BPE value for the ipsilateral breast is computed from the precontrast and first postcontrast phase from the DCE-MRI series. (D) Two principal components (PC1 and PC2) are computed from the final radiomic features and included as covariates along with BPE measures (mBPE and vBPE) in a series of regression models.
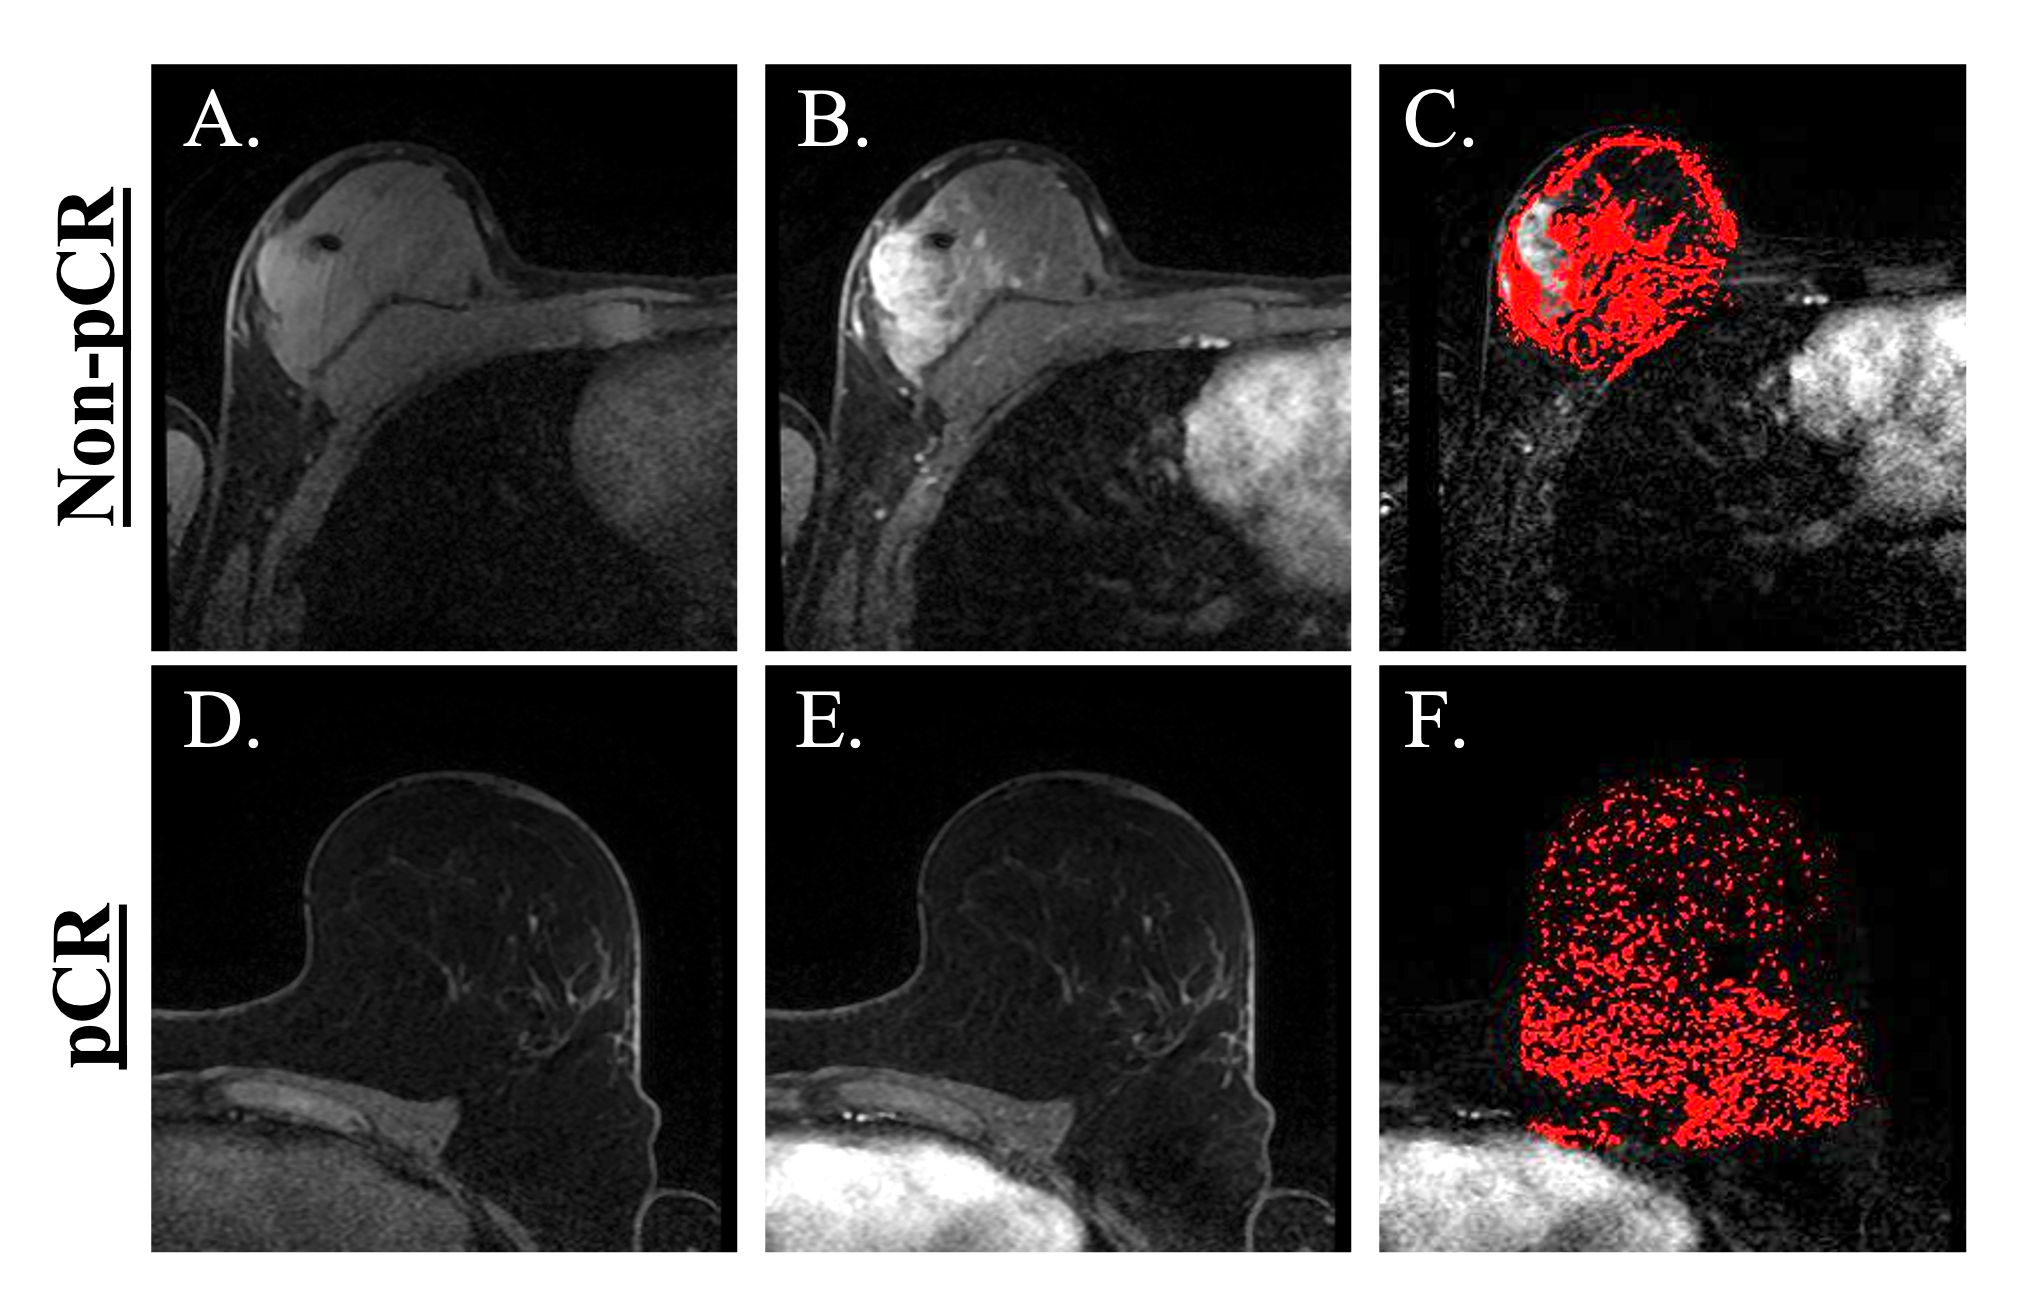
Figure 2. Imaging data and BPE for non-PCR and pCR example datasets. (A)-(C) From left to right, these panels display the precontrast, first postcontrast phase, and BPE volume map of a subject with a non-pCR outcome. (D)-(F) These images are analogous to those in the preceding three panels but instead correspond to a patient that had a pCR outcome. (F) shows more diffuse BPE compared to (C).
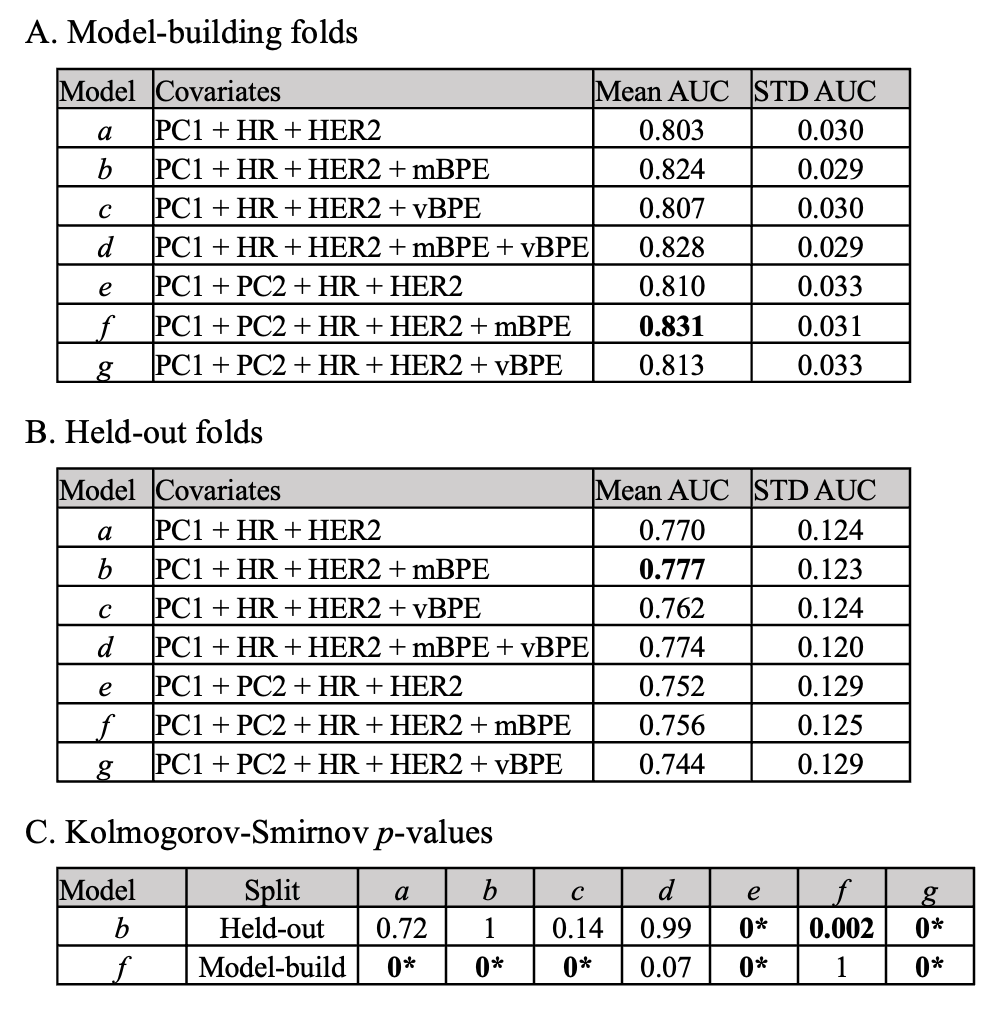
Figure 3. Tables reporting model performance. (A) The performance of the models for cases within the model-building folds are evaluated using the mean AUC across all 200 replicates (and standard deviation as STD). The highest AUC value (bolded) corresponds to Model f, which includes mBPE along with four other covariates. (B) The performance of the four models on the held-out folds are similarly reported, where Model b outperforms the others. (C) The Kolmogorov-Smirnov was used to assess differences in the AUC distributions across all replicates between models. (*) indicates p<10-4.
DOI: https://doi.org/10.58530/2023/1212