1210
Implementation of dissolved 129Xe lung MRI with 4-echo 3D radial spectroscopic imaging at 3T: comparing with results at 1.5T in healthy volunteers1POLARIS, University of Sheffield, Sheffield, United Kingdom, 2GE Healthcare, Munich, Germany
Synopsis
Keywords: Lung, Hyperpolarized MR (Gas)
Four-echo 3D radial spectroscopic imaging of hyperpolarised 129Xe in the lung is implemented at 3T to measure ratios of xenon gas and dissolved xenon in blood (RBC) and lung tissues (M). Thanks to an interleaved acquisition of the echo times and the choice of a 0.32ms echo time spacing, data acquisition is possible within the short relaxation time of dissolved 129Xe (T2*~1ms). 11 healthy volunteers have been imaged at both 1.5 and 3T after the inhalation of a 1L dose of hyperpolarised 129Xe. Results show comparable images at both field strengths and a significantly reduced (p=0.02) RBC:M at 3T.Introduction
Due to the large chemical shift separation of 129Xe gas in the alveolar airspace and when dissolved in lung membrane (M) and red blood cells (RBC), images of gas transfer can be obtained by calculating ratio maps of 129Xe signal in the different compartments using MR spectroscopic imaging. Derived metrics have shown sensitivity to regional gas transfer limitation and disease progression in interstitial and obstructive lung diseases (1-3). Several different imaging techniques have been implemented for this purpose, including; CSI, 1-point Dixon (4) and multi echo imaging techniques (5,6). While CSI and 1-point Dixon have been successfully implemented at both 1.5 and 3T (7), the short transverse relaxation time (T2*) of dissolved 129Xe in the lung at 3T (~1ms) makes implementing a multi echo imaging technique at 3T challenging. In this work, a 3T implementation of the 4-echo 3D radial spectroscopic imaging technique previously developed at 1.5T (8) was tested in healthy volunteers and differences between the main outcome metrics at 1.5T and 3T were evaluated.Methods
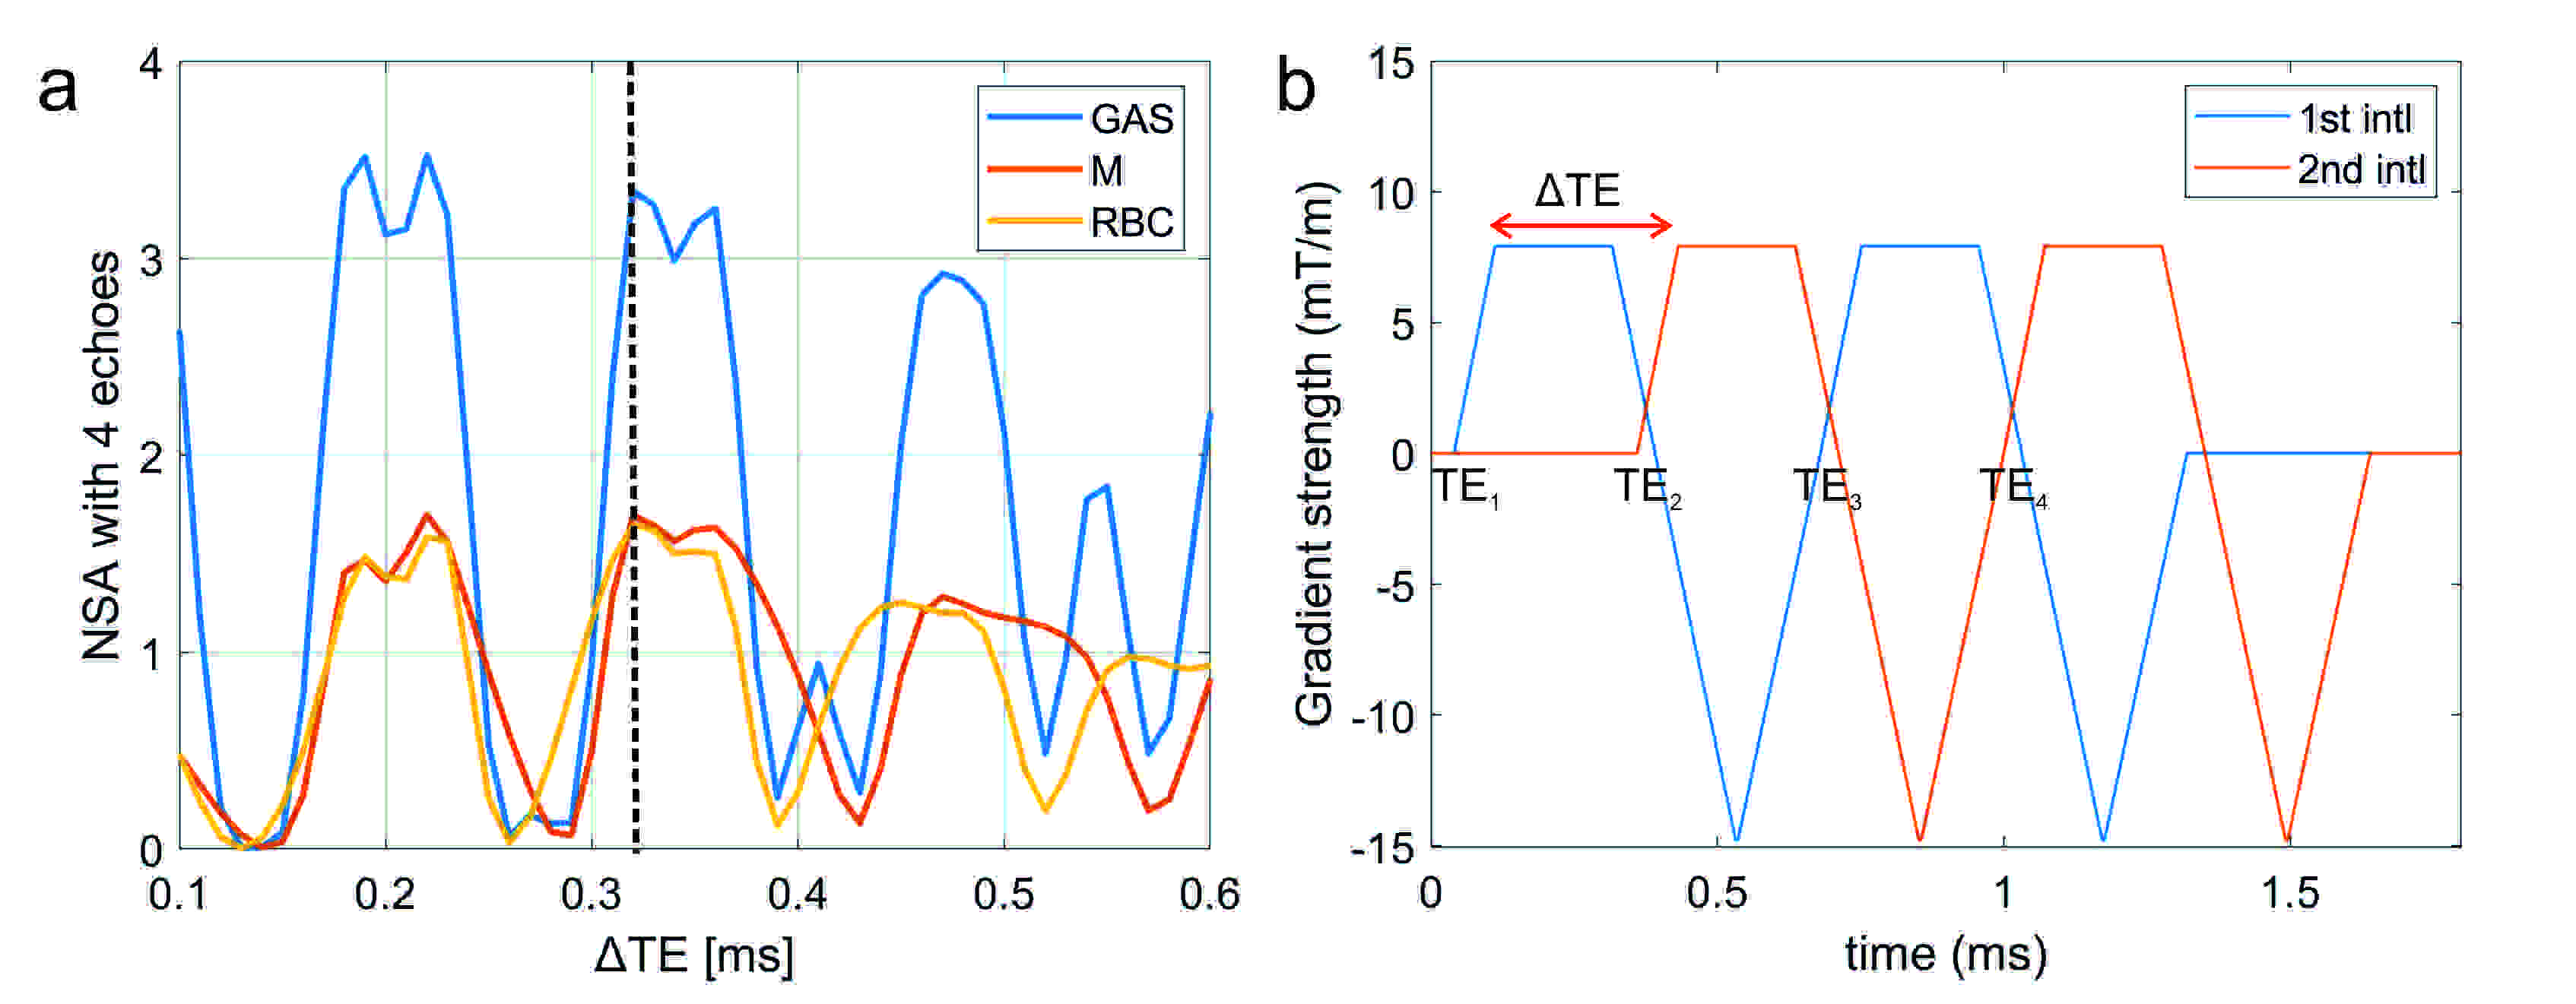
11 healthy volunteers with no known respiratory conditions were recruited. Imaging was performed on 1.5T GE HDx and 3T GE PET/MR Signa scanners with 129Xe polarized to ~30% with a spin-exchange optical pumping polariser (POLARIS, Sheffield, UK) (9). Images were acquired with flexible quadrature transmit/receive vest coils during breath-hold after the inhalation of 1L of HP 129Xe from FRC. To account for the ~2x shorter T2* of dissolved xenon at 3T, the 4-echo flyback 3D radial spectroscopic imaging technique (8) was adapted to acquire 4 different echo times within ~1.3ms. After deriving the optimal echo time separations using the number of signal averages (NSA), the following sequence changes were implemented:(i) a ΔTE of 0.32ms was chosen to optimise SNR (see Fig. 1.a)
(ii) an interleaved implementation of the acquisition of the odd and even echo times (see Fig. 1.b). This is because it is impossible to acquire 4 echo times after each RF pulse with the desired resolution and echo time spacing. This change resulted in a decrease in number of radial projections (see Table 1).
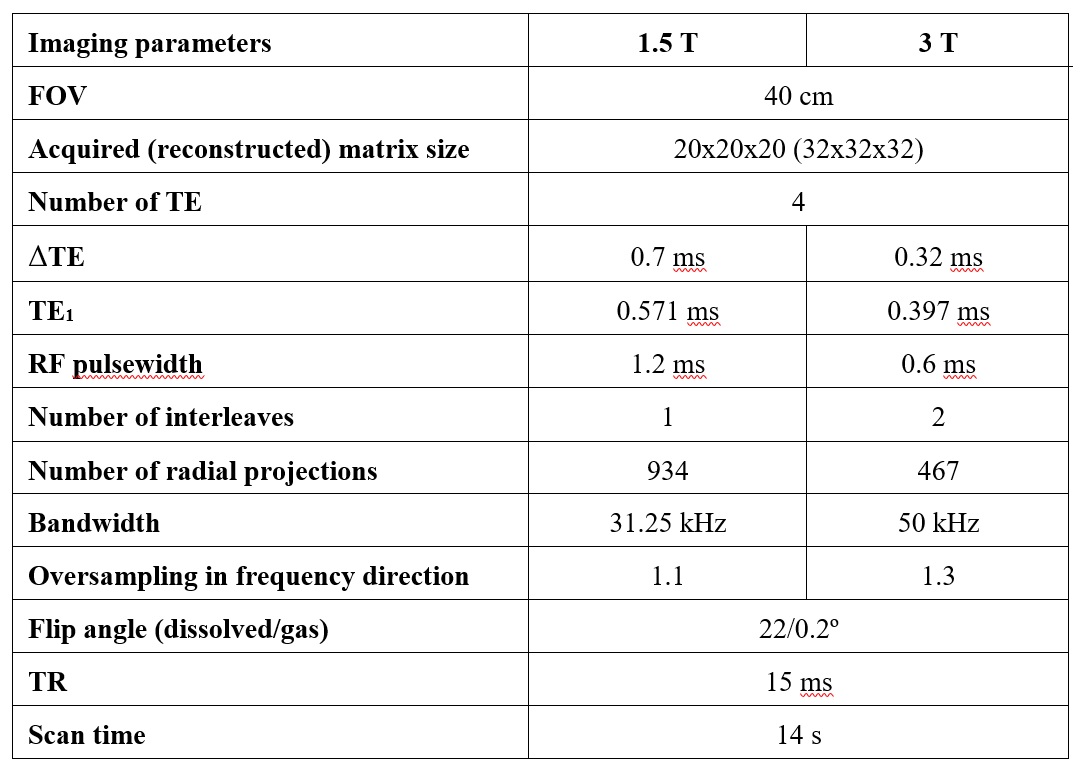
(iii) the frequency-tailored RF excitation designed to deliver flip angles on 129Xe gas and dissolved-phase 129Xe of 0.2 degrees and 22 degrees, respectively at 1.5T was implemented on the 3T scanner after halving its duration to 0.6ms. With an isodelay of 0.15ms at 3T, the RF pulse allows an approximate first echo time TE1 ~0.4ms due to hardware gradient delays. A summary of the imaging parameters is available in Table 1. Data were analysed as previously described (6). Briefly, the chemical shift and T2*values for each xenon resonance and the amplitude of the cardiogenic oscillation of the RBC signal (ARBCCO) (10) were derived, and ratio maps (RBC:M, RBC:GAS, M:GAS) were calculated. Wilcoxon paired t-tests were performed to study the differences between imaging markers at 1.5 and 3T.
Results
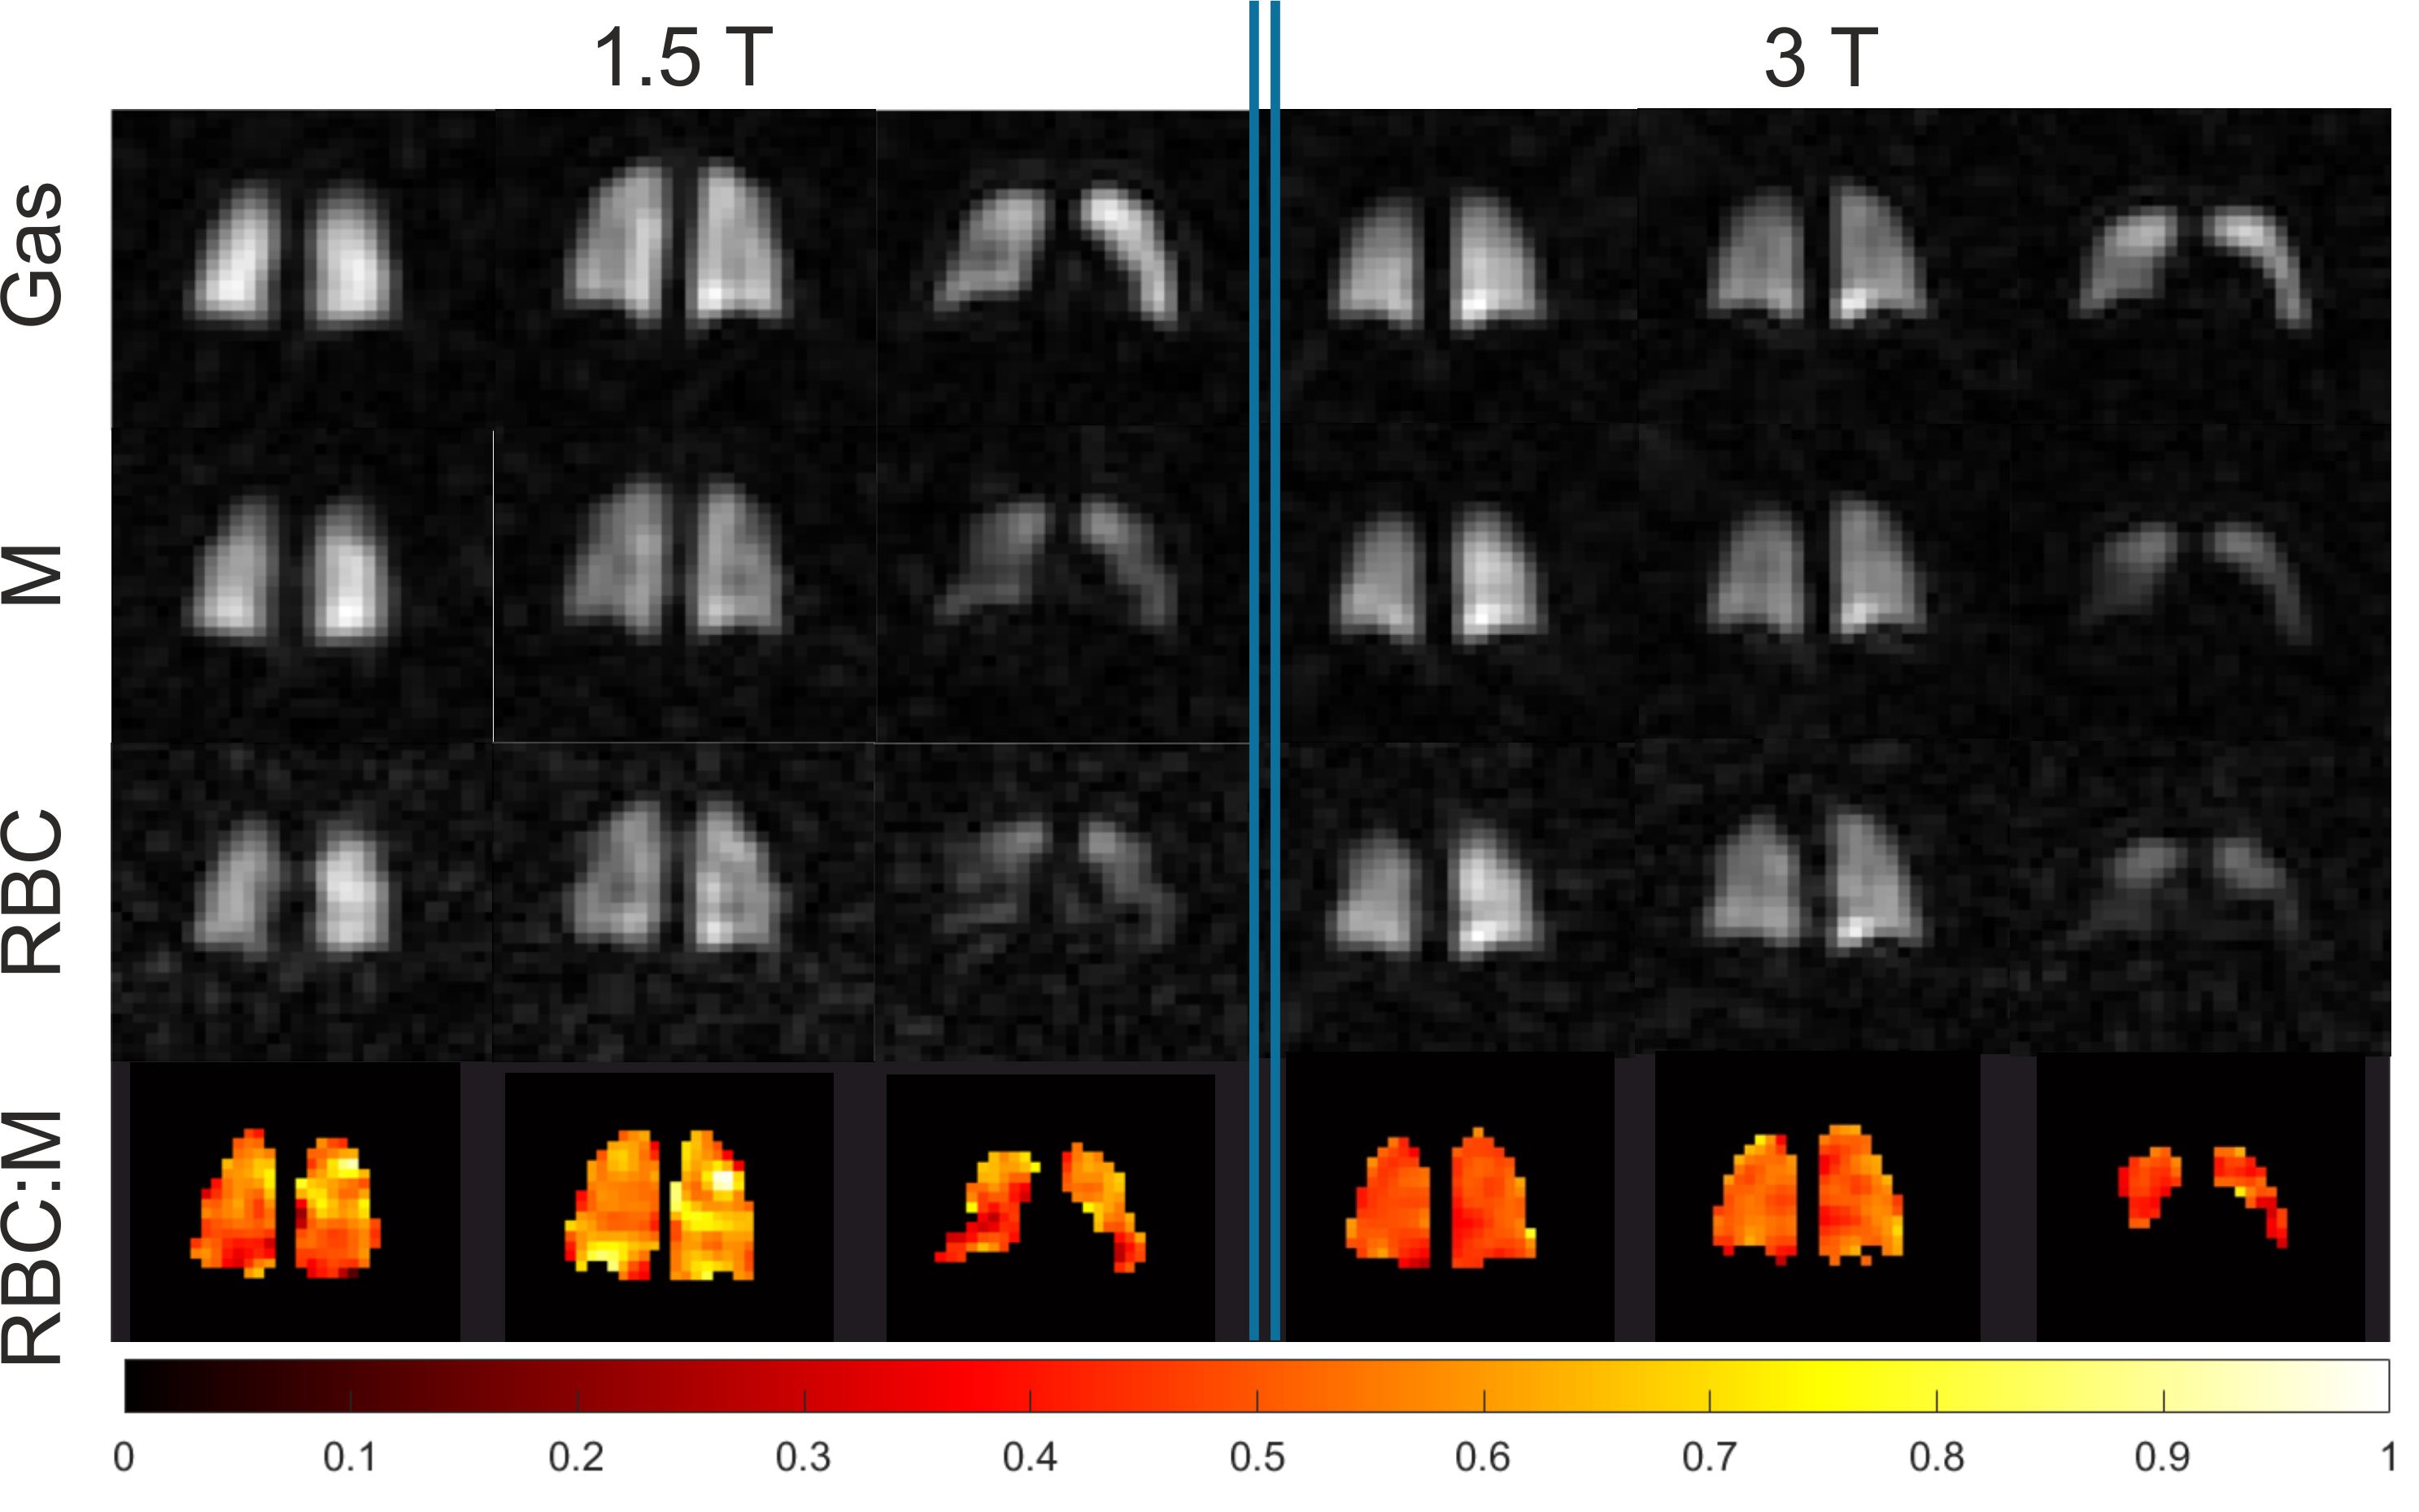
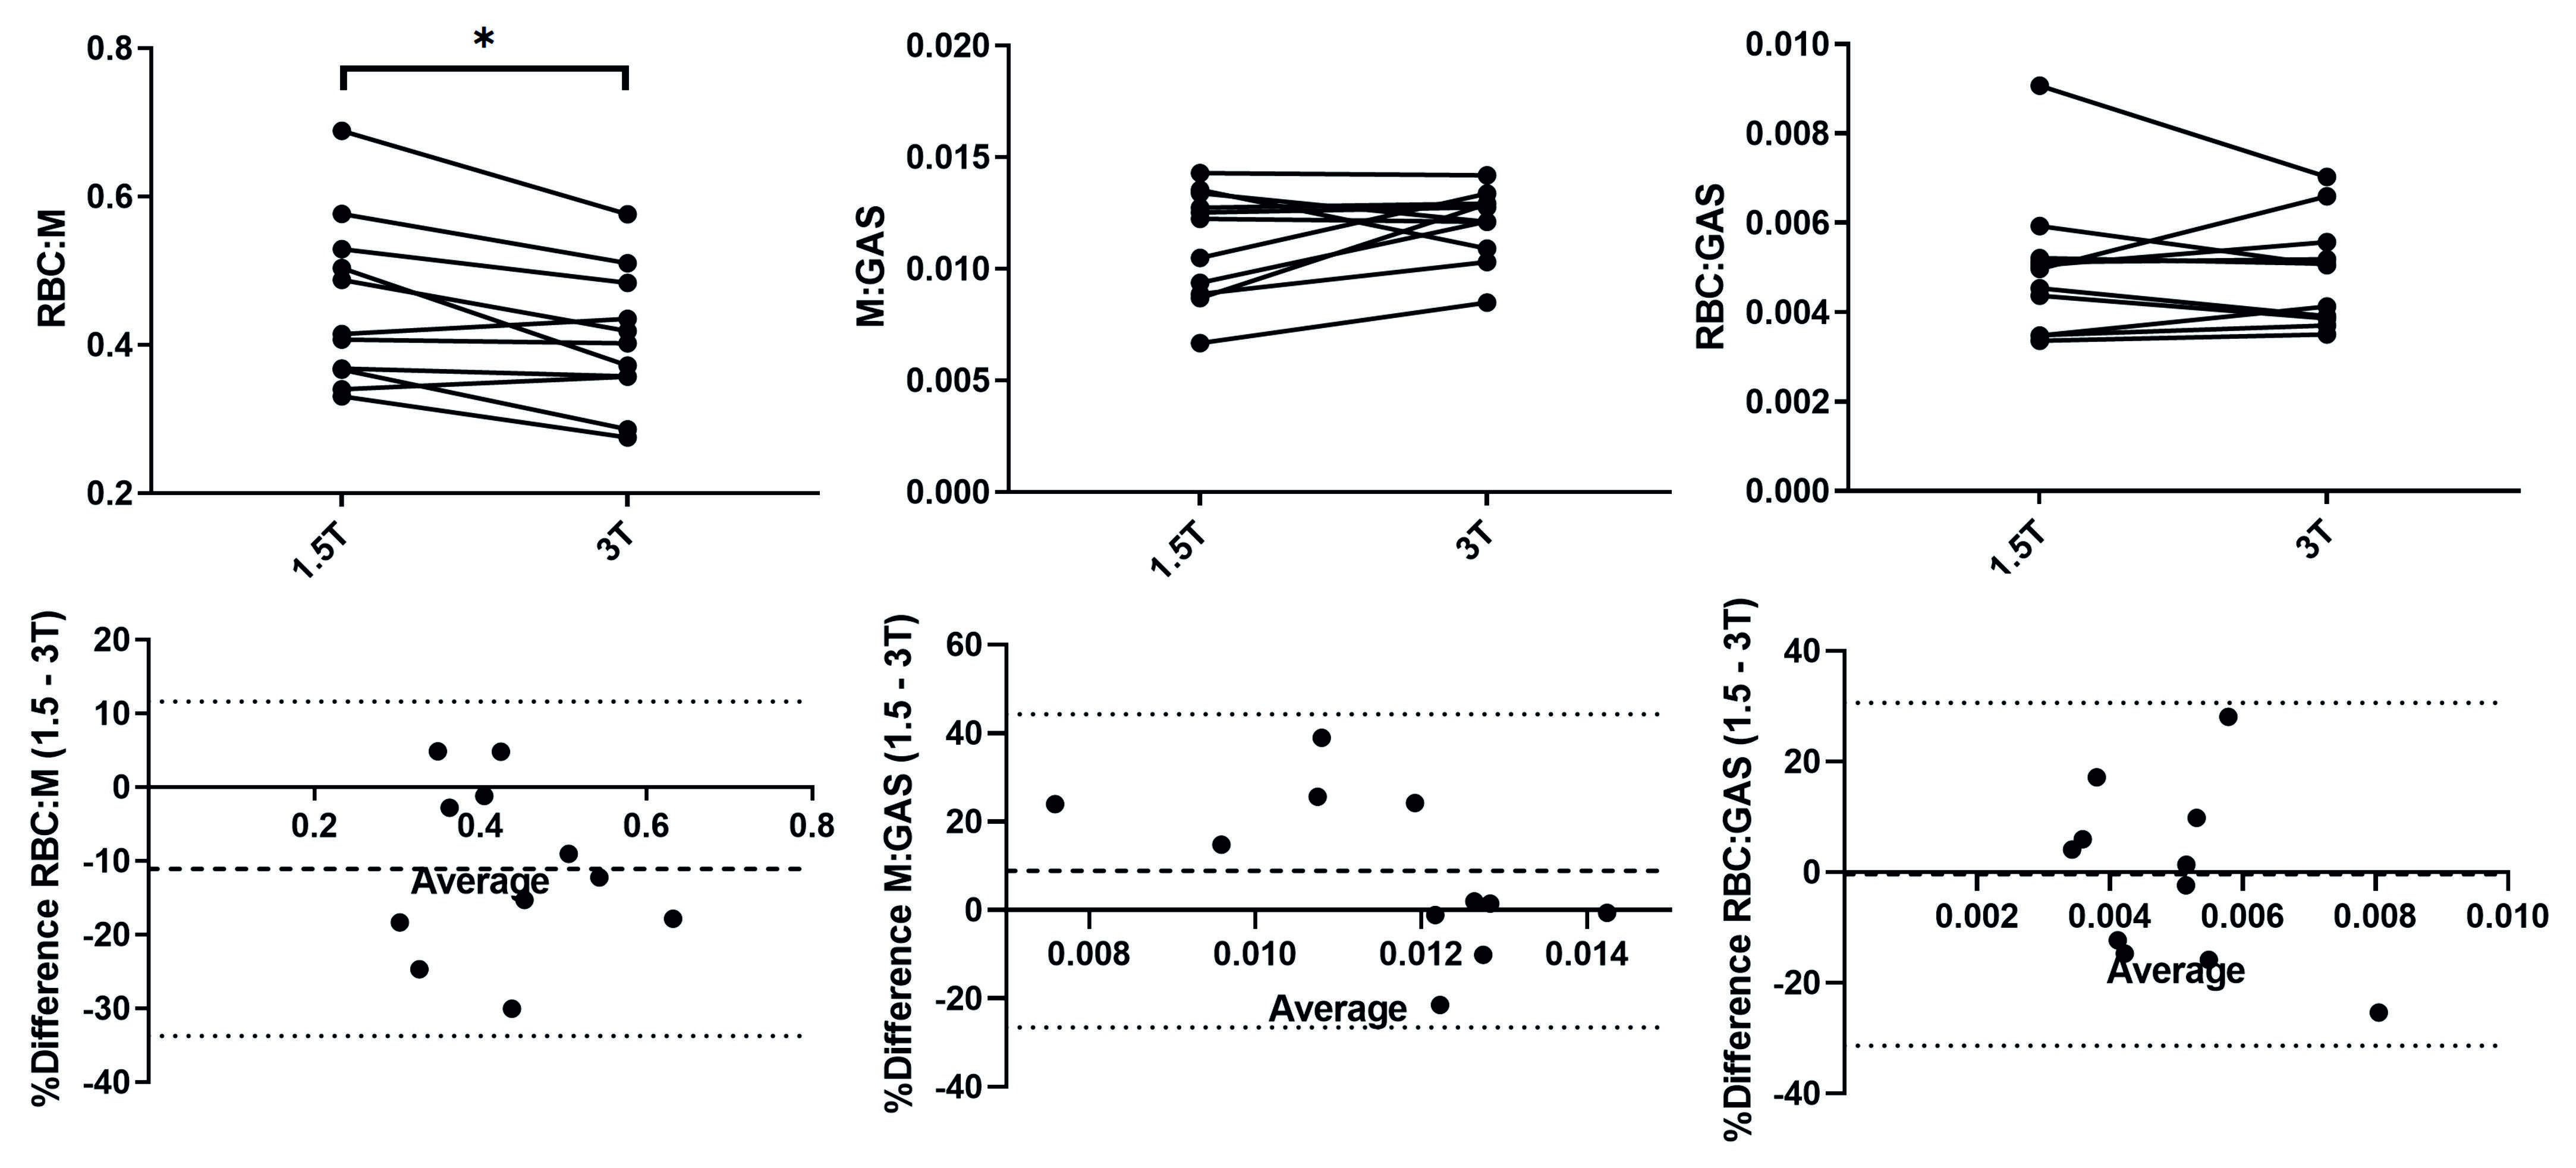
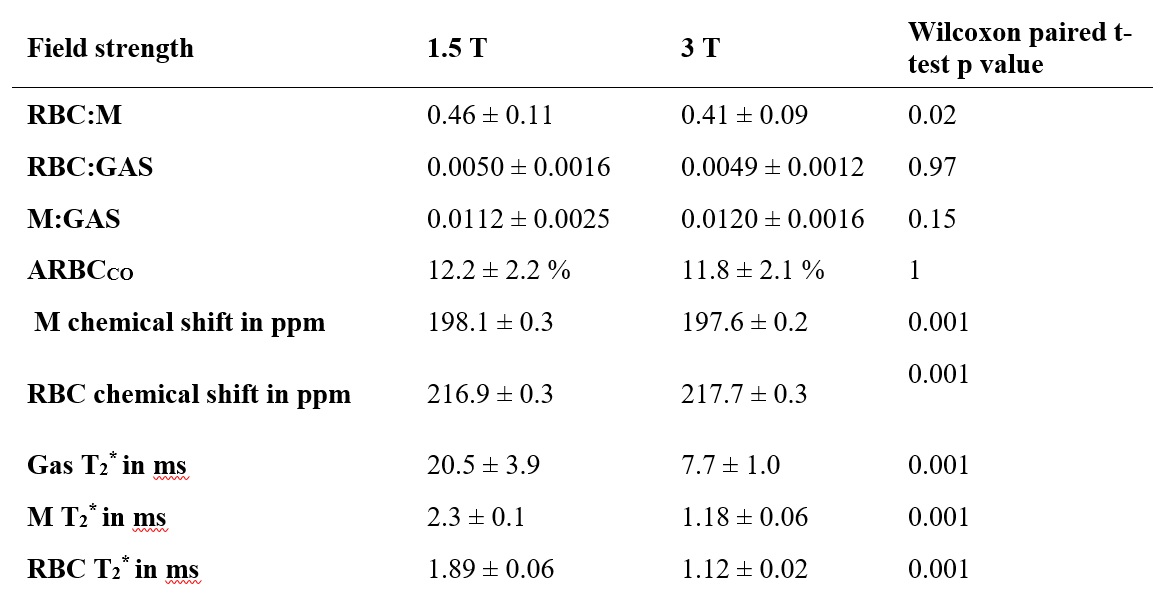
Averaged global imaging markers obtained at both field strengths are summarized in Table 2. Example images and an RBC:M map acquired in the same healthy volunteer at 1.5 and 3T are displayed in Fig.2. Line plots and Bland-Altman graphs are shown in Fig.3 for the global 129Xe gas exchange ratios. T2* values were 62.5%, 48.5% and 41% lower on average at 3T for gas, M and RBC, respectively. RBC:GAS and ARBCCO were not different between field strengths. M:GAS was also not significantly different, although the Bland-Altman (Fig.3) showed a bias of 7% higher M:GAS at 3T. However, RBC:M was significantly lower at 3T compared to 1.5T with a mean bias of -9%.Discussion
The 3T implementation of the 4-echo 3D radial spectroscopic imaging technique, adapted from that previously developed for 1.5T, was successful with images showing similar quality at both field strengths. The main challenge of shorter dissolved 129Xe T2* has been mitigated using a shorter RF pulse and a shorter echo time spacing at the expense of increased radial undersampling. However, all images obtained were free of radial undersampling artefact. The significantly lower RBC:M ratio, but constant RBC:GAS, observed at 3T compared to 1.5T suggests that the dissolved xenon in the membrane compartment is higher at 3T. The origin of this observation may be complex and not driven by physiology. While T2* values are drastically shorter at 3T, the reported ratios in this work were corrected for these changes in T2* and echo times by calculating transverse relaxation times during the acquisition. Ratios are therefore expected to be independent of T2* and k-space trajectory. Possible hypotheses are an unequal effect of higher magnetic susceptibility on gas and dissolved xenon signals at 3T and the fact that the RBC and M peaks are less spectrally separated at 1.5T, compared to 3T. Further work is required to confirm this hypothesis (e.g. measuring ratios via spectroscopy measurement) but results suggest that a correction factor should be applied when comparing dissolved xenon imaging results acquired at 1.5 and 3T.Conclusion
Dissolved xenon imaging with 4-echo radial spectroscopic imaging has been successfully implemented at 3T. Results show a significantly lower RBC:M ratio at 3T, suggesting that a correction factor at this field strength is required.Acknowledgements
This work was supported by MRC grant MR/M008894/1References
1. Wang JM, Robertson SH, Wang Z, He M, Virgincar RS, Schrank GM, Smigla RM, O'Riordan TG, Sundy J, Ebner L, Rackley CR, McAdams P, Driehuys B. Using hyperpolarized 129Xe MRI to quantify regional gas transfer in idiopathic pulmonary fibrosis. Thorax 2018;73(1):21-28.
2. Weatherley ND, Stewart NJ, Chan HF, Austin M, Smith LJ, Collier G, Rao M, Marshall H, Norquay G, Renshaw SA, Bianchi SM, Wild JM. Hyperpolarised xenon magnetic resonance spectroscopy for the longitudinal assessment of changes in gas diffusion in IPF. Thorax 2019;74(5):500-502.
3. Qing K, Tustison NJ, Mugler JP, 3rd, Mata JF, Lin Z, Zhao L, Wang D, Feng X, Shin JY, Callahan SJ, Bergman MP, Ruppert K, Altes TA, Cassani JM, Shim YM. Probing Changes in Lung Physiology in COPD Using CT, Perfusion MRI, and Hyperpolarized Xenon-129 MRI. Acad Radiol 2019;26(3):326-334.
4. Kaushik SS, Robertson SH, Freeman MS, He M, Kelly KT, Roos JE, Rackley CR, Foster WM, McAdams HP, Driehuys B. Single-breath clinical imaging of hyperpolarized (129)Xe in the airspaces, barrier, and red blood cells using an interleaved 3D radial 1-point Dixon acquisition. Magn Reson Med 2016;75(4):1434-1443.
5. Qing K, Ruppert K, Jiang Y, Mata JF, Miller GW, Shim YM, Wang C, Ruset IC, Hersman FW, Altes TA, Mugler JP, 3rd. Regional mapping of gas uptake by blood and tissue in the human lung using hyperpolarized xenon-129 MRI. J Magn Reson Imaging 2014;39(2):346-359.
6. Collier GJ, Eaden JA, Hughes PJC, Bianchi SM, Stewart NJ, Weatherley ND, Norquay G, Schulte RF, Wild JM. Dissolved (129) Xe lung MRI with four-echo 3D radial spectroscopic imaging: Quantification of regional gas transfer in idiopathic pulmonary fibrosis. Magn Reson Med 2021;85(5):2622-2633.
7. Wang Z, He M, Bier E, Rankine L, Schrank G, Rajagopal S, Huang YC, Kelsey C, Womack S, Mammarappallil J, Driehuys B. Hyperpolarized (129) Xe gas transfer MRI: the transition from 1.5T to 3T. Magn Reson Med 2018;80(6):2374-2383.
8. Saunders LC, Collier GJ, Chan H-F, Hughes PJC, Smith LJ, Watson J, Meiring J, Gabriel Z, Newman T, Plowright M, Wade P, Eaden JA, Bray J, Marshall H, Capener DJ, Armstrong L, Rodgers J, Brook M, Biancardi AM, Rao MR, Norquay G, Rodgers O, Munro R, Ball JE, Stewart NJ, Lawrie A, Jenkins G, Grist J, Gleeson F, Schulte RF, Johnson KM, Wilson F, Cahn A, Swift AJ, Rajaram S, Mills GH, Watson L, Collini PJ, Lawson R, Thompson AAR, Wild JM. Longitudinal lung function assessment of patients hospitalised with COVID-19 using <sup>1</sup>H and <sup>129</sup>Xe lung MRI. medRxiv 2022:2022.2004.2006.22272747.
9. Norquay G, Collier GJ, Rao M, Stewart NJ, Wild JM. 129Xe-Rb Spin-Exchange Optical Pumping with High Photon Efficiency. Physical Review Letters 2018;121(15):153201.
10. Bier EA, Robertson SH, Schrank GM, Rackley C, Mammarappallil JG, Rajagopal S, McAdams HP, Driehuys B. A protocol for quantifying cardiogenic oscillations in dynamic (129) Xe gas exchange spectroscopy: The effects of idiopathic pulmonary fibrosis. NMR Biomed 2019;32(1):e4029.
Figures