1209
Lung perfusion imaging: influence of signal-to-concentration transformation method and comparison with 129Xe biomarkers1Bioxydyn Ltd, Manchester, United Kingdom, 2POLARIS, University of Sheffield MRI unit, The University of Sheffield, Sheffield, United Kingdom, 3MCMR, Manchester University NHS Foundation Trust, Wythenshawe, United Kingdom, 4POLARIS, The University of Sheffield, Sheffield, United Kingdom, 5Centre for Imaging Sciences, University of Manchester, Manchester, United Kingdom, 6Academic Department of Respiratory Medicine, Sheffield Teaching Hospitals NHS Foundation Trust, Sheffield, United Kingdom, 7Insigneo Insititute for in silico medicine, Sheffield, United Kingdom, 8Centre for Medical Image Computing, Department of Medical Physics and Biomedical Engineering, University College London, London, United Kingdom
Synopsis
Keywords: Lung, Perfusion
Quantitative pulmonary perfusion can be derived from MR imaging with injection of contrast agent (CA). Tracer-kinetic theory yields physiological parameters such as pulmonary blood flow (PBF), blood volume (PBV) and mean transit time (MTT) but relies on accurate calculation of CA concentration. Previous studies have used ‘subtraction’ or ‘normalisation’ methods without T1-mapping. Using both simulations and data from interstitial lung disease patients, we demonstrate how the ‘subtraction’ method weights PBV by local lung density. This causes likely spurious correlations with hyperpolarised 129Xe biomarkers linked to lung ventilation, microstructure and density, potentially obscuring information of diagnostic interest.
Introduction
Quantitative pulmonary perfusion can be derived from MRI with injection of gadolinium-based contrast agent (CA) and a high temporal resolution dynamic T1-weighted imaging series. Tracer-kinetic theory yields physiological parameters such as pulmonary blood flow (PBF), blood volume (PBV) and mean transit time (MTT)1. These rely on accurate calculation of CA concentration from the MR signal. Previous studies have used ‘subtraction’ or ‘normalisation’ methods without T1-mapping.We investigated how the signal-to-concentration conversion method affects results through simulations and we show how the ‘subtraction’ results are dependent on lung density. Data from interstitial lung disease (ILD) patients were also analysed and results compared with 129Xe imaging-derived biomarkers of ventilation, microstructure, and gas transfer to demonstrate how the ‘subtraction’ method may give rise to spurious correlations with non-perfusion biomarkers.
Methods
The following CA estimation methods were considered:a) Subtraction2: Csub(t) = S(t) - S(t=0), where S(t=0) is the average of signal before the CA arrival;
b) Normalization3: Cnorm(t) = (S(t) - S(t=0)) / S(t=0);
c) T1-based: CT1(t) = (1/T1(t) - 1/T1,0) Rgd, where T1,0 is the voxel baseline T1, Rgd is the relaxivity of contrast agent (here 3.89 s-1 mM-1 3).
Simulations
The arterial CA concentration (arterial input function, AIF) was simulated as a gamma variate function4 (eq 1): $$C_a(t)=\begin{cases}0&t<t_{start}\\ a\times( \frac{\mathrm{t-t_{start}} }{\mathrm{t_p}} )^b \times e^{-\frac{\mathrm{t-t_{start}} }{\mathrm{t_p}}}&t\geq t_{start}\end{cases}$$where a, b, tstart and tp control the curve maximum value of the curve, its shape, the curve starting timepoint, and the time between tstart and the curve maximum, respectively. Values of tp=2 s, b=4, tstart=10 s, and a=5 mM were chosen. Indicator dilution theory was used to simulate parenchymal time courses5 (eq 2): $$C(t)=F(C_a(t)\ast R(t))$$ where F is the parenchymal blood flow, R(t) is the residue function and $$$\ast$$$ indicates a convolution operation. The residue function was defined as6 (eq 3): $$ R(t)=e^{\frac{t }{MTT}}$$
CA concentration was converted to MR signal using the standard SPGR equation (TR=2 ms, flip angle $$$\alpha$$$=20 deg). Lung M0 was defined as a fraction of blood M0: M0_ratio=M0_lung/M0_blood. Lung T1 was fixed at 1196 ms7, and blood T1 at 1480 ms8. No noise or delays were considered.
PBV was calculated as (eq 4): $$PBV=\frac{\intop\nolimits_{0}^{\infty}C_{lung}(t)dt}{\intop\nolimits_{0}^{\infty }C_{a}(t)dt}$$
PBV calculated from CA concentration estimated using the subtraction method (PBVsub) is linearly dependent on M0_ratio (voxel tissue density), which varies during the respiratory cycle and due to lung pathology. PBVsub can therefore be divided by M0_ratio to avoid this effect and obtain PBVsub_corr. PBV estimates by the normalization method (PBVnorm) and by the T1-based method (PBVT1) do not suffer from this issue. Similar considerations apply to PBF but not MTT.
The variation of PBV given an AIF concentration peak varying between 1 and 12 mM was also studied to evaluate the potential impact of signal non-linearity with concentration.
Acquisitions
Imaging was carried out on a 1.5 T GE HDx (GE Healthcare, Milwaukee, WI). Patients with ILD were recruited and gave written informed consent. Hyperpolarised 129Xe imaging was performed to obtain ventilated volume VV%9, mean diffusive length scale LMD and mean ADC10, and red blood cell to tissue/plasma ratio RBC:TP11,12. This was followed by a proton 3D variable flip angle (VFA) acquisition to estimate T1 and M0 and a TRICKS (view sharing) dynamic acquisition during which a bolus of 0.06 mL/kg gadoteric acid (Dotarem, Guerbet, Villepinte, France) was administered. The signal in the lung and AIF were converted into concentration-time curves with the ‘subtraction’, ‘normalization’ and ‘T1-based’ method and fitted with a gamma variate equation (eq 1). PBV was calculated and corrected for the ‘subtraction’ method, with M0_ratio estimated by means of the VFA-derived M0 map, normalising the lung M0 by the average M0 in the AIF ROI.Results
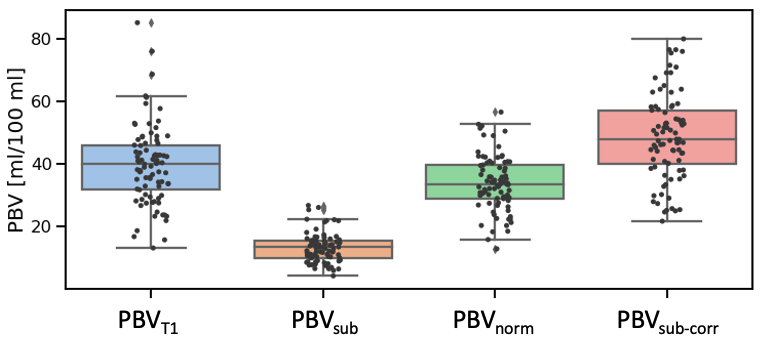
Figure 1 reports the obtained PBV from the simulations with the four methods considered. Figure 2 reports the variation of PBV depending on the AIF peak, which highlights AIF peak value-related bias in the subtraction and normalisation methods.Fifty-four ILD patients were imaged, with seven datasets not analysable. Figure 3 presents example maps in a single subject. PBV averages in the population were PBVT1=39.2 ± 15.1, PBVsub=13.3 ± 5.2, PBVnorm=33.9 ± 10.2, PBVsub_corr=48.4 ± 14.9 ml/100ml (figure 4).
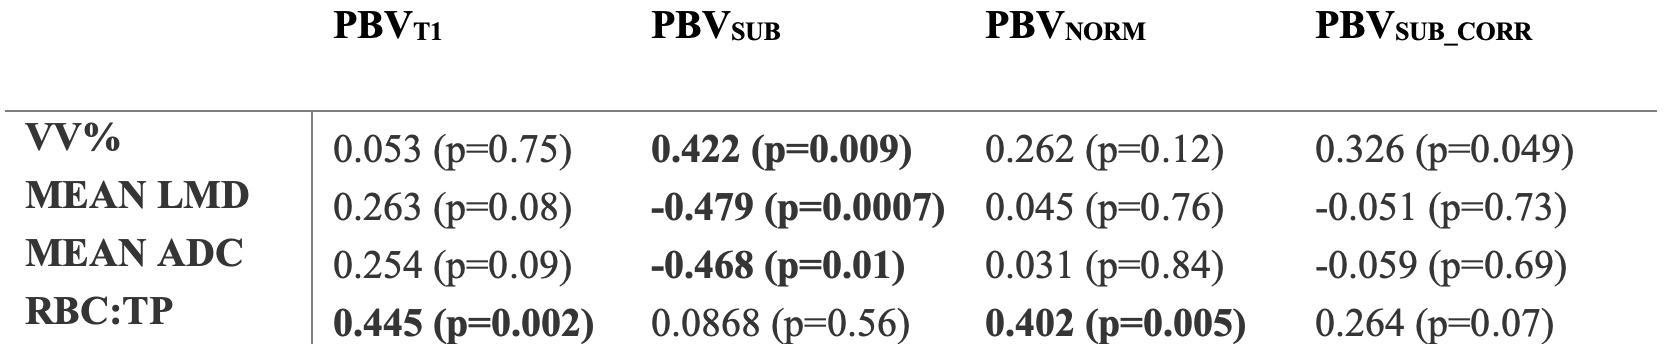
Table 1 presents Pearson’s correlation coefficient between PBV and 129Xe derived biomarkers. PBVsub significantly correlates with VV%, Mean LMD and Mean ADC (all of which are airway markers), but not RBC:TP (a marker of blood volume). After density corrections, no significant correlations are present. PBVT1 and PBVnorm only correlate significantly with RBC:TP.
Discussion
We have shown how the choice of conversion method may influence the extracted PBV, both in simulation and in patient data. The ‘subtraction’ method weights PBV by local lung density causing likelt spurious correlations with imaging biomarkers linked to lung ventilation, microstructure and density (VV%, Mean LMD and Mean ADC), while masking the expected correlation with RBC:TP. This bias confounds interpretation and may potentially obscuring information of diagnostic interest (figure 3). Correction of the subtraction method by lung density eliminates most such correlations but is still biased by the disregarded nonlinearities in the signal conversion.Conclusion
The ‘subtraction’ method should not be used to convert lung MR signal to concentration-time curves in lung perfusion imaging. 'Normalisation' or 'T1 based' methods should be used.Acknowledgements
The research leading to these results received funding from the Innovative Medicines Initiatives 2 Joint Undertaking under grant agreement No 116106. This Joint Undertaking receives support from the European Union’s Horizon 2020 research and innovation programme and EFPIA. This work was also supported by the National Institute of Health Research (RP-R3-12-027), Medical Research Council (MR/M008894/1) and GlaxoSmithKline (PJCH:BIDS3000032592). The views expressed are those of the authors and not necessarily those of the NHS, NIHR, the Department of Health, GlaxoSmithKline nor the TRISTAN consortium.References
1. Sourbron, S. Technical Aspects of MR Perfusion. Eur J Radiol 2010, 76, 304–313, doi:10.1016/j.ejrad.2010.02.017.
2. Schiwek, M., Triphan, S. M., Biederer, J., Weinheimer, O., Eichinger, M., Vogelmeier, C. F., ... & Wielpütz, M. O. (2022). Quantification of pulmonary perfusion abnormalities using DCE-MRI in COPD: comparison with quantitative CT and pulmonary function. European Radiology, 32(3), 1879-1890.
3. Risse F, Kuder TA, Kauczor HU, Semmler W, Fink C. Suppression of pulmonary vasculature in lung perfusion MRI using correlation analysis. Eur Radiol. 2009 Nov;19(11):2569-75. doi: 10.1007/s00330-009-1464-9. Epub 2009 May 27. PMID: 19471936.
4. M T Madsen A Simplified Formulation of the Gamma Variate Function. Physics in Medicine & Biology, 1992, 37, 1597.5. Shen, Y.; Goerner, F.L.; Snyder, C.; Morelli, J.N.; Hao, D.; Hu, D.; Li, X.; Runge, V.M. T1 Relaxivities of Gadolinium-Based Magnetic Resonance Contrast Agents in Human Whole Blood at 1.5, 3, and 7 T. Invest Radiol 2015, 50, 330–338, doi:10.1097/RLI.0000000000000132.
6. Calamante, F.; Gadian, D.G.; Connelly, A. Delay and Dispersion Effects in Dynamic Susceptibility Contrast MRI: Simulations Using Singular Value Decomposition. Magn Reson Med 2000, 44, 466–473, doi:10.1002/1522-2594(200009)44:3<466::aid-mrm18>3.0.co;2-m.
7. Dietrich, O.; Gaass, T.; Reiser, M.F. T1 Relaxation Time Constants, Influence of Oxygen, and the Oxygen Transfer Function of the Human Lung at 1.5 T—A Meta-Analysis. European Journal of Radiology 2017, 86, doi:10.1016/j.ejrad.2016.11.027
8. Zhang, X.; Petersen, E.T.; Ghariq, E.; de Vis, J.B.; Webb, A.G.; Teeuwisse, W.M.; Hendrikse, J.; van Osch, M.J.P. In Vivo Blood T(1) Measurements at 1.5 T, 3 T, and 7 T. Magn Reson Med 2013, 70, 1082–1086, doi:10.1002/mrm.24550.
9. Smith, L.J., et al., Patterns of regional lung physiology in cystic fibrosis using ventilation magnetic resonance imaging and multiple-breath washout. European Respiratory Journal, 2018. 52(5): p. 180082110. Chan, H.F., et al., 3D diffusion‐weighted 129Xe MRI for whole lung morphometry. Magnetic Resonance in Medicine, 2018. 79(6): p. 2986-2995.
11. Collier, G.J., et al., Dissolved 129Xe lung MRI with four‐echo 3D radial spectroscopic imaging: Quantification of regional gas transfer in idiopathic pulmonary fibrosis. Magnetic Resonance in Medicine, 2021. 85(5): p. 2622-2633.
12. Weatherley, N.D., et al., Hyperpolarised xenon magnetic resonance spectroscopy for the longitudinal assessment of changes in gas diffusion in IPF. Thorax, 2019. 74(5): p. 500-502.
Figures
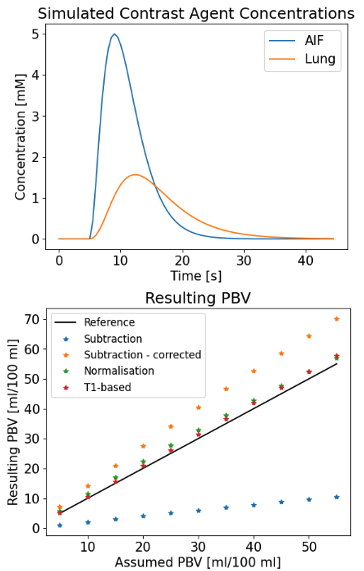
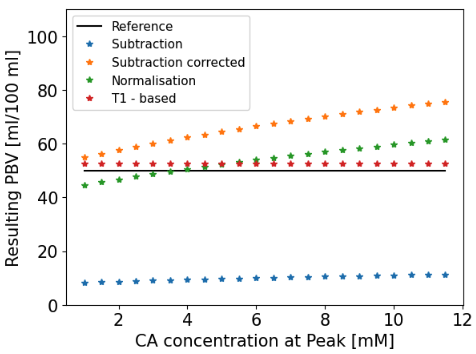
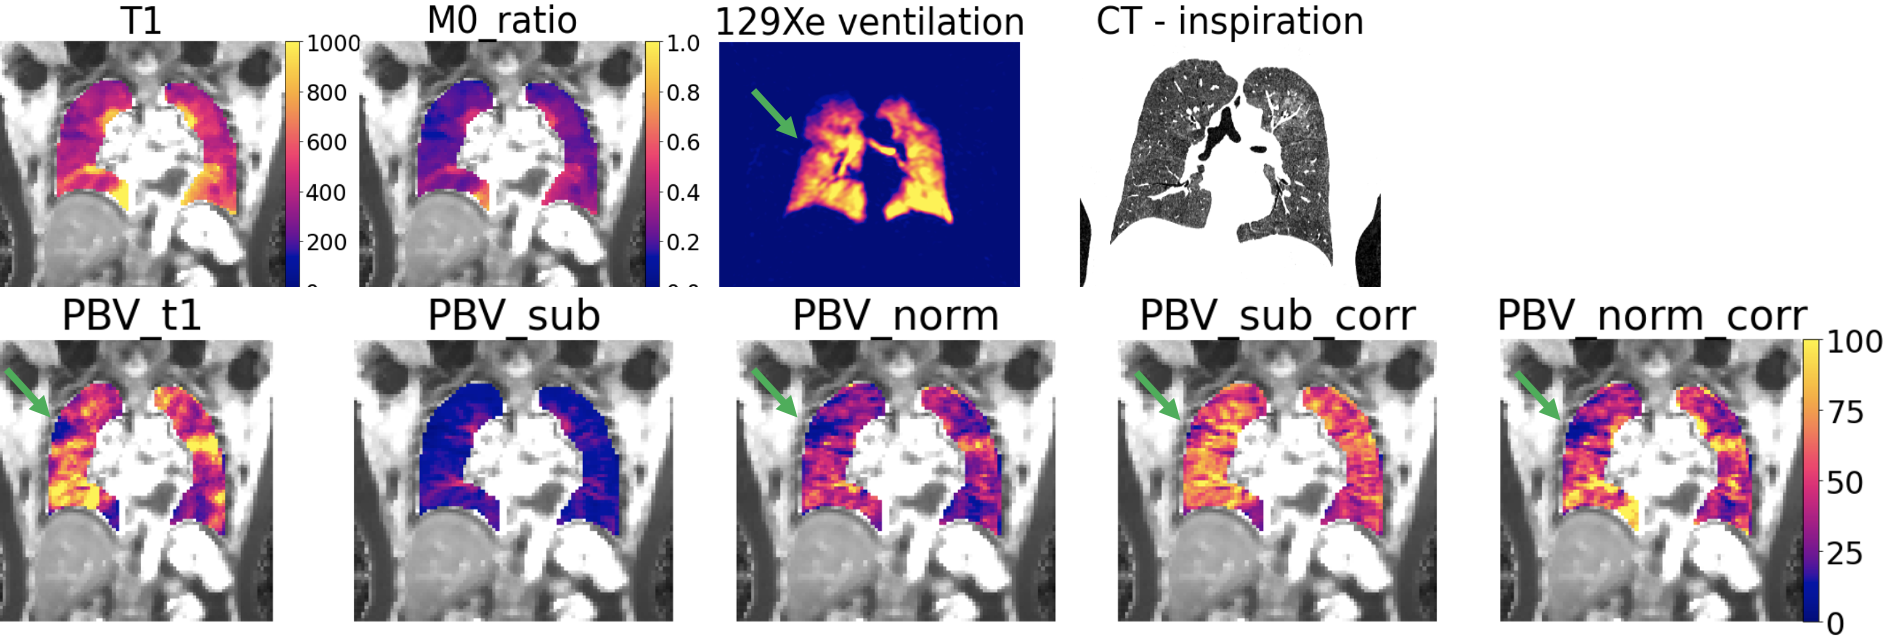
Figure 3. Example maps from a patient with idiopathic pulmonary fibrosis (IPF), a type of ILD. First row: T1 and M0_ratio maps (M0 map from VFA T1 map normalised by the AIF M0), 129Xe ventilation map, and inspiration CT. Second row: PBV for ‘T1-based’ (PBVT1), ‘subtraction’ (PBVsub), ‘normalisation’ method (PBVnorm) and corrected subtraction method (PBVsub_corr). An area of hypo-perfusion can be noted in the upper right lobe in PBVT1 and PBVnorm (arrow), and less clearly in PBVsub or PBVsub_corr. This area corresponds to an area of hypo-ventilation that can be noted in the 129Xe images.