1208
Hyperpolarized xenon-129 dissolved MRI based on two-point Dixon method
Hengjie Chen1, Jaime F Mata2, Y. Michael Shim2, John P. Mugler2, Xiaoping Hu1, Li Zhao3, An Liu4, and Kun Qing1,4
1University of California, Riverside, Riverside, CA, United States, 2University of Virginia, Charlottesville, VA, United States, 3Zhejiang University, Hangzhou, China, 4City of Hope National Medical Center, Duarte, CA, United States
1University of California, Riverside, Riverside, CA, United States, 2University of Virginia, Charlottesville, VA, United States, 3Zhejiang University, Hangzhou, China, 4City of Hope National Medical Center, Duarte, CA, United States
Synopsis
Keywords: Lung, Hyperpolarized MR (Gas)
In this work, a 2-point Dixon-based method is developed to provide separation of the hyperpolarized xenon-129 dissolved-phase magnetic resonance imaging (MRI) components for pulmonary applications. Based on analysis of data from 6 healthy volunteers and 20 patients with lung disease, the separated tissue and red blood cell (RBC) components obtained from this method are highly consistent with those from the previously-described 3-point Dixon method. The 2-point Dixon based method has the potential to greatly improve the signal-to-noise ratio for dissolved-phase MRI while still maintaining accurate tissue/RBC separation.Introduction
Hyperpolarized xenon-129 dissolved-phase (Xe129 DP) MRI [1, 2] provides direct assessment of gas exchange in the human lung. It has shown highly promising diagnostic value for evaluating pulmonary diseases [3-7]. To separate individual dissolved-phase components, including xenon-129 in the pulmonary parenchyma/plasma (“tissue” or “membrane”) and in red blood cells (“RBCs”), a Dixon-based method originally designed to separate water and fat in proton MRI is often adapted for Xe129 DP-MRI. Kaushik et al. [2] developed a 1-point Dixon-based approach which aligns the RBC and tissue signals to the real and imaginary channels and separates them. However, the accuracy and robustness of this method is subject to B0 field inhomogeneity and based on pre-assumption of the two dissolved-phase components which could change regionally in disease. Another approach [1], based on a conventional 3-point Dixon-based acquisition, was originally described for application at 1.5T. However, due to the short T2* of the dissolved-phase components, the third echo of the dissolved-phase data usually has a low signal-to-noise ratio (SNR), making it challenging to be used at 3T because the T2* values are even shorter (~1 ms) than at 1.5T. The purpose of this work is to demonstrate a new 2-point Dixon-based method to separate the two dissolved-phase Xe129 components. This method has potential to greatly improve the quality of Xe129 DP-MRI compared to the 3-point Dixon approach.Methods
Xe129 DP-MRI data from 26 subjects, including 6 healthy volunteers and 20 patients with chronic obstructive pulmonary disease (COPD), was used for this study. Each subject underwent the 3-point Dixon-based acquisition as described in previous work [1].The first two echoes (TE1/TE2 = 0.74/2.36 ms) of the Xe129 DP-MRI data, and the global free induction decay (FID) signal acquired after the imaging data as described in [1], were used for reconstruction using the 2-point Dixon method. The following equation, adapted from the Bloch equations, is used for reconstruction:
s(t)=e-i*φΔB*[MTISSUE*e-i*(wTISSUE*t+qTISSUE)*e-R2*TISSUE*t + MRBC*e-i*(wRBC*t+qRBC)*e-R2*RBC*t]
Among the variables, s(t) is the signal of a voxel at time t. MTISSUE and MRBC are the Xe129 magnetization dissolved in the tissue and RBCs. The field inhomogeneity factor φΔB is obtained from the difference of the two phases of the gas-phase data, as described in [1]. The precession frequencies wTISSUE and wRBC, precession initial phases qTISSUE and qRBC and decay constants R2*TISSUE and R2*RBC were estimated by least-square fitting to the FID signal. Different ranges are given for individual parameters during the fitting process to account for possible variations among subjects. The FID fitting follows two steps. First, the modulus of the model was fit to the amplitude of the FID, then the complex s(t) is fit to the complex FID with the above expression. Then the fitted parameters including wTISSUE, qTISSUE, R2*TISSUE, and wRBC, qRBC, R2*RBC are plugged in into the equation to seek for best fit for each individual voxel.
For quantitative comparison, RBC-to-gas and tissue-to-gas ratios were calculated to evaluate the differences between the original 3-point Dixon-based and the newly developed 2-point Dixon-based method in separation of the two dissolved-phase components.
Results
Examples of the tissue and RBC images separated by the original 3-point and the proposed 2-point Dixon-based methods from a healthy volunteer and a COPD patient are shown in Figure 1. Because only the first two echoes of the DP-MRI images were used, the reconstructed tissue and RBC images using the proposed method have significantly improved SNR compared to those reconstructed from three echoes. Highly consistent imaging features can be observed in the two image sets. Figure 2 shows a Bland-Altman plot of the RBC-to-gas and tissue-to-gas ratios from the two methods. The mean and standard deviation of the difference between the two methods (3-point Dixon – 2-point Dixon) is -0.043±0.111 for the tissue-to-gas ratios and 0.038±0.060 for the RBC-to-gas ratios.Discussion
Because the same ventilation (Gas) images were used to calculate the tissue-to-gas and RBC-to-gas ratios, the differences in the tissue-to-gas and RBC-to-gas ratios came from the differences in the separated tissue and RBC images using the two methods. In patients, the quality of the RBC image is easily affected by lower SNR, because of the relatively lower signal of Xe129 in RBC than in tissue. More noise is included in the RBC images reconstructed using the 3-point Dixon method than the new 2-point Dixon method. Figure 3 shows an example of this. This could at least partly explain the slightly larger RBC-to-gas ratios from images reconstructed using the original method, because more noise may be accounted as real signal.Conclusion
A new 2-point Dixon-based method is implemented for separation of the Xe129 dissolved-phase components. Relatively high consistency was found between the results obtained by this method and those from the original 3-point Dixon-based method. This new method requires acquisition of only two echoes of dissolved-phase data and provides reconstructed images with inherently higher SNR compared to the 3-point approach. The application of this method at 3T needs further investigation. The method should also be compared directly to the 1-point Dixon approach.Acknowledgements
No acknowledgement found.References
1. Qing, K., et al., Regional mapping of gas uptake by blood and tissue in the human lung using hyperpolarized xenon-129 MRI. J Magn Reson Imaging, 2014. 39(2): p. 346-59. 2. Kaushik, S.S., et al., Single-breath clinical imaging of hyperpolarized (129)Xe in the airspaces, barrier, and red blood cells using an interleaved 3D radial 1-point Dixon acquisition. Magn Reson Med, 2016. 75(4): p. 1434-43. 3. Myc, L., et al., Characterisation of gas exchange in COPD with dissolved-phase hyperpolarised xenon-129 MRI. Thorax, 2021. 76(2): p. 178-181. 4. Qing, K., et al., Assessment of lung function in asthma and COPD using hyperpolarized 129Xe chemical shift saturation recovery spectroscopy and dissolved-phase MRI. NMR Biomed, 2014. 27(12): p. 1490-501. 5. Kaushik, S.S., et al., Measuring diffusion limitation with a perfusion-limited gas--hyperpolarized 129Xe gas-transfer spectroscopy in patients with idiopathic pulmonary fibrosis. J Appl Physiol (1985), 2014. 117(6): p. 577-85. 6. Ebner, L., et al., The role of hyperpolarized (129)xenon in MR imaging of pulmonary function. Eur J Radiol, 2017. 86: p. 343-352. 7. Wang, J.M., et al., Using hyperpolarized (129)Xe MRI to quantify regional gas transfer in idiopathic pulmonary fibrosis. Thorax, 2018. 73(1): p. 21-28.Figures
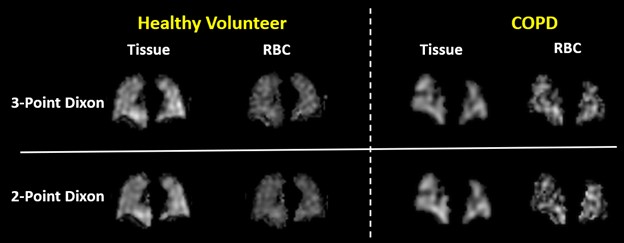
Figure 1. Examples of
reconstructed tissue and RBC images using the original 3-point Dixon-based and
the newly developed 2-point Dixon-based methods. Images are shown from a healthy
volunteer and a COPD patient.
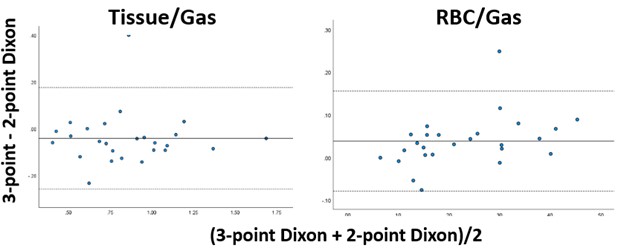
Figure 2. Bland-Altman
plot of the Tissue/Gas and RBC/Gas ratios reconstructed using the two methods.
The 3-point Dixon method produced slightly higher tissue-to-gas ratios and
lower RBC-to-gas ratios. The mean and standard deviation of the difference between the two
methods (3-point Dixon – 2-point Dixon) is -0.043±0.111 for the tissue-to-gas
ratios and 0.038±0.060 for the RBC-to-gas ratios.
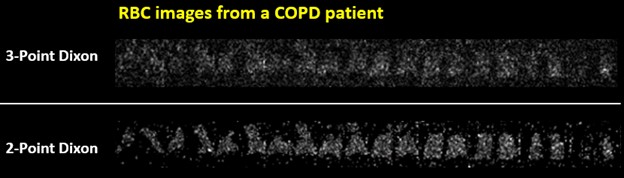
Figure 3. RBC images
from another COPD patient reconstructed using the 3-Point and 2-Point Dixon-based
methods. The 3-point Dixon-based method suffers from low SNR of the 3rd
echo of Xe129 DP-MRI data. In contrast,
the 2-point Dixon-based method produces images with significantly improved SNR
by using only the first two echoes of the Xe129 DP-MRI data.
DOI: https://doi.org/10.58530/2023/1208