1206
A brainstem-dedicated approach to assess the N1 sign using a 3T SWI1ToNIC, Toulouse NeuroImaging Center, University of Toulouse, Inserm, Toulouse, France
Synopsis
Keywords: Parkinson's Disease, Parkinson's Disease, Neurodegeneration
Because of its anatomical situation, the brainstem is difficult to image. With whole brain acquisitions, we end up with artifactual images. Our team developed a brainstem-dedicated T2*-weighted MRI acquisition method. Using this, we imaged the brain of sixteen healthy volunteers. This sequence was repeated 5 times for each volunteer. Our MRI protocol also consisted of a three-dimensional T1-weighted whole-brain sequence. The aim was to reduce the number of acquisitions required to visualize the nigrosome-1 by using image processing methods. We quantified the quality of the images by using image quality assessment indices and had one criterion: the visualization of nigrosome-1.Introduction
Although the cause of idiopathic Parkinson's disease remains unknown, the study of the brainstem represents a promising field of research. However, because of its anatomical position, the brainstem and its substructures are quite difficult to image. Susceptibility-weighted imaging (SWI) allows the visualization of a hypersignal of the dorsolateral area of the Substantia Nigra pars compacta: the N1 1 in healthy volunteers, at high field 2–6. The disappearance of this hypersignal would be a pathophysiological marker of Parkinson's disease associated with an increase in iron 7, a loss of dopaminergic neurons, a loss of neuromelanin, a change in iron oxidation, or a combination of these effects 8. In order to attest its absence in a pathological context, it is necessary to be able to reliably visualize it in healthy subjects. Therefore, it is compulsory to ensure that a reproducible and standardized magnetic resonance imaging (MRI) protocol is available to systematically visualize the N1 in healthy subjects 8. Here, we evaluated the contribution of different image processing steps to the visualization of this dorsal nigral hyperintensity and propose a robust, high-quality, reproducible, and rapid MRI protocol.Materials and methods
All images were acquired on a 3-T MRI scanner (Philips ACHIEVA dStream narrow-bore scanner, Inserm/UPS UMR 1214 ToNIC Technical Platform, Toulouse, France) with the same 32-channel head coil. 16 healthy volunteers were recruited for this study, aged between 18 and 40 years. The MRI protocol consisted of:- a 3D T1-weighted whole-brain sequence has been acquired at a 1.0 mm isotropic resolution. Parameters were: TR: 7.5 ms; TE: 3.5 ms; FA: 8°; acquisition time: 4 min 30 s.
- a 3D optimized brainstem-dedicated multi-echo gradient echo sequence (3D-mGE). A 0.67 mm × 0.67 mm × 1.4 mm resolution was chosen to be able to cover all the basal ganglia, midbrain and dentate nucleus. Parameters were: TR: 50 ms; TE1: 5 ms; ΔTE: 5 ms; nTE: 5; FA: 20°; acquisition time: 5 min 45 s. This sequence was repeated 5 times for each healthy volunteer.
Results
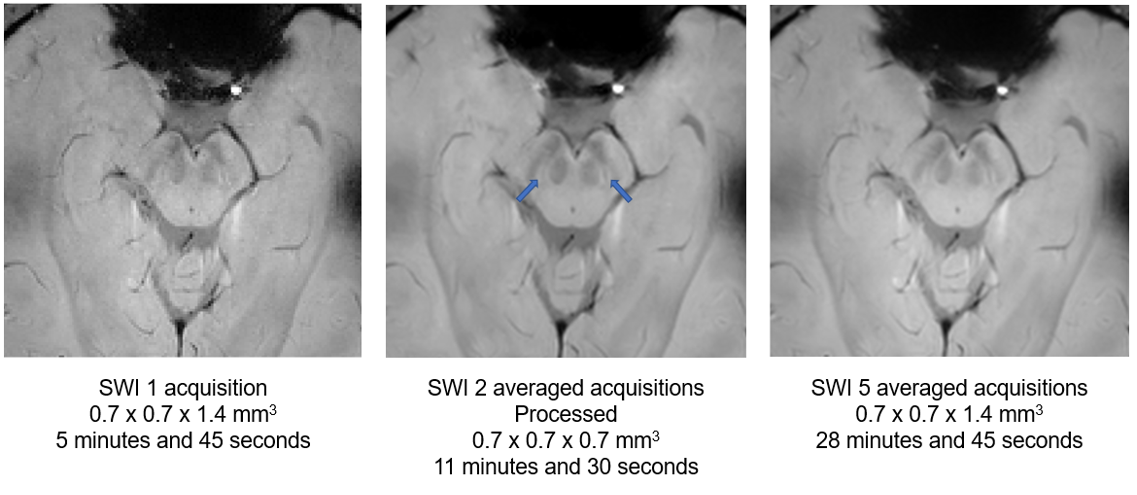
The contribution of averaging is visible from 2 averaged acquisitions. PSNR and SSIM values are quite close for 2 and 3 averaged acquisitions. After denoising, there is an increase in PSNR and SSIM. CV decrease for white and gray matter after bias correction. N1 is systematically visualized after post-processing for all healthy subjects and is seen bilaterally (Figure 1).Discussion
Our study shows that, after applying processing algorithms to our MR images, focused on the brainstem, it is possible to visualize the N1 systematically in healthy control subjects. The gain in image quality is low between 2 and 3 acquisitions. We, therefore, chose to focus on the image with 2 averaged acquisitions and applied filters to improve its quality. This would save considerable time and provide a robust and high-quality MRI protocol. Moreover, we would like to perform a complementary study in which we will have more healthy control subjects and patients. The goal would be to perform the same acquisitions as in this study and process the images in the same way and evaluate the presence of the N1 sign in a blinded way in healthy control subjects and patients. It would be interesting to indicate the phenotypes of the patients and to see if the presence or absence of the N1 sign uni- or bilaterally is correlated with certain phenotypes of Parkinson’s disease.Conclusion
With the acquisition and image processing used, it is possible to systematically visualize the N1 with two acquisitions for only 11 minutes and 30 seconds.Acknowledgements
We thank the Inserm/UPS UMR1214 Technical Platform for the MRI acquisitions.References
1. Reiter, E. et al. Dorsolateral nigral hyperintensity on 3.0T susceptibility-weighted imaging in neurodegenerative Parkinsonism. Mov. Disord. 30, 1068–1076 (2015).
2. Blazejewska, A. I. et al. Visualization of nigrosome 1 and its loss in PD: Pathoanatomical correlation and in vivo 7 T MRI. Neurology 81, 534–540 (2013).
3. Gramsch, C. et al. Nigrosome 1 visibility at susceptibility weighted 7T MRI—A dependable diagnostic marker for Parkinson’s disease or merely an inconsistent, age-dependent imaging finding? PLoS One 12, (2017).
4. Kim, J. M. et al. Loss of substantia nigra hyperintensity on 7 Tesla MRI of Parkinson’s disease, multiple system atrophy, and progressive supranuclear palsy. Park. Relat. Disord. 26, 47–54 (2016).
5. Lee, J. H. et al. The Neuromelanin-related T2∗ Contrast in Postmortem Human Substantia Nigra with 7T MRI. Sci. Rep. 6, (2016).
6. Schmidt, M. A. et al. Ultra high-field SWI of the substantia nigra at 7T: Reliability and consistency of the swallow-tail sign. BMC Neurol. 17, (2017).
7. Schwarz, S. T. et al. Parkinson’s disease related signal change in the nigrosomes 1–5 and the substantia nigra using T2* weighted 7T MRI. NeuroImage Clin. 19, 683–689 (2018).
8. Cheng, Z. et al. Imaging the Nigrosome 1 in the substantia nigra using susceptibility weighted imaging and quantitative susceptibility mapping: An application to Parkinson’s disease. NeuroImage Clin. 25, (2020).
9. Manjón, J. V., Coupé, P., Martí-Bonmatí, L., Collins, D. L. & Robles, M. Adaptive non-local means denoising of MR images with spatially varying noise levels. J. Magn. Reson. Imaging 31, 192–203 (2010).
10. Manjón, J. V. et al. Non-local MRI upsampling. Med. Image Anal. 14, 784–792 (2010).
Figures