1196
Multiparametric Quantitative MRI of Peripheral Nerves: A Reliability Study1Department of Neurology, Wayne State University School of Medicine, Detroit, MI, United States, 2Department of Radiology, Wayne State University School of Medicine, Detroit, MI, United States, 3Department of Translational Neuroscience, Barrow Neurological Institute, Phoenix, AZ, United States, 4Department of Neurology, Houston Methodist Hospital, Houston, TX, United States
Synopsis
Keywords: Nerves, Nerves
This study developed a multiparametric qMRI method to quantify fat fraction of leg muscles, myelin and axonal pathologies of peripheral nerves using MTR, MTsat, T1, PD, T2*, FA, MD, AD, RD, and nerve fascicular volume. The results will be applied in ongoing longitudinal studies to develop monitoring biomarkers in patients with polyneuropathies.Introduction
Polyneuropathies result in demyelination and axonal degeneration in peripheral nerves, as well as intramuscular fat accumulation in denervated muscles. Given the rapid advancement of therapeutic developments, there is a pressing need to develop monitoring biomarkers in patients with polyneuropathies. Quantitative MRI (qMRI) offers several advantages over existing measures, including its 1) objective, non-invasive nature; 2) ability to measure proximal (e.g., sciatic) nerve which is largely inaccessible by other techniques (e.g., nerve conduction studies); and 3) sensitivity to axons and myelin pathologies in nerves as well as downstream denervation changes in muscles.1The goals of this study were to: 1) develop a multiparametric qMRI method that can be used for characterizing nerve pathologies and tracking the progression of the disease; 2) characterize the distal to proximal length-dependent changes of nerve qMRI parameters in healthy subjects; and 3) investigate the test-retest repeatability and inter-rater reliability of the qMRI methods. The qMRI method quantifies the fat fraction (FF) of leg muscles and parameters of the sciatic and tibial nerves that are sensitive to different aspects of myelin and axonal pathologies from magnetization transfer imaging [magnetization transfer ratio (MTR) and magnetization transfer saturation index (MTsat)], relaxation properties [T1, proton density (PD), and T2*], diffusion tensor imaging [fractional anisotropy (FA), mean diffusivity (MD), axial diffusivity (AD), and radial diffusivity (RD)], and morphology [the size of nerves represented as nerve fascicular volume (fVol)].
Methods
Data Acquisition: We studies 17 healthy volunteers (age: 36.2 ± 13.8 years old, body mass index (BMI): 23.1 ± 3.1, 52.9% male) using a Siemens VERIO 3T MRI with an 8-channel Tx/Rx knee coil. Ten of them had a second MRI scan (interval: 12.5 ± 19.7 days). The protocol includes: i) a 6-echo 3D gradient echo (GRE) sequence for fat-water decomposition and calculating the FF of muscles; ii) a 3D GRE sequence for measuring the nerve fVol; iii) two multi-echo 3D GRE sequences with and without an MT preparation for calculating the MTR and T2*; iv) two 3D GRE sequences to calculate the PD, T1, and MTsat; v) a pair of 3D GRE fast scans for B1 mapping; and vi) a DTI scan with a b-value of 800 s/mm2 and 20 gradient directions for FA, MD, AD, and RD. Fat suppression was used for all scans except for the 6-echo fat-water and the B1 mapping scans. The imaging protocol was performed in an axial plane at the mid-thigh level to examine the proximal (sciatic) nerve and then repeated at the mid-calf level to examine the distal (tibial) nerve (Figure 1).Image Processing and Data Analysis: An in-house developed pipeline in MATLAB was used to process all the data with the following steps automatically: i) image co-registration using SPM122; ii) fat-water decomposition using a whole image optimization algorithm3, 4; iii) B1 mapping using a quadratic fitting-based algorithm5; iv) a simple linear regression for T2* mapping6; v) a variable flip angle method for T1 and PD mapping with B1 corrections5; vi) MTR7 and MTsat8 maps calculated as described; vii) diffusion tensor reconstruction using the command line features in the DSI Studio9. A deep learning-based model was used for the automatic segmentation of individual muscles which were then combined as muscle compartments5. Sciatic nerve and tibial nerve ROIs were delineated on the high-resolution 3D GRE images using a semi-automated region growing tool in the SPIN software as described1. Two independent raters delineated the nerve ROIs for inter-rater reliability analysis. Finally, an in-house developed MATLAB program automatically calculated and tabulated all the quantitative values for nerves and muscles.
Statistical Analysis: MATLAB with an in-house developed script was used for statistical analysis and visualization. Test-retest repeatability and inter-rater reliability were evaluated using the Bland-Altman, intraclass correlation coefficient (ICC)10, and coefficient of variation (COV) analyses. The distal-to-proximal changes were assessed using paired t-test. Correlations among parameters were tested using Pearson’s linear correlation coefficient.
Results
As shown in Figures 2 and 3, normative qMRI values of nerves and muscle compartments had good to excellent test-retest agreement, as well as good to excellent inter-rater agreement (all ICC > 0.8). Whole muscle FF was correlated with the subject’s BMI (r = 0.76 for thigh muscle; r = 0.70 for calf muscle) but not with nerve qMRI parameters (Figure 4). Nerve MTR and MTsat were negatively correlated with T2*, T1, PD, MD, AD, and RD, but not with FA (Figure 4). There were significantly length-dependent differences between distal and proximal sites in muscle FF, nerve MTsat, T1, PD, FA, MD, and RD (Figure 5).Discussion and Conclusions
Our multiparametric qMRI method shows good to excellent repeatability. This sets a solid base for evaluating disease progression in patients with polyneuropathies. The machine learning model used in the analysis was reliable in measuring compartmental and whole muscle fat fractions. The distal-to-proximal changes observed in the study are promising for evaluating pathological progression in patients with polyneuropathies.Acknowledgements
This study is supported by grants (R61NS119434, R21TR003312) from NIH.References
1. Chen Y, Haacke EM, Li J. Peripheral nerve magnetic resonance imaging. F1000Res 2019;8:1803.
2. Penny WD, Friston KJ, Ashburner JT, Kiebel SJ, Nichols TE. Statistical parametric mapping: the analysis of functional brain images: Elsevier, 2011.
3. Smith DS, Berglund J, Kullberg J, Ahlström H, Avison MJ, Welch EB. Optimization of fat-water separation algorithm selection and options using image-based metrics with validation by ISMRM fat-water challenge datasets. Proc Intl Soc Mag Reson Med; 2013; Salt Lake City, Utah, USA: 2413-2413.
4. Berglund J, Kullberg J. Three‐dimensional water/fat separation and T estimation based on whole‐image optimization—Application in breathhold liver imaging at 1.5 T. Magnetic resonance in medicine 2012;67:1684-1693.
5. Chen Y, Moiseev D, Kong WY, Bezanovski A, Li J. Automation of Quantifying Axonal Loss in Patients with Peripheral Neuropathies through Deep Learning Derived Muscle Fat Fraction. Journal of Magnetic Resonance Imaging 2021;53:1539-1549.
6. Saba S, Chen Y, Maddipati KR, Hackett M, Hu B, Li J. Demyelination in hereditary sensory neuropathy type‐1C. Annals of Clinical and Translational Neurology 2020;7:1502-1512.
7. Dortch RD, Dethrage LM, Gore JC, Smith SA, Li J. Proximal nerve magnetization transfer MRI relates to disability in Charcot-Marie-Tooth diseases. Neurology 2014;83:1545-1553.
8. Helms G, Dathe H, Kallenberg K, Dechent P. High‐resolution maps of magnetization transfer with inherent correction for RF inhomogeneity and T1 relaxation obtained from 3D FLASH MRI. Magnetic Resonance in Medicine: An Official Journal of the International Society for Magnetic Resonance in Medicine 2008;60:1396-1407.
9. Yeh FC, Liu L, Hitchens TK, Wu YL. Mapping immune cell infiltration using restricted diffusion MRI. Magnetic resonance in medicine 2017;77:603-612.
10. Koo TK, Li MY. A guideline of selecting and reporting intraclass correlation coefficients for reliability research. Journal of chiropractic medicine 2016;15:155-163.
Figures
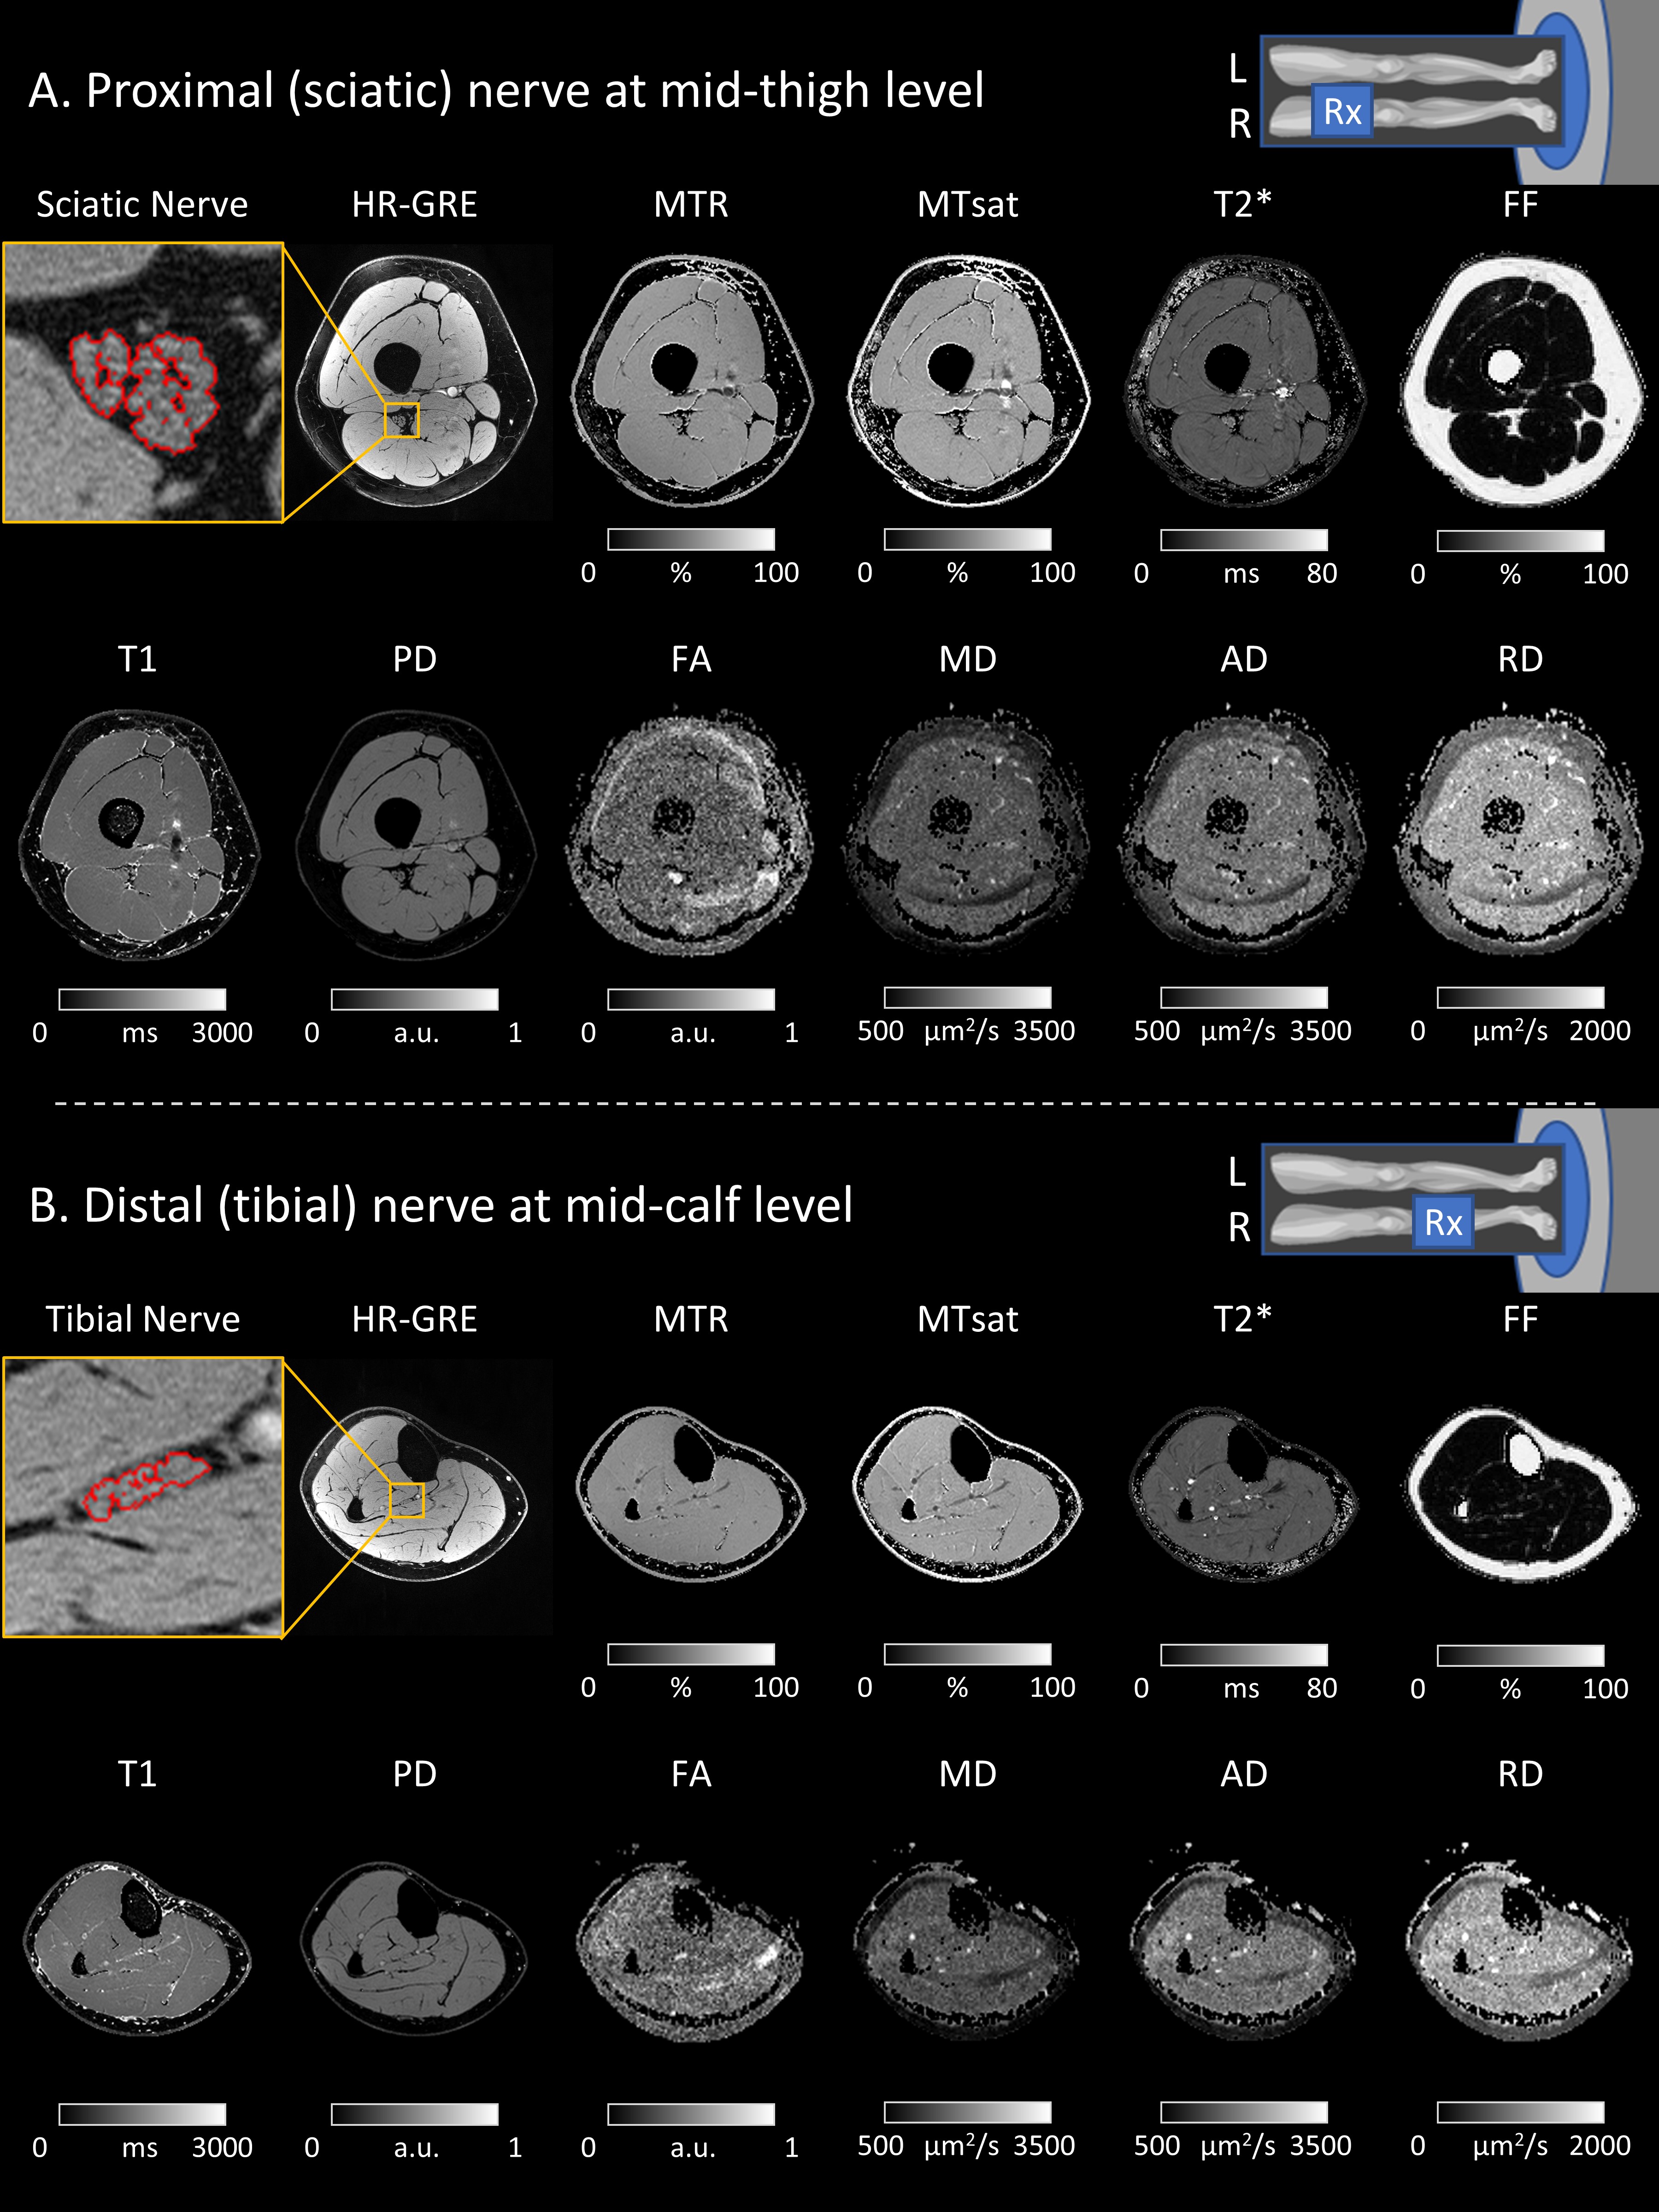
Figure 1. Representative qMRI images acquired at the mid-thigh (A) and mid-calf (B) levels. The imaging resolutions were 1.2x1.2x3.0 mm3 for FF; 0.15x0.15x3.0 mm3 for the high-resolution GRE to measure fVol, 0.6x0.6x3.0 mm3 for MTR, MTsat, T2*, T1, and PD; and 1.2x1.2x6.0 mm3 for FA, MD, AD, and RD. The total scan time was about one hour per subject.
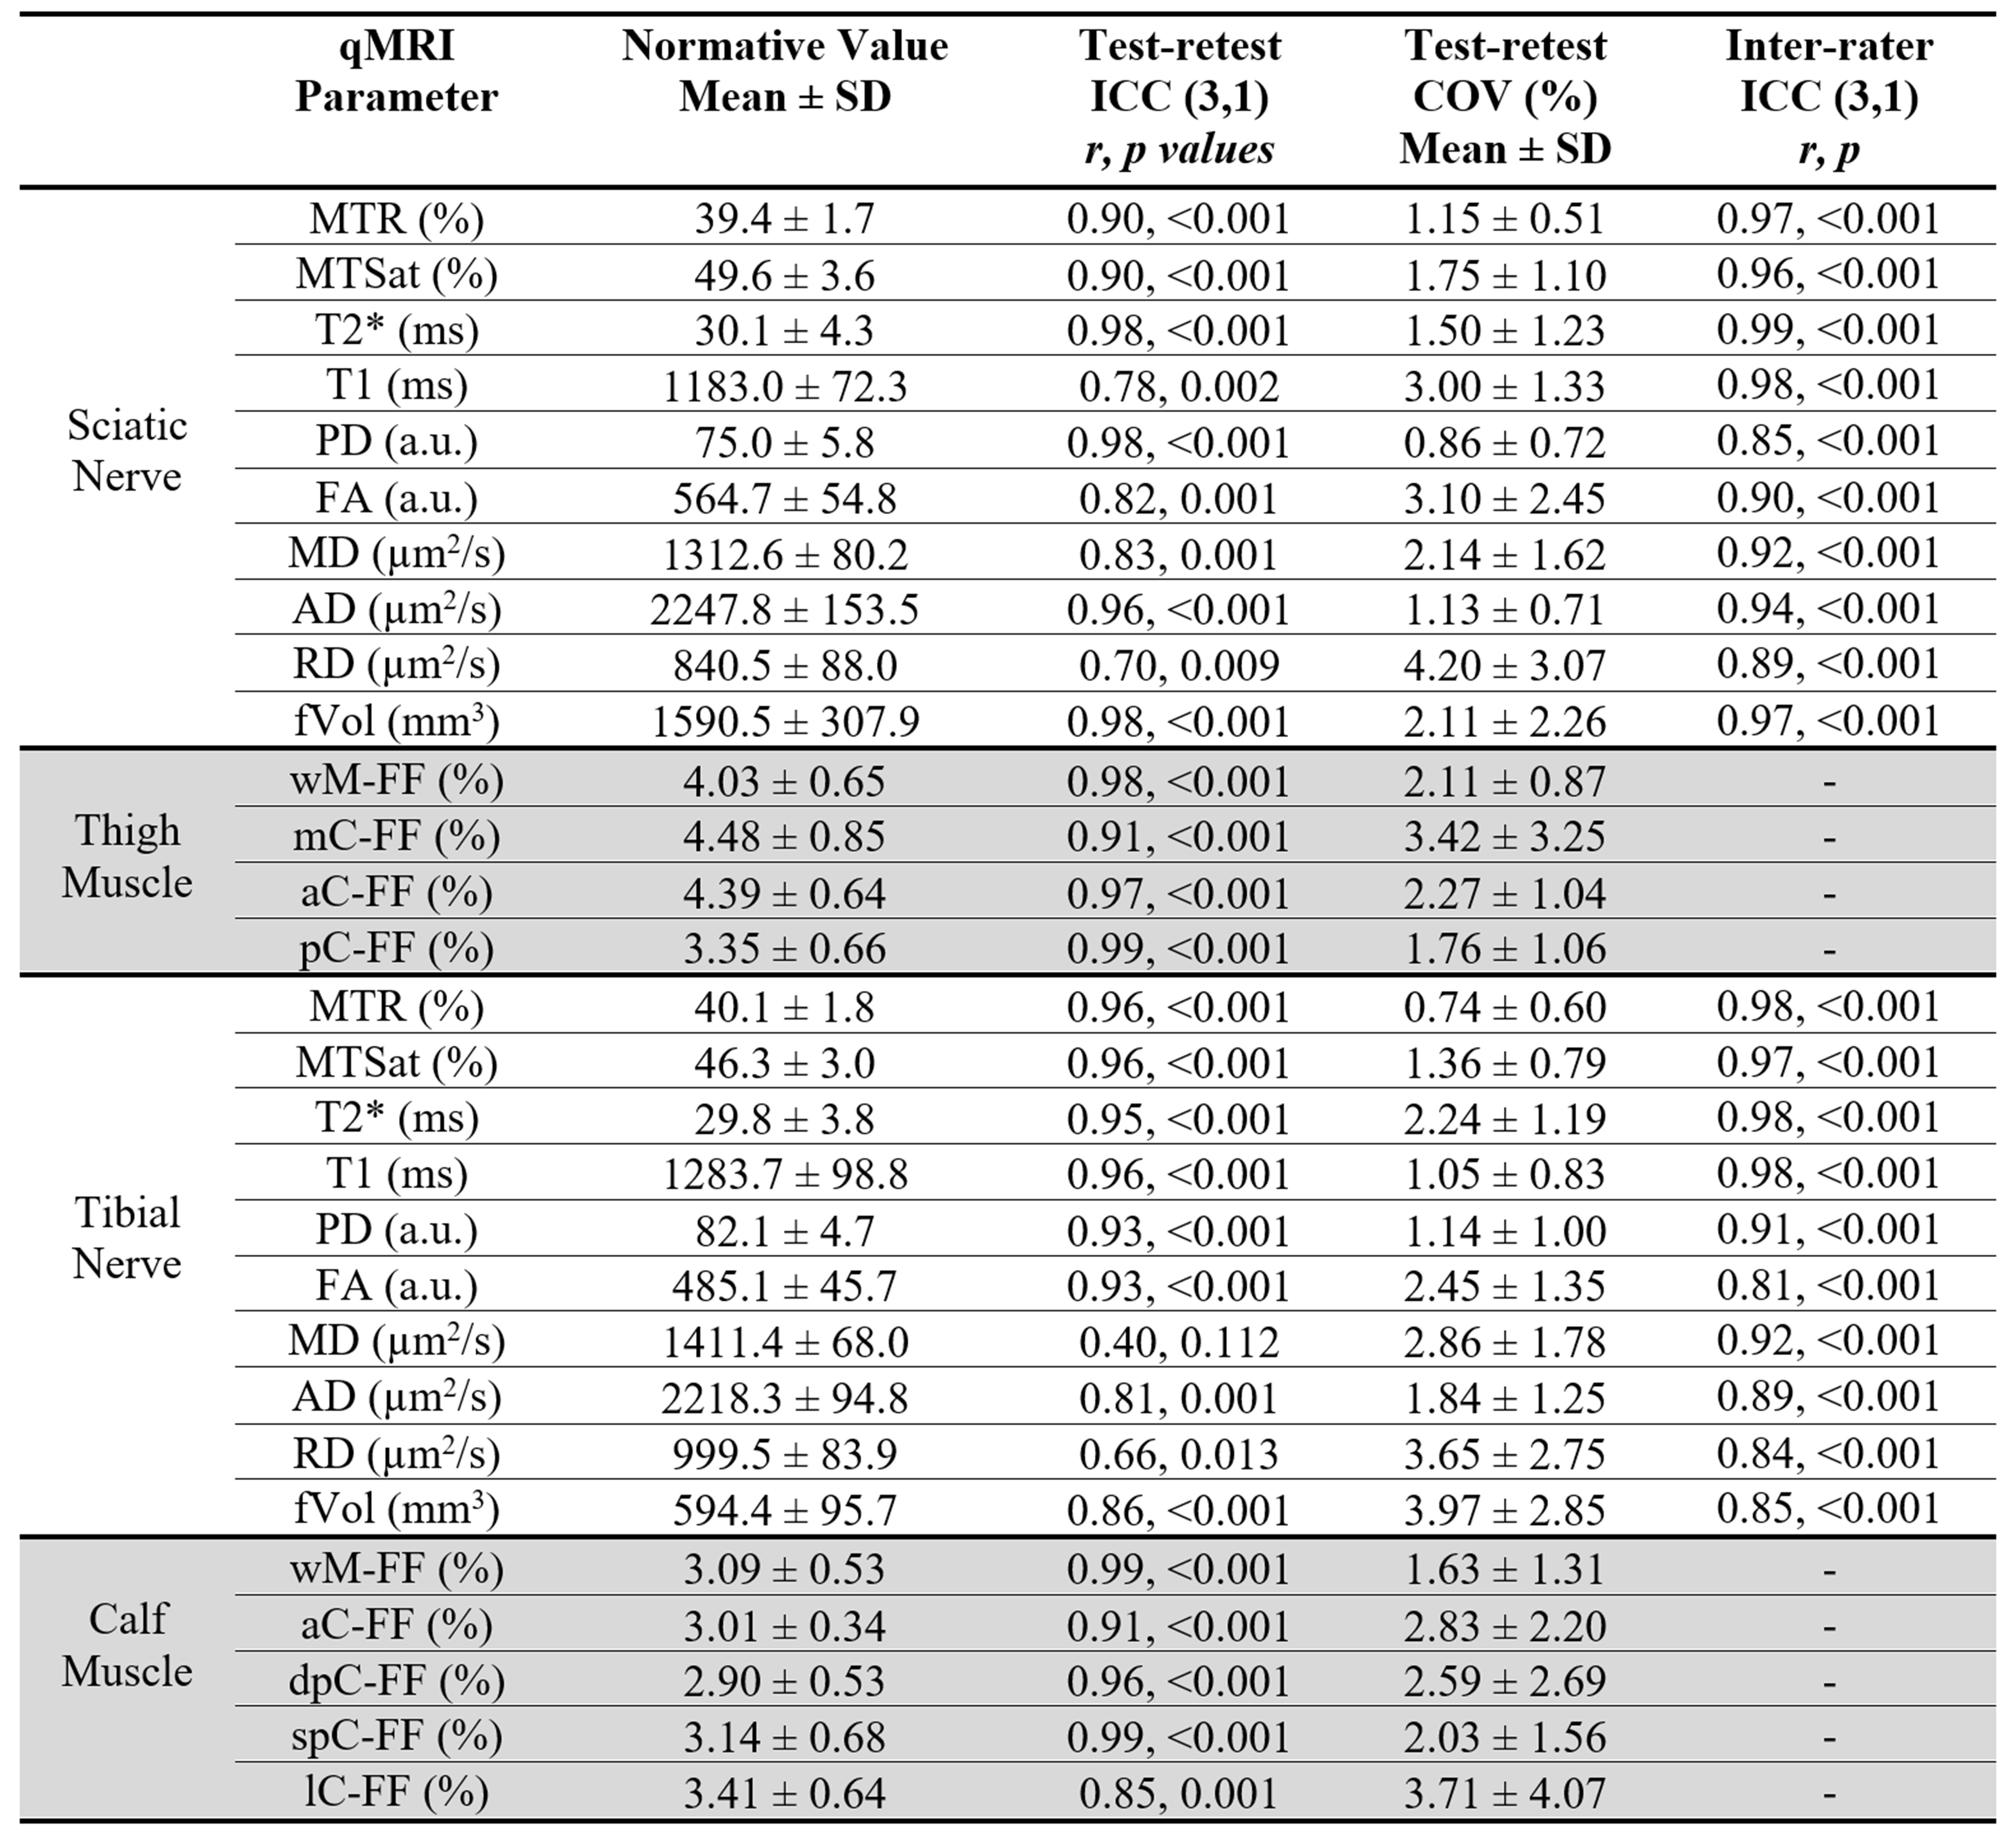
Figure 2. Descriptive statistics. Normative values were from the 17 volunteers’ data. For the ICC (3,1) analysis, an r-value of 0.5-0.75, 0.75-0.9, and >0.9 are considered moderate, good, and excellent agreement, respectively. Abbreviations for muscle compartments: wM=whole muscle; mC=medial compartment; aC=anterior compartment; pC=posterior compartment; dpC=deep posterior compartment; spC=superficial posterior compartment; lC=lateral compartment.
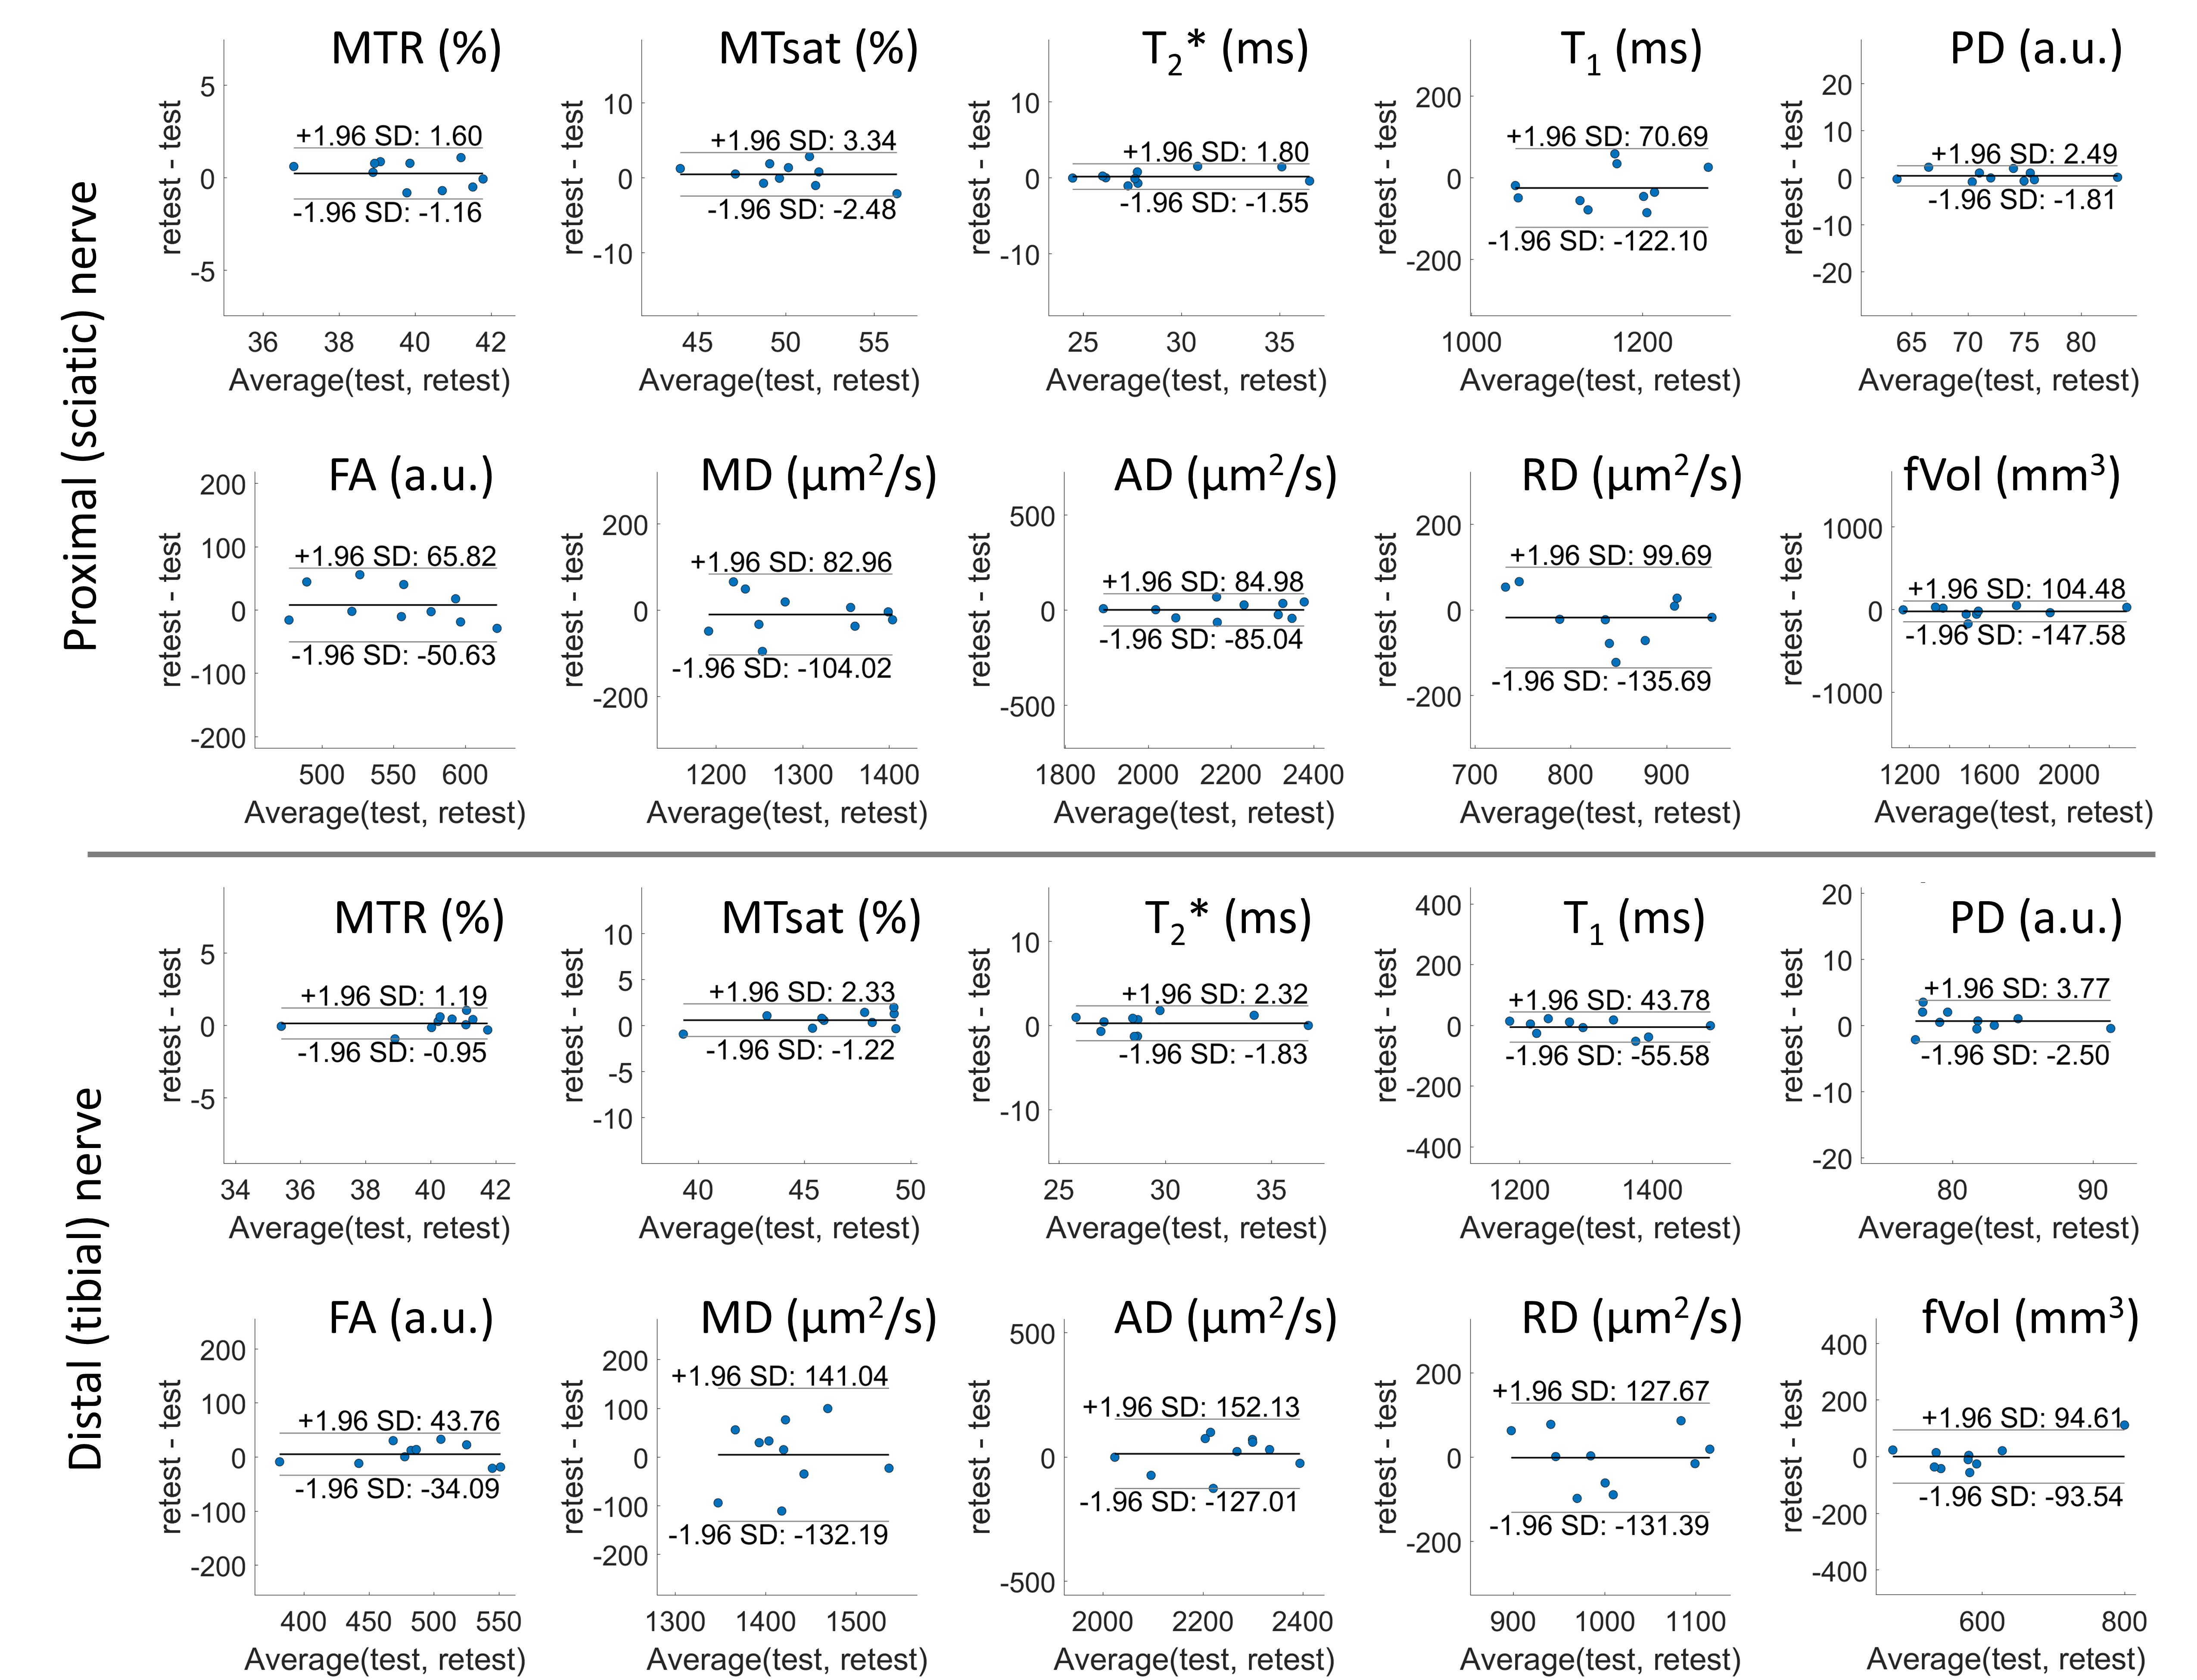
Figure 3. Bland-Altman analyses for the nerve qMRI test-retest data.
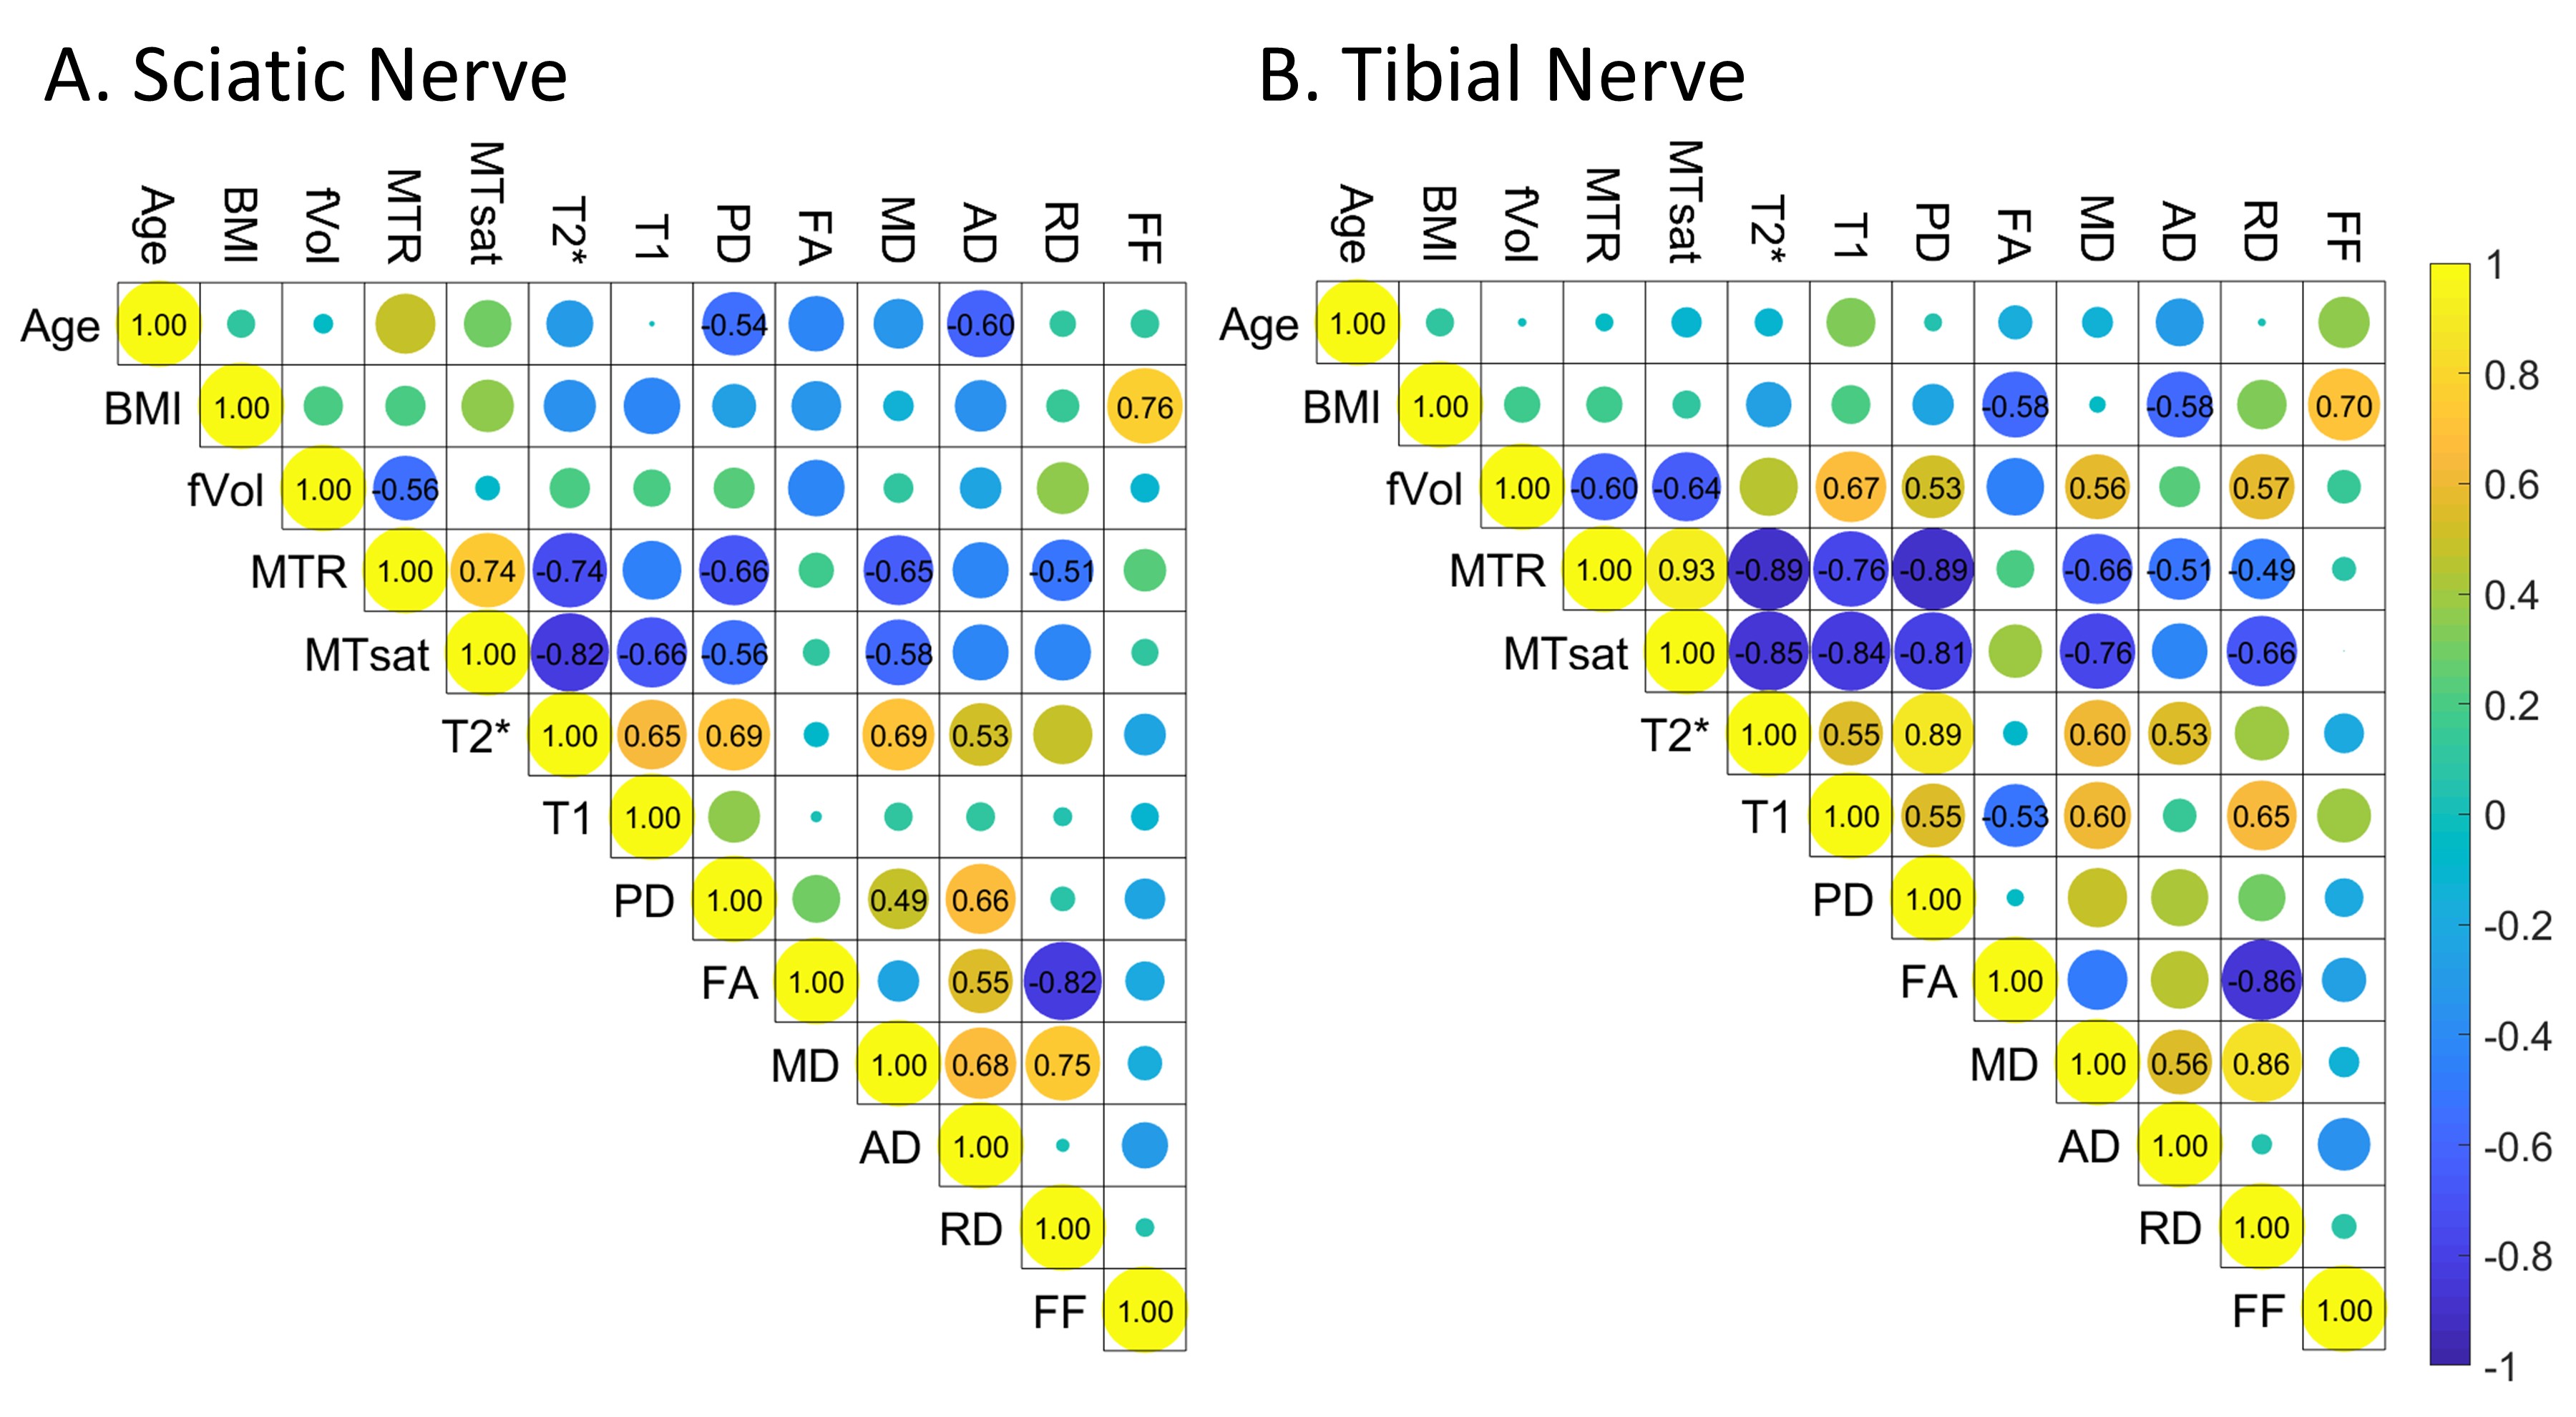
Figure 4. Correlations among qMRI parameters. The number (only shown when the p-value < 0.05) on each element of the matrix stands for the correlation coefficient r between the two parameters. The diameter of the color-coded circle is the absolute value of r, while the color from blue to yellow stands for the sign of the correlation, from negative to positive. FF is the whole muscle FF for thigh (A) and calf (B) muscles.
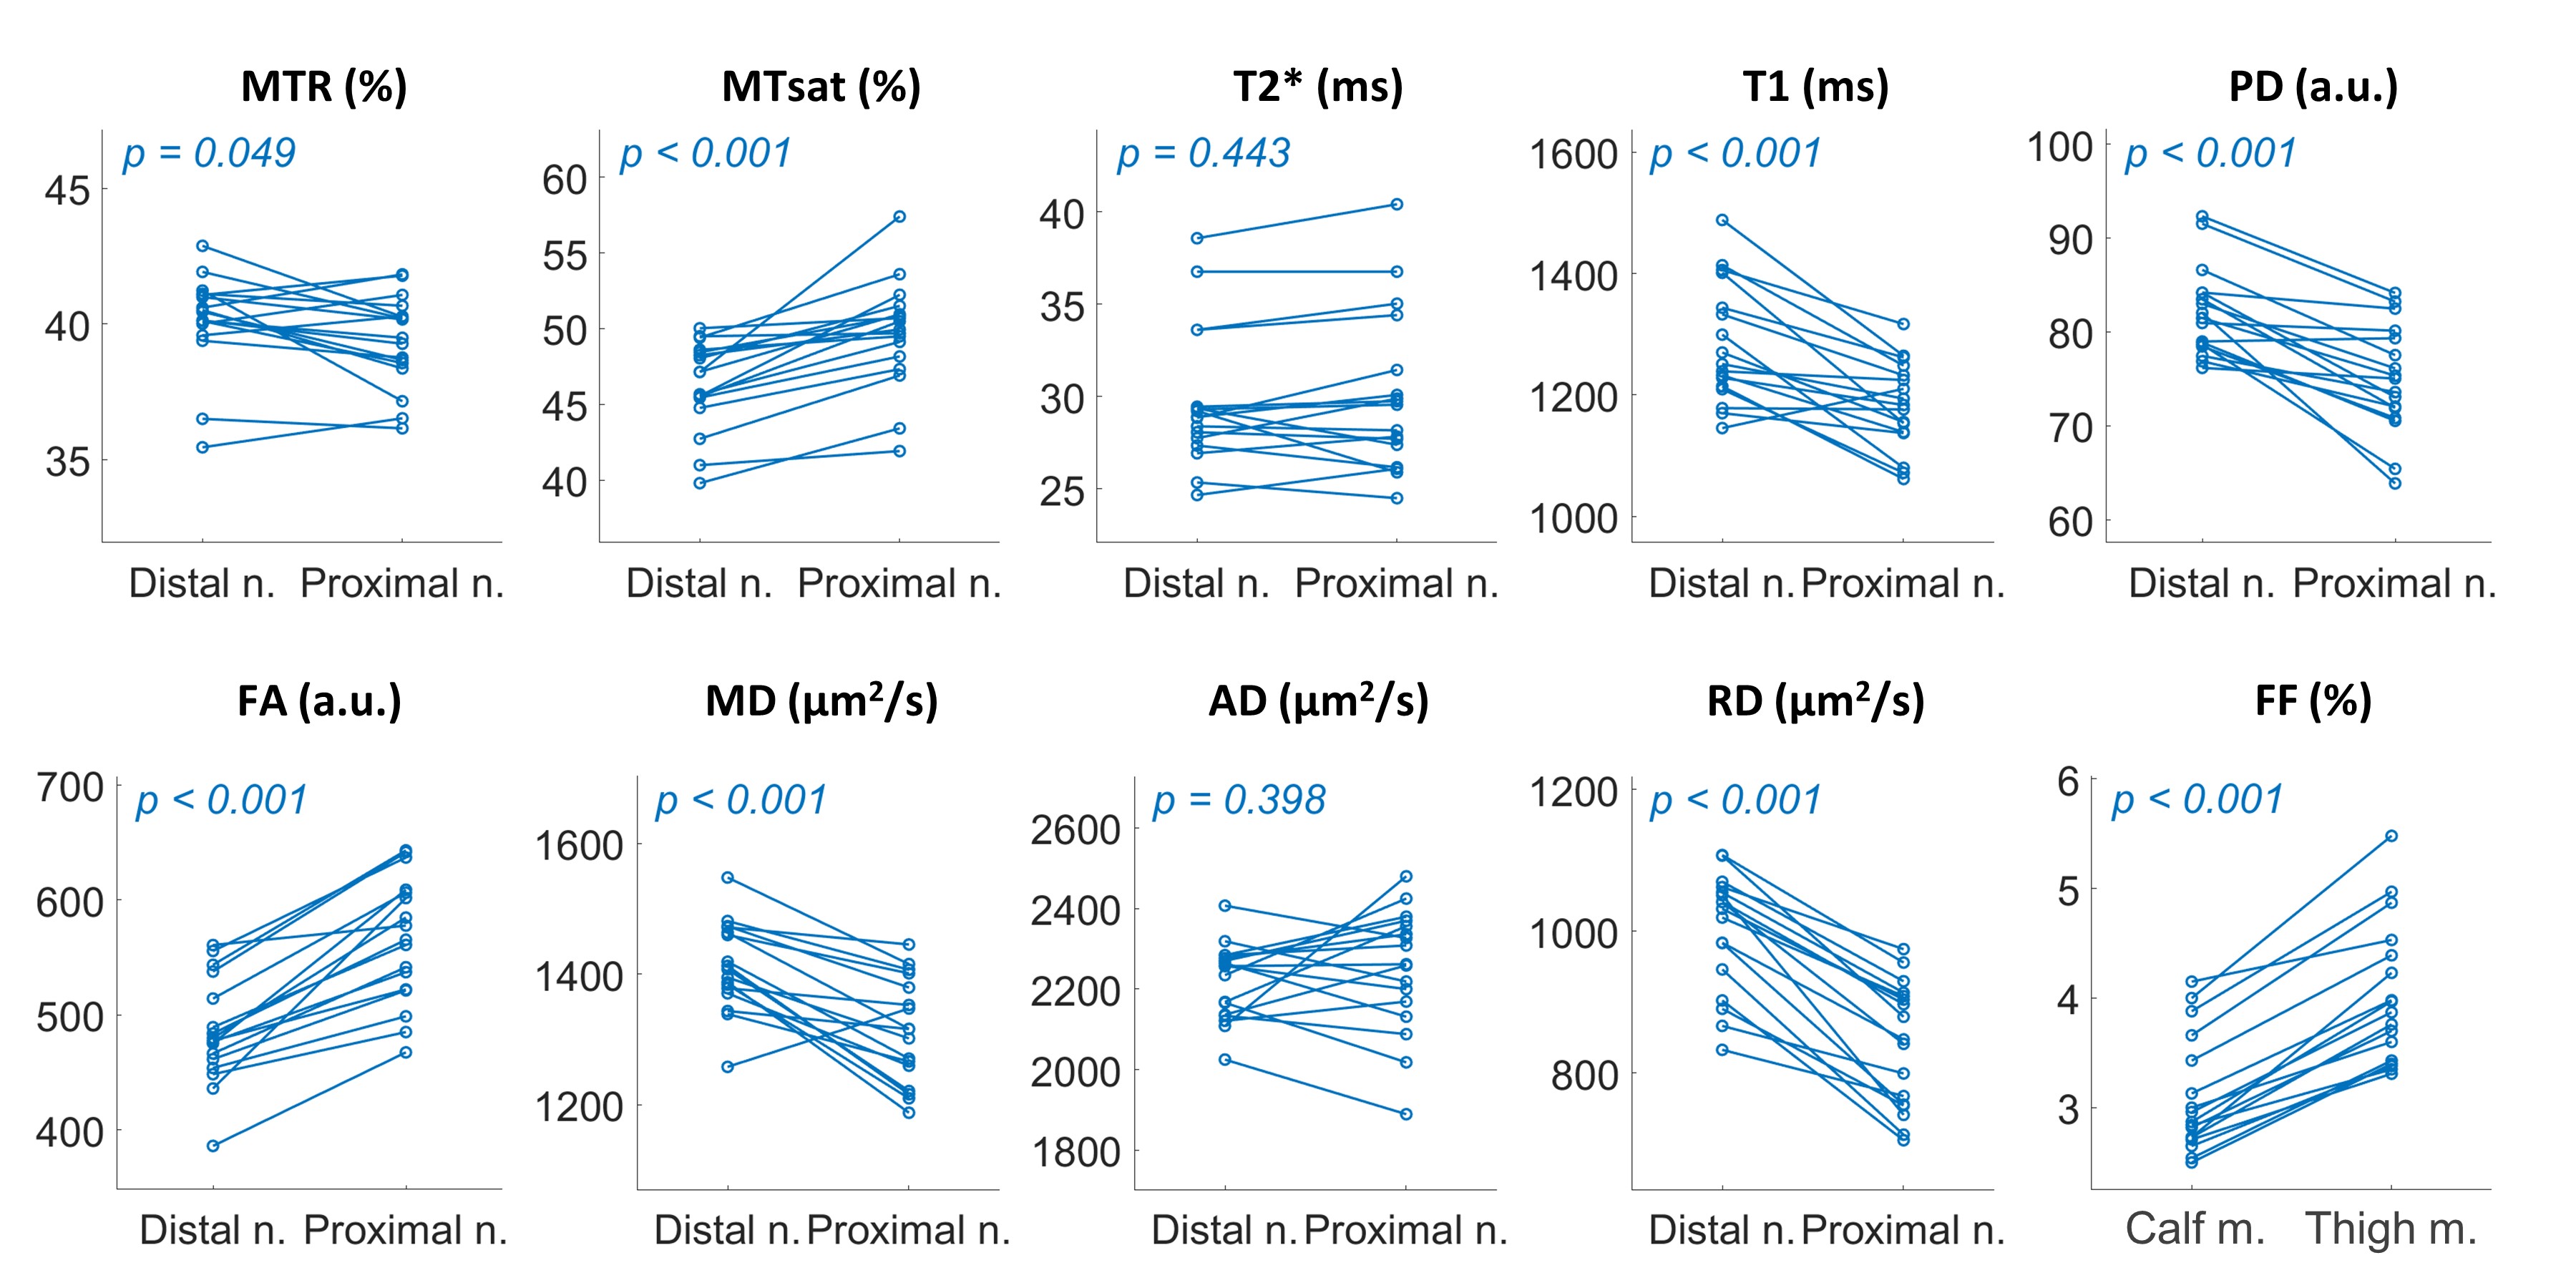
Figure 5. Distal to proximal changes of nerve qMRI parameters and muscle FF. The distal nerve (Distal n.) stands for the tibial nerve at mid-calf level, while the proximal nerve (Proximal n.) is the sciatic nerve at mid-thigh level. The FF plot is the whole muscle FF of the calf (Calf m.) and the thigh (Thigh m.) dataset.