1191
Magnetization transfer imaging of patients with Guillain-Barre Syndrome1Barrow Neuroimaging Innovation Center, Barrow Neurological Institute, Phoenix, AZ, United States, 2Barrow Neurological Institute, Phoenix, AZ, United States
Synopsis
Keywords: Nerves, Magnetization transfer, Guillain-Barre Syndrome
New biomarkers are needed in Guillain-Barre Syndrome to predict patient recovery and severe complications and aid in drug development. We propose using magnetization transfer (MT) MRI to measure myelin content to act as such a biomarker. We have shown the ability of the MT imaging to visualize the cauda equina, but further work is needed to confirm these differences and biomarker suitability.Introduction
Guillain-Barre Syndrome (GBS) is the most common acute paralytic demyelinating neuropathy. It has a heterogeneous clinical presentation characterized by a delayed recovery (20% of patients still cannot walk unassisted at 6 months [1]) and severe complications (30% of patients experience respiratory failure [2]). Contrast enhanced MRI of the nerve roots commonly aids in the diagnosis of GBS. It is thought that the gadolinium contrast agent accumulates in the nerve roots of GBS patients as the blood-nerve barrier breaks down due to a combination of nerve inflammation and demyelination [3]. Previous studies have evaluated the qualitative or semi-quantitative nerve enhancement seen in GBS patients [4,5] as well as its prognostic ability [6,7]. Despite this, only one study has demonstrated a relationship between qualitatively assessed MRI enhancement of the nerve roots and the clinical severity [6].Nerve diameter MRI or ultrasound has also been investigated as a potential imaging biomarker in GBS. Spinal nerve root thickening is a recognized feature of GBS patients primarily due to inflammation and secondarily to the disruption of the blood-nerve barrier [8–12]. A study found that nerve diameter measured on contrast-enhanced MRI was not indicative of or clinical grade [4] nor was diameter measured on ultrasound indicative of clinical disability [13].
Here we show early evidence of magnetization transfer (MT) MRI of the cauda equina in GBS patients. As MT reports on myelin content, we expect MT metrics to change during the disease in demyelinating variants of GBS.
Methods
Three GBS patients (1 male, 19-58 years old) received MRI scans to develop and test the GBS imaging protocol. The cauda equina (approximately L2-L5 of the spinal cord) was imaged using a 3.0T Philips Ingenia MRI scanner. MT-weighted (MTw) data were acquired in each subject with and without an MT saturation pulse, segmented EPI readout (5 lines/shot), and water-selective excitation pulse. Additional parameters included: TR/TE=58/12.5 ms, resolution=, and field-of-view=. A T1-weighted scan (25° flip angle, TR/TE=30/12.5 ms) was also acquired using the same sequence without an MT pulse to additionally estimate MT saturation (MTsat) [14].All data underwent were co-registered using an in-house affine registration tool. The cauda equina was then manually segmented based on the MTw images, and the following MT metrics were extracted for each slice and averaged over all slices: MT ratio (MTR) [15] and MTsat [14]. One patient received a second (follow-up) scan 4.5 months following the initial scan. Images were evaluated for their ability to discern the cauda equina and quantitative results presented.
Results
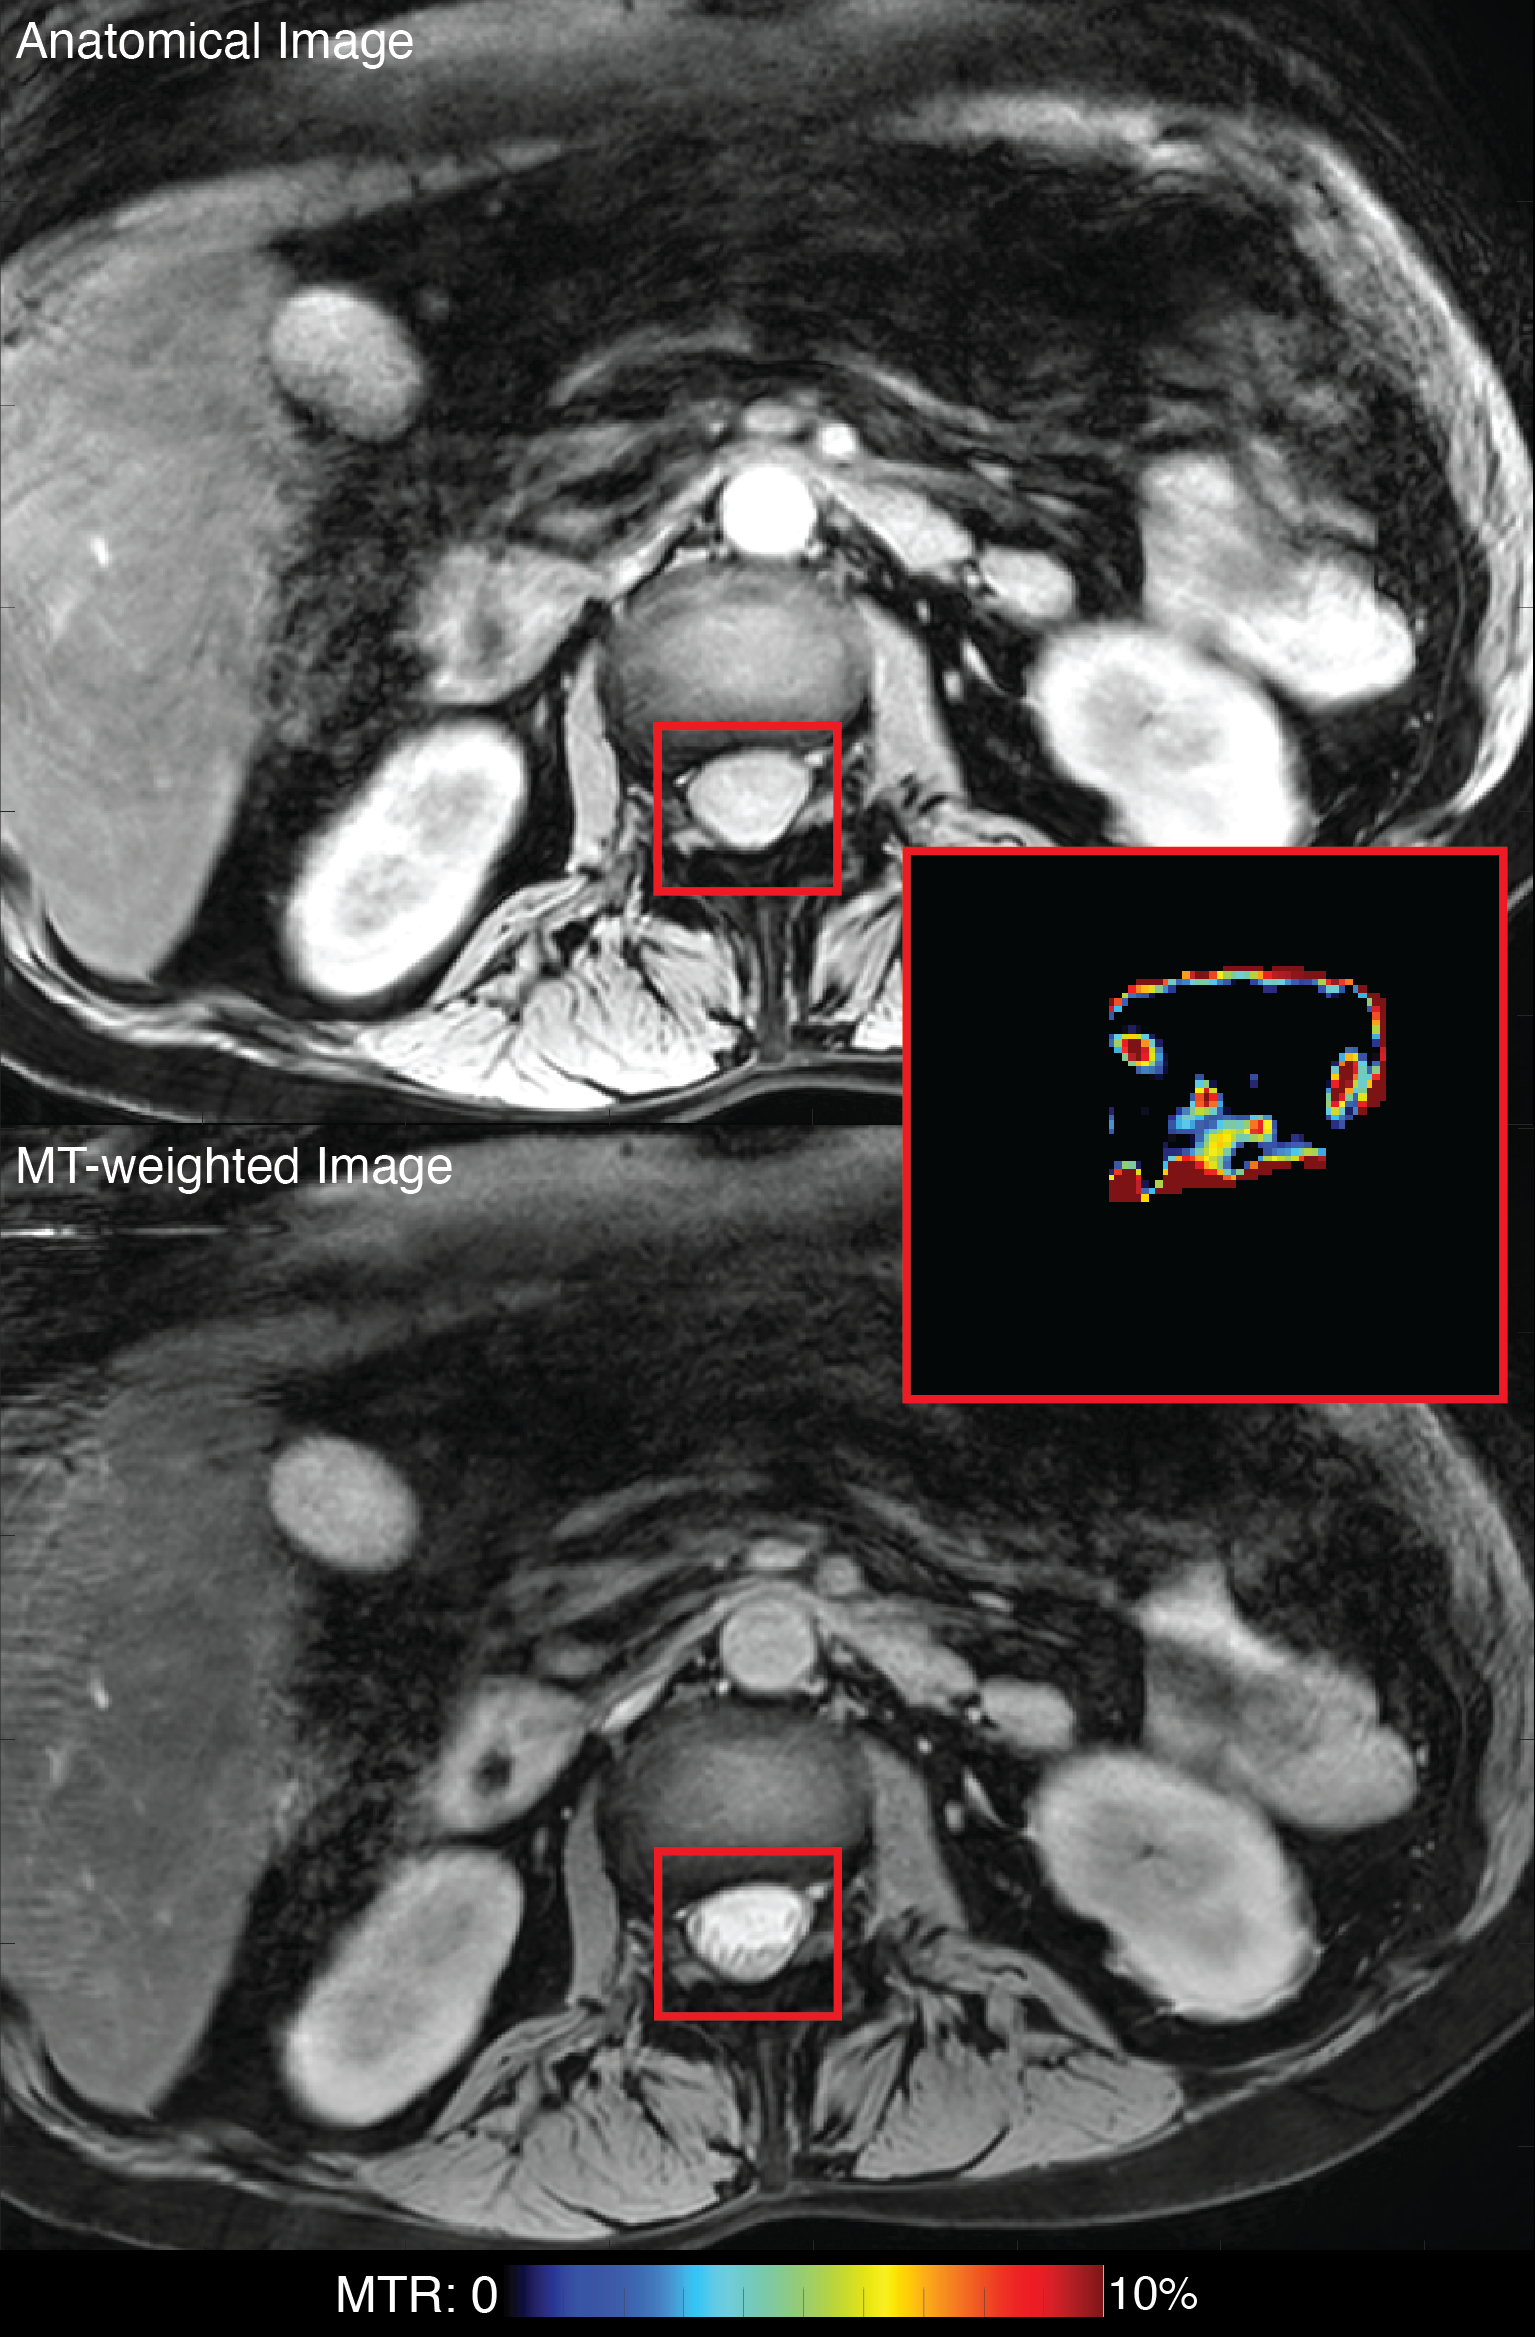
The cauda equina was readily distinguishable on the anatomical T2-weighted scans and MTw scans as shown in Figure 1 and free from artifacts related to motion, CSF pulsation, and fat. All MT values are shown in Table 1. Mean MTR and MTsat were found to be 3.78-9.04% and 0.11-1.05%, respectively for the three patients at the first scan, acquired soon after admission to the hospital. The third patient received a second scan 4.5 months following the first scan during which time they recovered from paralyzed to walking; MTR and MTsat increased during that time to 12.12% and 1.16%, respectively (Table 1).Discussion
This was the first study to investigate MT imaging of the cauda equina in patients with GBS. These preliminary data confirmed that our imaging parameters produce high quality images sufficient for performing further investigation. Future work will include expanding this pilot trial population, acquiring diffusion MRI data to additionally assay axonal pathologies, and comparing imaging with clinical metrics such as disease variant and nerve conduction studies to evaluate the prognostic values of these candidate imaging biomarkers.Acknowledgements
This work was supported by the Barrow Neurological Foundation.References
[1] C. Fokke, B. Van Den Berg, J. Drenthen, C. Walgaard, P.A. Van Doorn, B.C. Jacobs, Diagnosis of Guillain-Barré syndrome and validation of Brighton criteria, Brain. 137 (2014) 33–43. https://doi.org/10.1093/brain/awt285.
[2] B. Van Den Berg, C. Bunschoten, P.A. Van Doorn, B.C. Jacobs, Mortality in Guillain-Barré syndrome, Neurology. 80 (2013) 1650–1654. https://doi.org/10.1212/WNL.0b013e3182904fcc.
[3] G. Sze, Gadolinium-DTPA in spinal disease., Radiol Clin North Am. 26 (1988) 1009–1024.
[4] A. Yikilmaz, S. Doganay, H. Gumus, H. Per, S. Kumandas, A. Coskun, Magnetic resonance imaging of childhood Guillain-Barre syndrome, Child’s Nervous System. 26 (2010) 1103–1108. https://doi.org/10.1007/s00381-010-1197-8.
[5] J.R. Perry, A. Fung, P. Poon, N. Bayer, Magnetic resonance imaging of nerve root inflammation in the Guillain-Barré syndrome, Neuroradiology. 36 (1994) 139–140. https://doi.org/10.1007/BF00588081.
[6] K.C. Gorson, A.H. Ropper, M.A. Muriello, R. Blair, Prospective evaluation of MRI lumbosacral nerve root enhancement in acute Guillain-Barré syndrome., Neurology. 47 (1996) 813–817. https://doi.org/10.1212/wnl.47.3.813.
[7] W.M. Byun, W.K. Park, B.H. Park, S.H. Ahn, M.S. Hwang, J.C. Chang, Guillain-Barré syndrome: MR imaging findings of the spine in eight patients., Radiology. 208 (1998) 137–141. https://doi.org/10.1148/radiology.208.1.9646804.
[8] G.A. Baran, M.K. Sowell, G.B. Sharp, C.M. Glasier, MR findings in a child with Guillain-Barré syndrome, AJR Am J Roentgenol. 161 (1993) 161—163. https://doi.org/10.2214/ajr.161.1.8517296.
[9] T. Bertorini, H. Halford, J. Lawrence, D. Vo, M. Wassef, Contrast-enhanced Magnetic Resonance Imaging of the Lumbosacral Roots in the Dysimmune Inflammatory Polyneuropathies, Journal of Neuroimaging. 5 (1995) 9–15. https://doi.org/https://doi.org/10.1111/jon1995519.
[10] A. Coskun, S. Kumandaş, A. Paç, O. Karahan, M. Guleç, M. Baykara, Childhood Guillain-BarrE Syndrome. MR Imaging in Diagnosis and Follow-Up, Acta Radiol. 44 (2003) 230–235. https://doi.org/10.1034/j.1600-0455.2003.00023.x.
[11] F. Iwata, Y. Utsumi, MR imaging in Guillain-Barre syndrome, Pediatr Radiol. 27 (1997) 36–38. https://doi.org/10.1007/s002470050059.
[12] H. Patel, B.P. Garg, M.K. Edwards, MRI of Guillain-Barré Syndrome, J Comput Assist Tomogr. 17 (1993).
[13] A. Grimm, B.F. Décard, A. Schramm, A.-K.K. Pröbstel, M. Rasenack, H. Axer, P. Fuhr, Ultrasound and electrophysiologic findings in patients with Guillain–Barré syndrome at disease onset and over a period of six months, Clinical Neurophysiology. 127 (2016) 1657–1663. https://doi.org/https://doi.org/10.1016/j.clinph.2015.06.032.
[14] G. Helms, H. Dathe, K. Kallenberg, P. Dechent, High-resolution maps of magnetization transfer with inherent correction for RF inhomogeneity and T1 relaxation obtained from 3D FLASH MRI, Magn Reson Med. 60 (2008) 1396–1407. https://doi.org/10.1002/mrm.21732.
[15] R.D. Dortch, L.M. Dethrage, J.C. Gore, S.A. Smith, J. Li, Proximal nerve magnetization transfer MRI relates to disability in Charcot-Marie-Tooth diseases, Neurology. 83 (2014) 1545–1553. https://doi.org/10.1212/WNL.0000000000000919.
Figures