1187
Effects of free breathing on cerebrospinal fluid hydrodynamics: a study based on real-time phase-contrast MRI1CHIMERE UR 7516, Jules Verne University of Picardy, Amiens, France, 2Medical Image Processing Department, Amiens Picardy University Hospital, Amiens, France, 3Radiology Department, Amiens Picardy University Hospital, Amiens, France, 4Neurosurgery Department, Amiens Picardy University Hospital, Amiens, France
Synopsis
Keywords: Neurofluids, Neurofluids, breathing effects, cerebrospinal fluid, real time phase contrast
The effect of breathing on CSF is not well understood. Real-time phase-contrast MRI can quantify CSF flow continuously. A time-domain multi-parameter analysis method was developed to quantify the effect of free breathing on CSF. It was found that the cardiac period and the average stroke volume of CSF at second-to-third cervical vertebrae level and at the aqueduct were significantly increased during the expiratory phase, while the net flow of CSF was notably decreased.Introduction
A better understanding of the cerebrospinal fluid (CSF) hydrodynamics is essential for the diagnosis of a number of neurological disorders1,2. In addition to the cardiac contribution, breathing also affects CSF dynamics. Unfortunately, conventional phase contrast sequences with the aid of cardiac gating can only provide a reconstructed mean cardiac cycle flow curve and thus cannot study the effect of breathing on CSF3. An increasing number of studies are beginning to use real-time phase contrast (RT-PC) sequences to study the effect of breathing on CSF dynamics4-8.Most of these studies quantify the effect of different breathing patterns on CSF by power spectrum analysis. However, this method can only quantify the effect of breathing on the net CSF flow rate. Compared to other breathing patterns, the effect of free breathing (E-Fb) on CSF is smaller and more difficult to quantify. Therefore, this study aims to quantify the E-Fb on CSF using a multiparametric time-domain analysis method.
Methods
− Image acquisition10 healthy volunteers (age: 19~29; 5 women) were examined using a clinical 3T scanner, and a 32 channels head coil. A chest belt was set up to record the free breathing signals.
The RT-PC used in this study was a multi-shot, gradient-recalled echo-planar imaging sequence with a Cartesian trajectory and parallel acquisition technology. Parameters were as follows: SENSE=2.5, EPI-factor=7, FOV=140*140mm2, pixel size acquisition=70*70mm2. VENC, time resolution, TE/TR and number of images are shown in Fig.1-B. Direction from foot to head is defined as positive.
As shown in Fig.1-A, RT-PC sequences were acquired from two planes to quantify the CSF flow: at the aqueduct (Fig.1-C) and at the second-to-third cervical vertebrae position (C2-C3) (Fig.1-D).
− Image Processing
All image and signal processing were performed using software – Flow 2.09,10.
First, the continuous CSF flow rate signal is extracted after segmentation and background field correction process. Then, from this signal, the software automatically locates the maximum or minimum value of each CCFC to obtain multiple independent CCFCs (Fig.1-E red points). Each CCFC contains five parameters: net flow rate, net stroke-volume (Net-StV), amplitude, average stroke-volume (Aver-StV) and cardiac period.
− Reconstruction of the average CCFC
The average CCFC was reconstructed using all CCFCs to quantify the CSF parameters (Fig.2-A&C). Net-StV is the sum of the positive and negative stroke-volume, and Aver-StV is the average of the absolute values of the positive and negative stroke-volume.
− Quantification of the E-Fb on CSF
The time-domain multi-parameter analysis method has been used in previous studies11,12. The inspiratory and expiratory phases were defined using the breathing signal (Fig.2-B), and then the CCFCs within the inspiratory phase were reconstructed as CCFC-Inspi; similarly, with CCFC-Expi. From CCFC-Expi and CCFC-Inspi, the difference between expiratory and inspiratory phases (DiffEx-In) was calculated for each parameter (Fig.2-D).
We assumed that a non-zero phase delay (Shift) maximizes the value of DiffEx-In for each parameter. Only by finding the appropriate Shift the E-Fb intensity can be correctly quantified. For this purpose, a curve with Shift, as the independent variable, and DiffEx-In, as the dependent variable, was automatically estimated by the software. For each parameter, the maximum or minimum DiffEx-In and its corresponding Shift were extracted (Fig.3).
Results
The stroke volume of CSF at C2-C3 and in the aqueduct is 657±163 mm3 and 61±33 mm3, respectively (Fig.4).CSF at C2-C3 shows a greater tendency to flow toward the spinal canal during the expiratory phase than during the inspiratory phase. Likewise, a greater volume of CSF is drained from the aqueduct into the fourth ventricle during the expiratory phase (Net-StV in Fig.4). During the expiration, the average stroke-volume of CSF at C2-C3 and in the aqueduct is increased (Aver-StV in Fig.4).The E-Fb (DiffEx-In and Shift) on Net-StV is correlated with the E-Fb on Net-Flow. The E-Fb on Aver-StV and Cardiac period are correlated (Fig.5).
Discussion
The values of CSF parameters quantified in this study using RT-PC are in reasonable agreement with the previous studies13,14. Net-flow and Net-StV values are mainly influenced by the background field correction resulting from image processing, which makes these values rather irrelevant15. However, what could be indeed a clinically relevant parameter is the E-Fb on Net-flow and Net-StV.The E-Fb on multiple CSF parameters was successfully quantified using a time-domain analysis method proposed in this study. It is also confirmed that the E-Fb on each parameter can only be correctly quantified by considering a phase shift.
E-Fb on Net-StV and Aver-Stv are two very important parameters of CSF hydrodynamics and their Shift were shown to be different. For example, the E-Fb on CSF at C2-C3 during the expiratory phase increases in the cardiac period (DiffEx-In=7.7%, Shift=34%) and in the Aver-StV (DiffEx-In=122 mm3, Shift=38%), while it decreases in Net-StV (DiffEx-In=-263 mm3, Shift=6.5%). This interesting phenomenon seems to be a positive response to stabilize intracranial pressure. Evaluation of E-Fb on CSF may suggest potential markers for the diagnosis of some neurological disorders.
Conclusion
Using RT-PC combined with post-processing software and analysis methods, the effect of free breathing on multiple CSF parameters was successfully quantified despite its complex hydrodynamics. These new findings will provide a valuable reference for subsequent studies on the effects of breathing on cerebral circulation and clinical diagnosis.Acknowledgements
This research was supported by EquipEX FIGURES (Facing Faces Institute Guiding Research), European Union Interreg REVERT Project, Hanuman ANR-18-CE45-0014 and Region Haut de France. Thanks to the staff members at the Facing Faces Institute (Amiens, France) for technical assistance. Thanks to David Chechin from Phillips industry for his scientific support.References
- Balédent O, Idy-peretti I. Cerebrospinal fluid dynamics and relation with blood flow: a magnetic resonance study with semiautomated cerebrospinal fluid segmentation. Investigative radiology. 2001 Jul 1;36(7):368-77.
- Alperin N, Lee SH, Loth F, Raksin P, Lichtor T. MR-Intracranial Pressure (ICP): A method for noninvasive measurement of intracranial pressure and elastance. Baboon and Human Study. Radiology. 2000;217(3):877-85. https://doi.org/10.1148/radiology.217.3.r00dc42877.
- Pelc NJ, Herfkens RJ, Shimakawa A, Enzmann DR. Phase contrast cine magnetic resonance imaging. Magnetic resonance quarterly. 1991 Oct 1;7(4):229-54.
- Balédent O, Liu P, Lokossou A, Fall S, Metanbou S, Makki M. Real-time phase contrast magnetic resonance imaging for assessment of cerebral hemodynamics during breathing. In ISMRM 2019-International Society for Magnetic Resonance in Medicine 2019 May 11. https://hal.archives-ouvertes.fr/hal-03736882.
- Dreha-Kulaczewski S, Joseph AA, Merboldt KD, Ludwig HC, Gärtner J, Frahm J. Inspiration is the major regulator of human CSF flow. Journal of neuroscience. 2015 Feb 11;35(6):2485-91. https://doi.org/10.1523/JNEUROSCI.3246-14.2015.
- Aktas G, Kollmeier JM, Joseph AA, Merboldt KD, Ludwig HC, Gärtner J, Frahm J, Dreha-Kulaczewski S. Spinal CSF flow in response to forced thoracic and abdominal respiration. Fluids and Barriers of the CNS. 2019 Dec;16(1):1-8. https://doi.org/10.1186/s12987-019-0130-0.
- Yildiz S, Thyagaraj S, Jin N, Zhong X, Heidari Pahlavian S, Martin BA, Loth F, Oshinski J, Sabra KG. Quantifying the influence of respiration and cardiac pulsations on cerebrospinal fluid dynamics using real‐time phase‐contrast MRI. Journal of Magnetic Resonance Imaging. 2017 Aug;46(2):431-9. https://doi.org/10.1002/jmri.25591.
- Chen L, Beckett A, Verma A, Feinberg DA. Dynamics of respiratory and cardiac CSF motion revealed with real-time simultaneous multi-slice EPI velocity phase contrast imaging. Neuroimage. 2015 Nov 15;122:281-7. https://doi.org/10.1016/j.neuroimage.2015.07.073.
- Liu P, Fall S, Balédent O. Flow 2.0-a flexible, scalable, cross-platform post-processing software for realtime phase contrast sequences. In ISMRM 2022-International Society for Magnetic Resonance in Medicine 2022 May 7. https://doi.org/10.48550/arXiv.2207.12712
- Liu P, Lokossou A, Fall S, Makki M and Bamendent O, 2019. Post Processing Software for Echo Planar Imaging Phase Contrast Sequence. ISMRM 27th, (4823).
- Liu P, Fall S, Metanbou S, Balédent O. Real-Time Phase Contrast MRI to quantify Cerebral arterial flow change during variations breathing. In ISMRM 2022-International Society for Magnetic Resonance in Medicine 2022 May 7. https://hal.archives-ouvertes.fr/hal-03736876.
- Liu P, Fall S, Balédent O. Use of real-time phase-contrast MRI to quantify the effect of spontaneous breathing on the cerebral arteries. NeuroImage. 2022 Jun 7:119361. https://doi.org/10.1016/j.neuroimage.2022.119361.
- Spijkerman JM, Geurts LJ, Siero JC, Hendrikse J, Luijten PR, Zwanenburg JJ. Phase contrast MRI measurements of net cerebrospinal fluid flow through the cerebral aqueduct are confounded by respiration. Journal of Magnetic Resonance Imaging. 2019 Feb;49(2):433-44. https://doi.org/10.1002/jmri.26181.
- Lokossou A, Metanbou S, Gondry-Jouet C, Balédent O. Extracranial versus intracranial hydro-hemodynamics during aging: a PC-MRI pilot cross-sectional study. Fluids and Barriers of the CNS. 2020 Dec;17(1):1-1. https://doi.org/10.1186/s12987-019-0163-4.
- Balédent O, Czosnyka M, Czosnyka ZH. Brain pulsations enlightened. Acta neurochirurgica. 2018 Feb;160(2):225-7. https://doi.org/10.1007/s00701-017-3436-1.
Figures
Figure 1: Workflow diagram of image acquisition and processing. The locations of the intracranial plane (blue) and extracranial plane (red) are shown in angiography images (A). The CSF information in the aqueduct (C) and at C2-C3 level (D) is extracted by RT-PC (B). After image processing (segmentation, background field correction, …) the continuous flow signal of CSF is obtained. The software automatically locates the minimum value of each cardiac cycle flow curve (CCFC) as a split point to extract multiple independent CCFCs (E).
Figure 2: Workflow chart for reconstruction of average CCFC, CCFC-Inspi and CCFC-Expi. Multiple CCFCs are first extracted from the continuous signal (A), and then inspiratory and expiratory cycles are defined using the breathing signal (B). The average CCFC is reconstructed using all the CCFCs (C). CCFC-Inspi and CCFC-Expi are reconstructed using the inspiratory and expiratory CCFCs, respectively (D). The DiffEx-In of each parameter is calculated by comparing CCFC-Inspi and CCFC-Expi (D).
Figure 3: DiffEx-In(shift) curves for each parameter evaluated (A). Influence of Shifts(%) variation in DiffEx-In. A Shift equals to 10% indicates that the breathing signal is shifted to the right by a distance of (average breathing period × 10%) seconds. B shows an example where the DiffEx-In on each parameter is calculated for a Shift equal to 41%. For this Shift, the DiffEx-In on Aver-StV, for example, presents the maximum value.
Figure 4: CSF parameters estimated at two locations (C2-C3 & aqueduct), and their E-Fb (DiffEx-In & Shift). In both locations, during the expiratory phase, the E-fb on Net-StV decreases and on Aver-Stv increases. Net-Stv = net stroke-volume, Aver-Stv = average stroke-volume.
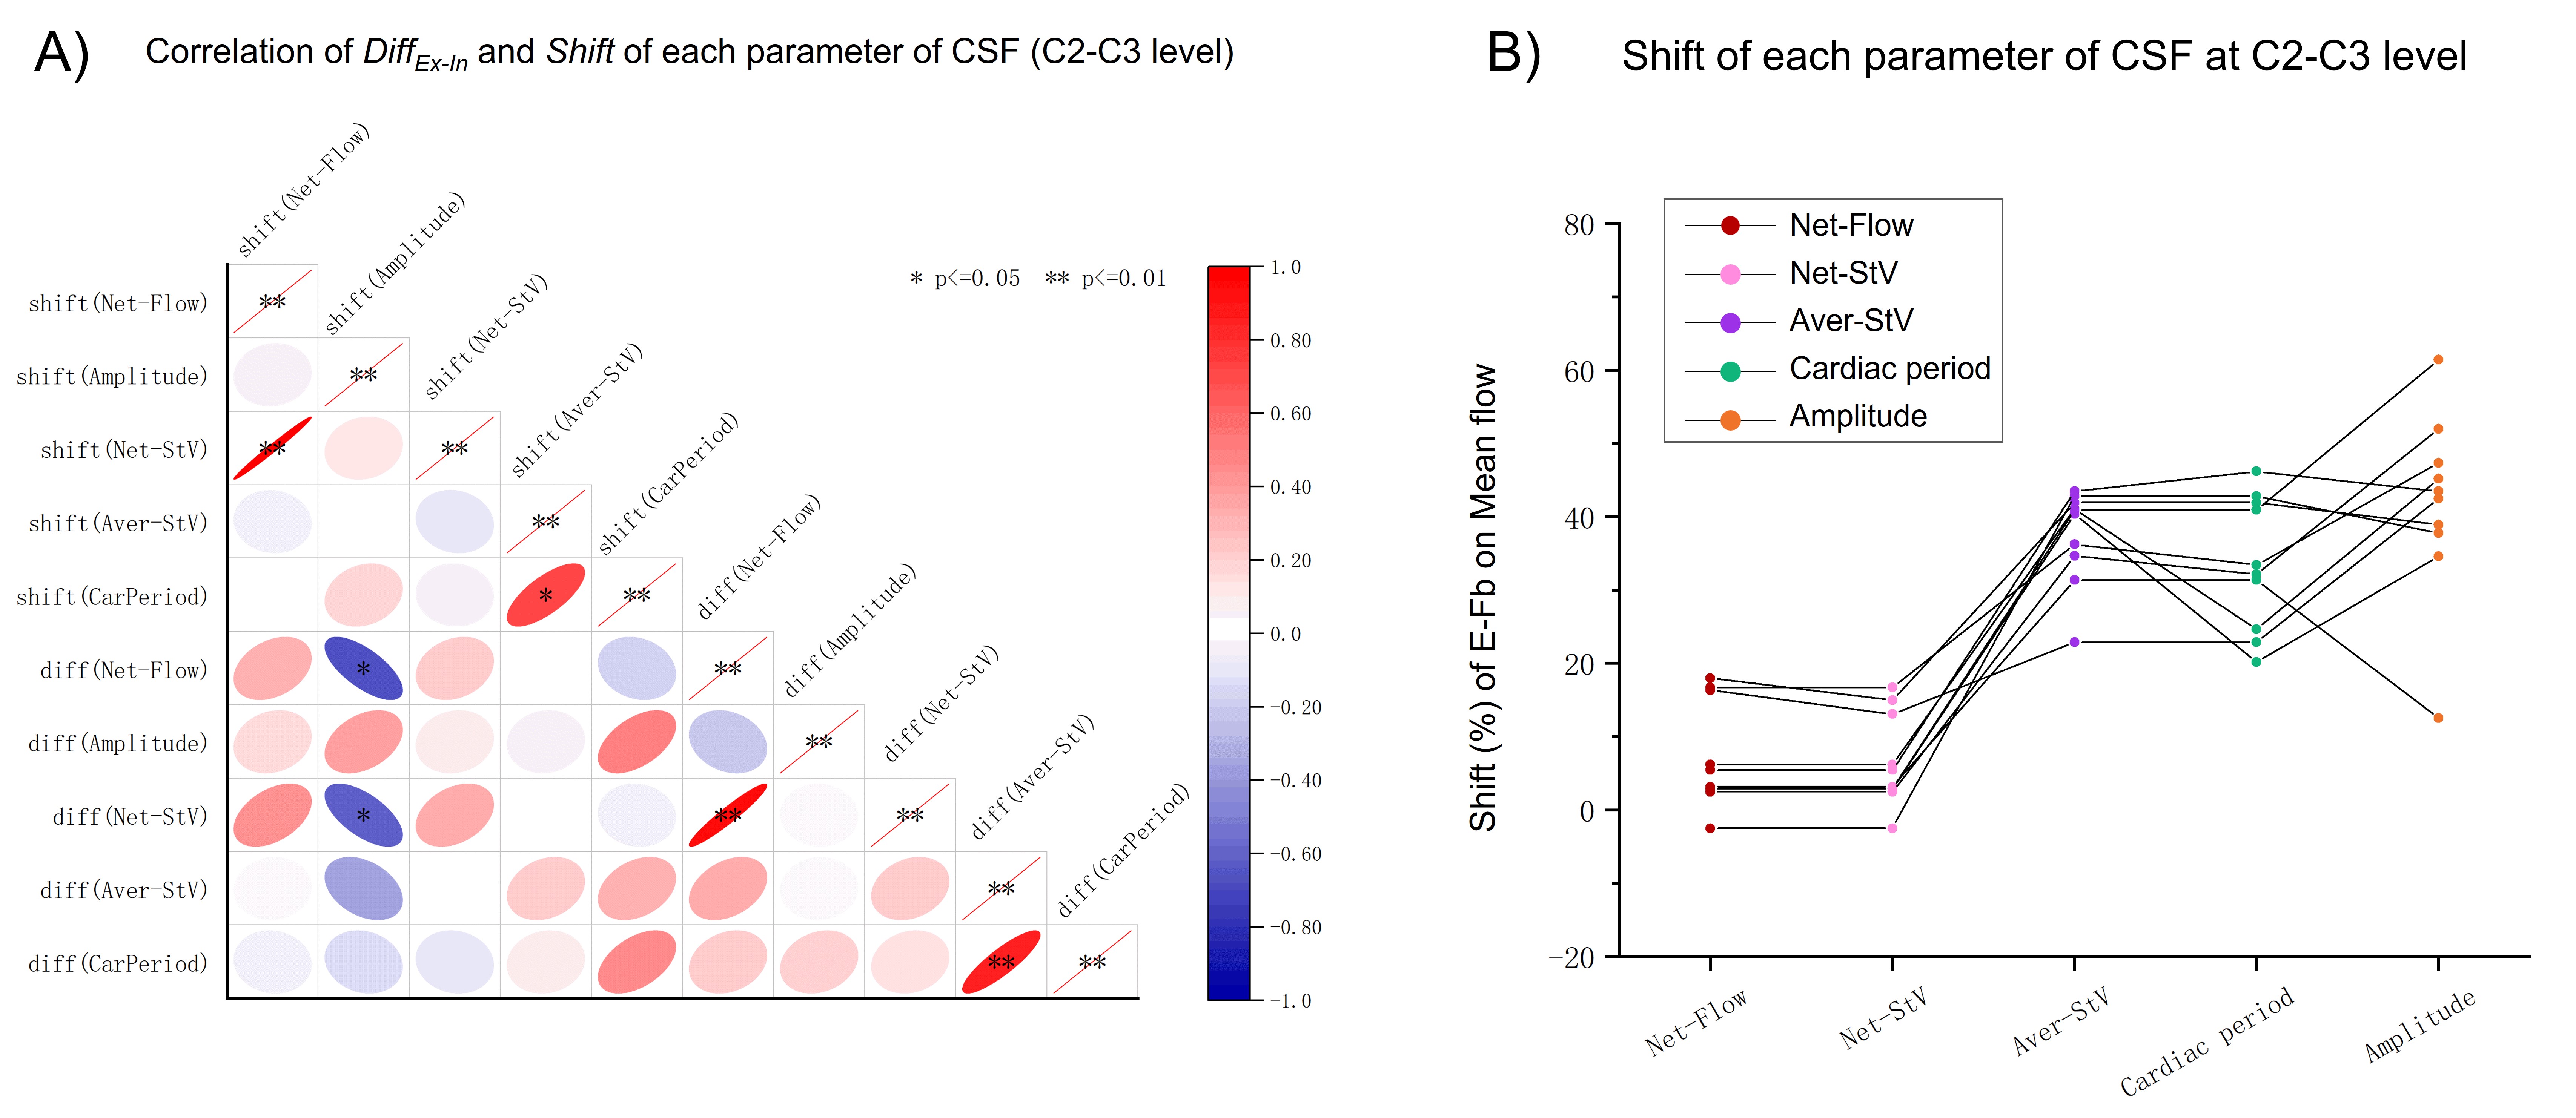
Figure 5: Correlation matrix of DiffEx-In and Shift (A) and the Shift distribution (B) of each parameter. A strong correlation is presented between the E-Fb on Net-StV and on Net-Flow. The E-Fb on Aver-StV is correlated with the E-Fb on cardiac period. * indicates p < 0.05, and ** indicates p < 0.01 for Spearman's test. CarPeriod indicates Cardiac Period.