1186
Estimation of CSF pulsations at the craniospinal junction using pseudo-continuous arterial spin labeling1KAIST, Daejeon, Korea, Republic of
Synopsis
Keywords: Neurofluids, Neurofluids, CSF pulsation, fMRI, CBF, pCASL
To measure CSF pulsation and CBF signals simultaneously with pCASL, we measured the influence of pCASL label pulse on the CSF signal at the craniospinal junction and compared the CSF signal differences and PC stroke volume to estimate CSF pulsation with pCASL. Our results showed that the variability of CSF signals at the nearby position from label pulses was negatively correlated with PC stroke volume. Based on this, the labeling pulse used for CBF tagging in pCASL also can be used for CSF pulsation estimation, and it will allow us to measure CBF and CSF pulsation simultaneously.Introduction
Recent research found that the brain activation-related signals and the cerebrospinal fluid (CSF) movement1, 2 are correlated to each other3. Regarding the mechanism how the activation signal and CSF movement make correlation, Yang et al (2022) suggested that the brain-activation-induced vasomotion increases the amount of cerebral blood flow (CBF) into cranial, which evokes the CSF outflow to the spine following the Monro-Kellie doctrine4. During the above CSF circulation, CSF bulk flow are considered to be driven by pulsations within the cranium5. Such CSF pulsation, however, is also induced by respiratory and cardiac cycles, which make it hard to be simultaneously measured with CBF changes in human. In this regard, we propose a method to estimate cardiac-gated CSF pulsation using pseudo-continuous arterial spin labeling (pCASL), which can also measure CBF simultaneously.Method
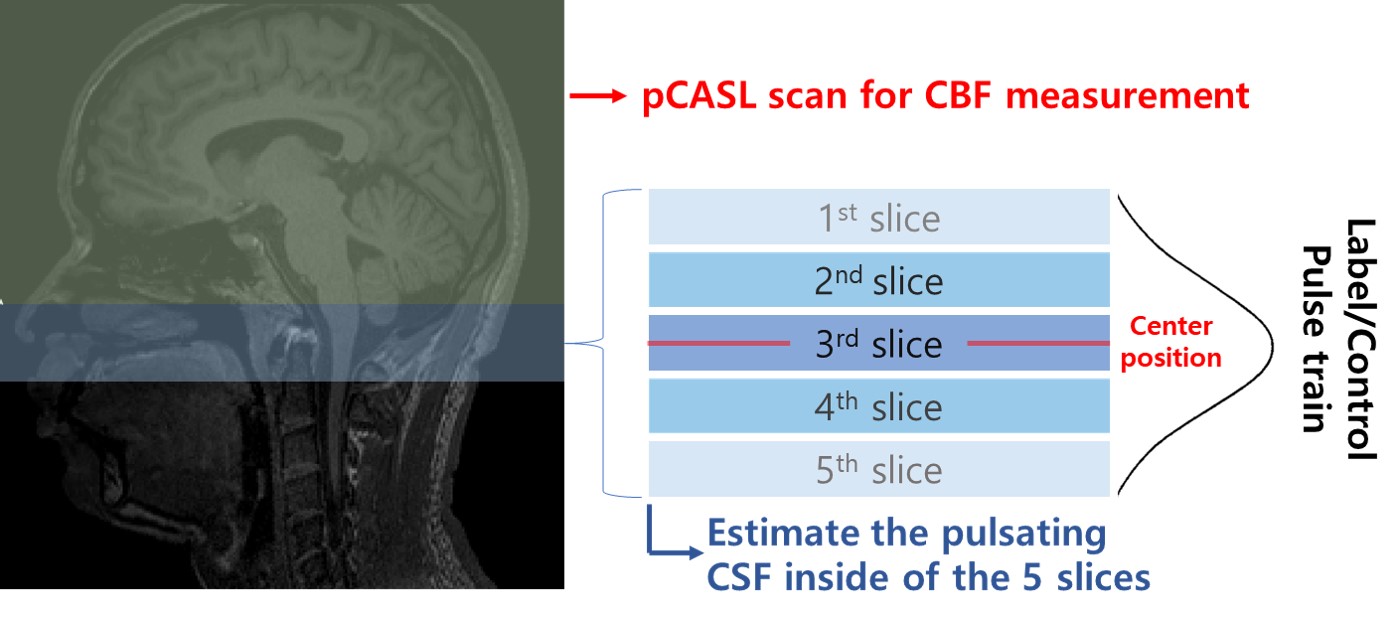
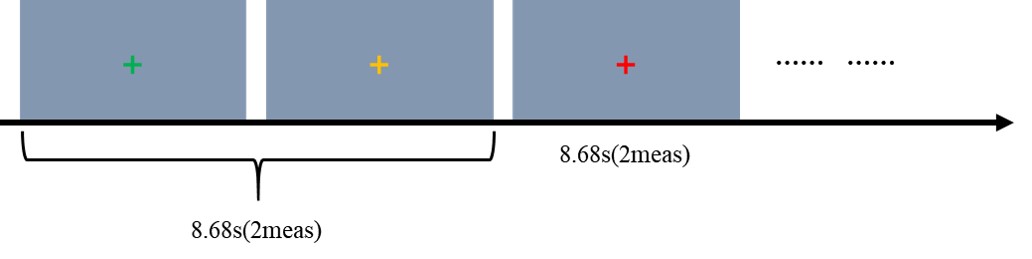
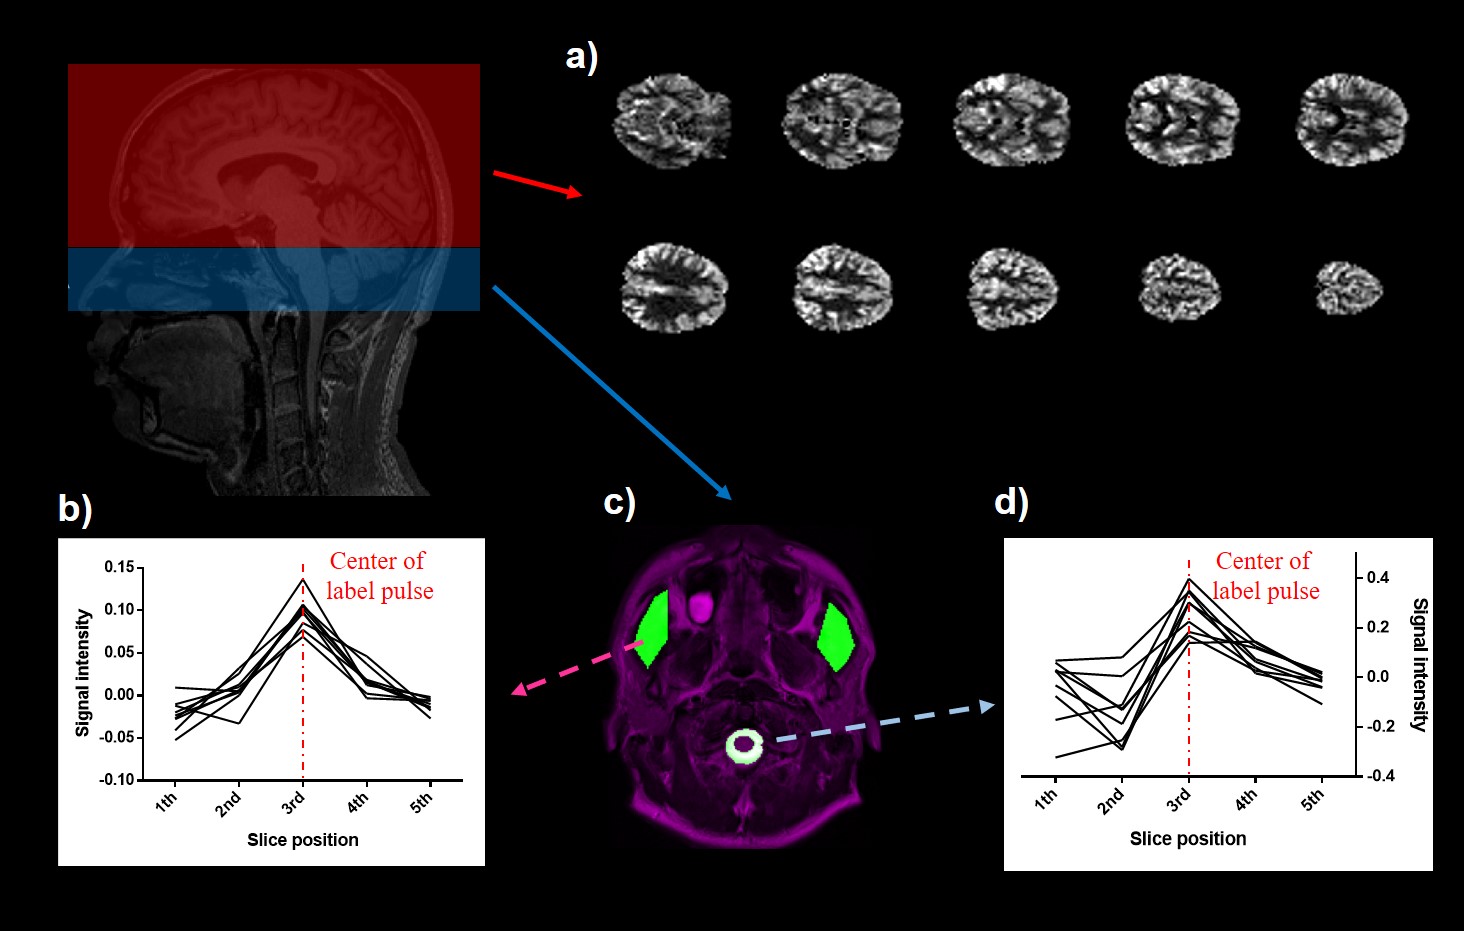
For the pCASL preparation part, we used 1.5s post labeling delay (PLD), 1.8s labeling duration, 67.5mm label plane offset6, and background suppression. 2D multi-slice echo planar imaging was used as the readout, in which the cortical region of the brain was scanned first (6th~23th slices) and then the ventricle part (1th~5th slices, see Figure 1) were scanned later. Imaging parameters of the pCASL readout scan were FOV = 230mm, voxel size = 3.6x3.6x6 mm, TR/TE = 4340/14ms. The phase contrast (PC) MRI was used for comparison reference and the center slice of PC-MRI was set to be the same position as the center of the pCASL label plane. Imaging parameters for PC-MRI were FOV = 230 mm, velocity encoding = 10cm/s, slice thickness = 5mm. We scanned 9 participants (age : 21~30, 3 females) on a SIEMENS Trio 3T-MRI. To control the CSF movement driven by the participant's respiration7, participants were instructed to perform the breath-holding (BH) task during phase contrast and pCASL scan (Figure 2). For the CSF pulsation measurement, when the pCASL label pulse train is applied at the craniospinal junction, higher CSF pulsations would make more variability for the CSF signal in nearby slices, therefore, we used standard deviation values of CSF signal changes extracted from the 5 slices at the craniospinal junction during label scans to represent the CSF pulsation. We assumed that the variability of the CSF signals in the 1st to 5th slices was the effect of the movement of the CSF whose signal was reduced by the label pulses. The standard deviation value of each slice was set as the variability of the slice.Result
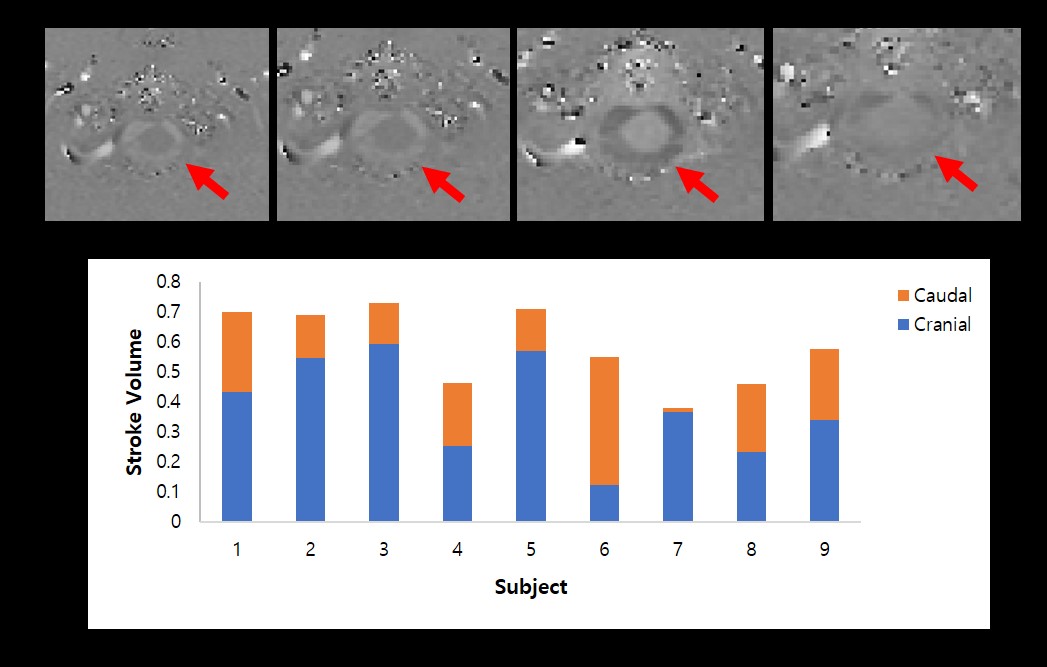
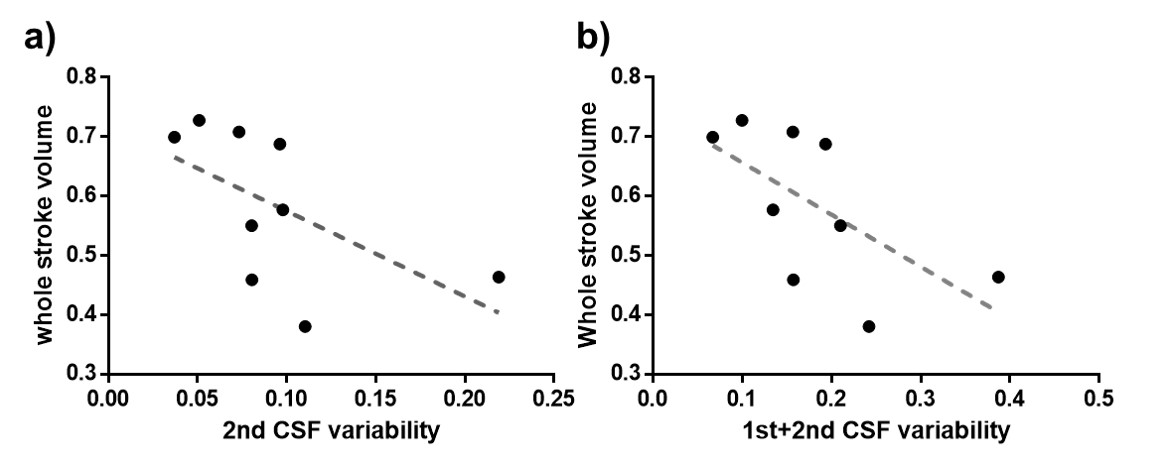
We compared the signals from the muscle and CSF to clarify signal changes caused by label/control pulse trains. For muscle, the signal intensity was distributed symmetrically from 1st~5th (p>.05). But for CSF, the signal intensity was asymmetrically distributed across 1st~5th slices, and the signal from the 4th slice was significantly higher than that from the 2nd slice (p<.05). These CSF results were acquired simultaneously with CBF map (Figure 3). Results of the correlation analysis between standard deviation of CSF signals from 1st~5th slices and stroke volume from PC MRI demonstrated significant negative correlation between CSF variability from 2nd slices and whole stroke volume (r = -0.733; p<.05), and summed CSF variabilities in the first and second slices also showed negative correlation with whole stroke volume (r = -0.733, p<.05). And also, summed CSF variabilities in the 3rd and 4th slices showed negative correlation with caudal stroke volume (r =-0.7, p<.05). The CSF variabilities during control periods, however, showed no significant correlations with PC stroke volume across all slices (all p>.05).Discussion
As a result of control-label subtraction, the signal of static tissue, such as muscle, changed symmetrically between slices 1 to 5 in the signal intensity change due to the label pulse, but the signal of CSF was significantly lowered in the second slice (or higher in the 4th slice). The significant negative correlations between CSF variabilities from the 2nd slices and the PC stroke volume may be explained as follows. In the experimental conditions in our study, the CSF pulsation in the cranial direction was relatively stronger than that in the caudal direction based on the PC MRI study (Figure 4). When the CSF affected by the label pulse moves in the cranial direction with pulsation, the CSF signal of slices 1 and 2 is relatively less affected by the label pulse, so the CSF variability of those slices decreases, but the cranial stroke volume increases. As a result, it is considered to show a negative correlation between the two indicators. The negative correlation between CSF variability from 3rd-4th slice and caudal stroke volume can also be explained in the same manner.Conclusion
In this study, we measured the influence of pCASL label pulse on the CSF signal at the craniospinal junction, a position typically used as pCASL labeling for CBF mapping, and compared the CSF signal differences and PC stroke volume to estimate CSF pulsation with pCASL. We found that the variability of CSF signals on the nearby position from label pulses has a significant negative relationship with CSF pulsation, therefore can potentially be used for quantification of CSF pulsation. This approach will allow us to measure CBF and CSF pulsation simultaneously using pCASL, which warrants further investigation.Acknowledgements
No acknowledgement found.References
1. Fultz, Nina E et al. “Coupled electrophysiological, hemodynamic, and cerebrospinal fluid oscillations in human sleep.” Science (New York, N.Y.) vol. 366,6465 (2019): 628-631. doi:10.1126/science.aax5440
2. Kim, J.-H., Im, J.-G., & Park, S.-H. “Measurement of CSF pulsation from EPI-based human fMRI.” Neuroimage 257 (2022): 119293. https://doi.org/10.1016/j.neuroimage.2022.119293
3. Han F, Chen J, Belkin-Rosen A, Gu Y, Luo L, et al. “Reduced coupling between cerebrospinal fluid flow and global brain activity is linked to Alzheimer disease–related pathology.” PLOS Biology 19(6) (2021): e3001233. https://doi.org/10.1371/journal.pbio.3001233
4. Yang H-C (Shawn), Inglis B, Talavage TM, et al. “Coupling between cerebrovascular oscillations and CSF flow fluctuations during wakefulness: An fMRI study.” Journal of Cerebral Blood Flow & Metabolism 42(6) (2022):1091-1103. doi:10.1177/0271678X221074639
5. Simon, M. J., & Iliff, J. J. “Regulation of cerebrospinal fluid (CSF) flow in neurodegenerative, neurovascular and neuroinflammatory disease.” Biochimica et Biophysica Acta (BBA) - Molecular Basis of Disease 1862(3) (2016): 442-451. https://doi.org/10.1016/j.bbadis.2015.10.014
6. Alsop DC, Detre JA, et al. “Recommended implementation of arterial spin-labeled perfusion MRI for clinical applications: A consensus of the ISMRM perfusion study group and the European consortium for ASL in dementia.” Magn Reson Med. 73(1) (2015): 102-16.
7.Yamada S, Miyazaki M, Yamashita Y, Ouyang C, Yui M, Nakahashi M, Shimizu S, Aoki I, Morohoshi Y, McComb JG. “Influence of respiration on cerebrospinal fluid movement using magnetic resonance spin labeling.” Fluids Barriers CNS 10(1) (2013): 36. doi: 10.1186/2045-8118-10-36.
Figures