1185
Clinical feasibility of contrast-enhanced ASL for blood-brain barrier water exchange rate measurements
Elizabeth Powell1, Ben Dickie2,3, Yolanda Ohene2,3, Geoff JM Parker1,4,5, and Laura M Parkes2,3
1Centre for Medical Image Computing, Medical Physics and Biomedical Engineering, University College London, London, United Kingdom, 2School of Health Sciences, Faculty of Biology, Medicine and Health, University of Manchester, Manchester, United Kingdom, 3Geoffrey Jefferson Brain Research Centre, Manchester Academic Health Science Centre, University of Manchester, Manchester, United Kingdom, 4Queen Square MS Centre, Institute of Neurology, University College London, London, United Kingdom, 5Bioxydyn Limited, Manchester, United Kingdom
1Centre for Medical Image Computing, Medical Physics and Biomedical Engineering, University College London, London, United Kingdom, 2School of Health Sciences, Faculty of Biology, Medicine and Health, University of Manchester, Manchester, United Kingdom, 3Geoffrey Jefferson Brain Research Centre, Manchester Academic Health Science Centre, University of Manchester, Manchester, United Kingdom, 4Queen Square MS Centre, Institute of Neurology, University College London, London, United Kingdom, 5Bioxydyn Limited, Manchester, United Kingdom
Synopsis
Keywords: Quantitative Imaging, Neurofluids, Blood-brain barrier water exchange
Contrast-enhanced ASL (CE-ASL) has been proposed as a method for measuring blood-brain barrier water exchange, and is a technique that could be used in conjunction with DCE/DSC-MRI to provide complementary information on brain vasculature.
We demonstrate in this work the clinical feasibility and consistency of the CE-ASL technique in simulations and in healthy volunteers. Using simulations, we characterise the expected accuracy and precision of parameter estimates. We then evaluate the consistency of CE-ASL measurements across six healthy volunteers.
Introduction
Blood-brain barrier (BBB) dysfunction is reported in numerous neurological conditions, including neurodegeneration, stroke and multiple sclerosis1,2,3. Water exchange (WEX) rate measurements across the BBB offer the potential for detecting disease earlier than conventional approaches that use the leakage of gadolinium-based contrast agents (GBCA)4.Preliminary experiments have demonstrated5,6 that contrast-enhanced ASL (CE-ASL) has potential for quantifying the WEX rate from blood to tissue (kb). To derive kb using ASL the intra- and extravascular signals must be separated, which is challenging in standard ASL data owing to the small T1 difference between compartments7. GBCAs remain largely in the blood pool when BBB permeability is low and increase the T1 difference between pools, thus enabling the signal components to be disentangled. We recently proposed an optimised CE-ASL protocol that balanced the inherent trade-off between GBCA dose and SNR arising because the shorter blood water T1 causes the ASL difference signal to decay more rapidly6.
In this work, we demonstrate the clinical feasibility of the optimised CE-ASL method by: (i) evaluating accuracy, precision and biases of kb estimates in simulations, and; (ii) assessing the consistency in six healthy volunteers.
Methods
SimulationsA two-compartment signal model accounting for finite water exchange between intra- and extravascular compartments was employed8. Simulated tissue parameters are in Table 1; simulated sequence parameters were matched to the in vivo acquisition.
Systematic biases in parameter estimates arising from T1 errors of ±15% in tissue, $$$T_{1,e}$$$, blood pre-contrast, $$$T^{pre}_{1,b}$$$, and blood post-contrast, $$$T^{post}_{1,b}$$$ were evaluated using noise free simulations.
Accuracy and precision of fitted kb values were estimated using Monte Carlo simulations for 0.5≤kb≤4.0s-1. Zero-mean Gaussian noise was added to 2500 synthesised control and label signals for each parameter combination independently, giving voxel-wise SNR=15,30,45 in the unlabelled ASL data9. Voxel-level SNR values were increased by $$$\sqrt{N}$$$ (N the number of voxels) to simulate the higher SNR achievable with region of interest (ROI) analysis.
In vivo data acquisition and analysis
ASL data were collected in 6 healthy volunteers (age range 23-46 years; 5 female) on a 3T PET-MR scanner (GE Healthcare) using pCASL labelling, background suppression, 3D spiral FSE readout, voxel size 1.7×1.7×4mm3, TE=11ms, minimum TR set according to post-labelling delay (PLD), label duration 2s. Data were collected: pre-contrast at PLD=0.7,0.9,1.2,1.5,1.8,2.1s (PLD=0.7s not collected in two subjects) with 2 repeats (NEX); post-contrast at PLD=1.5s, NEX=5. A 0.025 mmol/kg (quarter) dose GBCA (Dotarem, Guerbet) injection was administered to obtain the optimal6 $$$T^{post}_{1,b}$$$.
Data for T1 mapping including $$$\text{B}_{1}^+$$$ correction were acquired pre- and post-contrast using a 3D T1-weighted SPGR with variable flip angles (2°, 5°, 15°, 20°) and TR/TE=13.5/1.08ms. $$$T_{1,b}$$$ was estimated from the superior sagittal sinus.
A 3D T1-weighted MPRAGE image (1mm3 isotropic resolution) was acquired prior to contrast agent injection for tissue segmentation.
The two-compartment model8 was fitted to the ASL data to estimate kb, cerebral blood flow f and arterial transit time tA.
Results
SimulationsError analyses (Figure 1) indicated that kb estimates were highly sensitive to errors in $$$T^{pre}_{1,b}$$$ and $$$T^{post}_{1,b}$$$; $$$T_{1,e}$$$ errors introduced less uncertainty. Accuracy and precision were better for slower ground truth kb values in simulations; biases were more severe at higher noise levels (Figure 2A). For an anticipated SNR=30 in vivo9, kb may be estimated in a cortical ROI with good accuracy (relative error <1\%; Figure 2B) and reasonable precision (coefficient of variation CoV=30%; Figure 2C). The CoV at the voxel-level was very high (190%).
In vivo
Figure 3 shows parameter maps for each subject. Reasonable left/right correspondence was observed; however, some subjects showed fit failures. Mean parameter values over different ROIs are shown in Figure 4. Averaged across subjects, parameter mean ± standard deviation values in left/right GM hemispheres were: f=51.4±12.2 / 51.1±12.6ml blood/min/100ml tissue, tA=1.22±0.11 / 1.20±0.12s, kb=1.40±1.16 / 1.49±1.4s-1.
Discussion
Average kb values in vivo were in line with literature values1,7,10,11, demonstrating CE-ASL is a viable method for BBB WEX measurements. Including multiple PLDs post-contrast and some PLD<0.7s could improve fit stability and thus clinical applicability in future.Simulations emphasised the need for reliable individual $$$T_{1,b}$$$ mapping. For $$$T_{1,b}$$$ biases that are systematic and thus consistent across subjects, group-level differences may still be identifiable. However, inter-subject variability in $$$T_{1,b}$$$ may exist owing to haematocrit levels and oxygen extraction fraction12; in this case, regional kb variations within subject could be studied instead.
Combining conventional DCE/DSC-MRI studies with CE-ASL acquisitions could be a clinically practical application of the method. ASL data acquired before and after a DCE/DSC-MRI protocol could utilise the residual concentrations in the blood of the GBCA injection to obtain the optimally-shortened6 $$$T^{post}_{1,b}$$$ needed for CE-ASL imaging. In cases where BBB damage is minor and DCE/DSC-MRI does not show significant uptake of the contrast agent in tissue4, concomitant acquisition of CE-ASL data could provide a complementary indication of subtle BBB breakdown.
Conclusions
CE-ASL can provide regional estimates of BBB permeability to water in an acquisition time of 20min. Manipulating the intravascular T1 using a GBCA enables separation of intra- and extravascular signals and the subsequent extraction of kb; however, estimated kb values must be interpreted carefully owing to dependencies on measured T1 values. The CE-ASL technique offers a useful new approach for quantification of subtle BBB damage.Acknowledgements
Thanks to GE Healthcare for their support. This work was supported by EPSRC grants EP/S031510/1 and EP/M005909/1.References
- Ben R Dickie, Geoff JM Parker, and Laura M Parkes. “Measuring water exchange across the blood-brain barrier using MRI”. In: Prog Nucl Magn Reson Spectrosc 116 (2020), pp. 19–39. doi: 10.1016/j.pnmrs.2019.09.002.
- YR Kim, E Tejima, S Huang, DN Atochin, G Dai, EH Lo, PL Huang, A Bogdanov, and BR Rosen. “In vivo quantification of transvascular water exchange during the acute phase of permanent stroke”. In: Magn Reson Med 60.4 (2008), pp. 813–821.
- Melanie D Sweeney, Abhay P Sagare, and Berislav V Zlokovic. “Blood–brain barrier break-down in Alzheimer disease and other neurodegenerative disorders”. In: Nat Rev Neurol 14.3 (2018), pp. 133–150.
- Ben R Dickie, Matthias Vandesquille, Jose Ulloa, Herve Boutin, Laura M Parkes, and Geoff JM Parker. “Water-exchange MRI detects subtle blood-brain barrier breakdown in Alzheimer’s disease rats”. In: NeuroImage 184 (2019), pp. 349–358.
- Helen Beaumont, Aimee Pearson, Matthias J van Osch, and Laura M Parkes. “Estimation of Water Exchange across the Blood Brain Barrier using Contrast-enhanced ASL”. In: Proceedings of the 24th Annual Meeting of ISMRM, Singapore (2016).
- Elizabeth Powell, Ben R Dickie, Yolanda Ohene, Geoff JM Parker, and Laura M Parkes.“Blood-brain barrier water exchange estimation using optimised contrast-enhanced ASL”. In: Proceedings of the 29th Annual Meeting of ISMRM, Virtual (2021).
- John P Carr, David L Buckley, Jean Tessier, and Geoff JM Parker. “What levels of precision are achievable for quantification of perfusion and capillary permeability surface area product using ASL?” In: Magn Reson Med 58.2 (2007), pp. 281–289.
- Laura M Parkes and Paul S Tofts. “Improved accuracy of human cerebral blood perfusion measurements using arterial spin labeling: Accounting for capillary water permeability”. In: Magn Reson Med 48.1 (2002), pp. 27–41.
- Joseph G Woods, Michael A Chappell, and Thomas W Okell. “A general framework for optimizing arterial spin labeling MRI experiments”. In: Magn Reson Med 81.4 (2019), pp. 2474–2488. doi: 10.1002/mrm.27580
- Guofan Xu, Howard A Rowley, Gaohong Wu, David C Alsop, Ajit Shankaranarayanan, Maritza Dowling, Bradley T Christian, Terrence R Oakes, and Sterling C Johnson. “Reliability and precision of pseudo-continuous arterial spin labeling perfusion MRI on 3.0 T and comparison with 15 O-water PET in elderly subjects at risk for Alzheimer’s disease”. In: NMR Biomed 23.3 (2010), pp. 286–293. doi: 10.1002/nbm.1462.
- AA Liu, HU Voss, JP Dyke, LA Heier, and ND Schiff. “Arterial spin labeling and altered cerebral blood flow patterns in the minimally conscious state”. In: Neurology 77.16 (2011), pp. 1518–1523. doi: 10.1212/WNL.0b013e318233b229.
- M. Johanna Silvennoinen, Mikko I. Kettunen, and Risto A. Kauppinen. “Effects of hematocrit and oxygen saturation level on blood spin-lattice relaxation”. In: Magn Reson Med49.3 (2003), pp. 568–571. doi: 10.1002/mrm.10370.
- David C Alsop et al. “Recommended implementation of arterial spin-labeled perfusion MRI for clinical applications: A consensus of the ISMRM Perfusion Study Group and the European Consortium for ASL in dementia”. In: Magn Reson Med 73.1 (2015), pp. 102–116. doi: 10.1002/mrm.25197.6
Figures
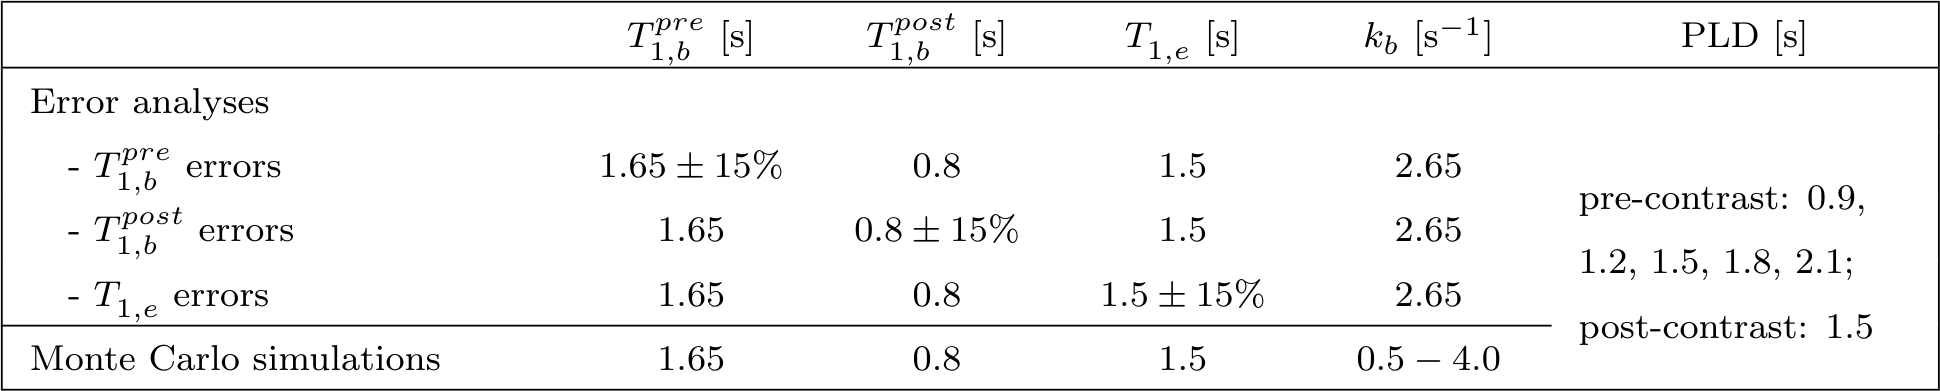
Table 1. Parameters used in simulations. For all simulations, other fixed parameters were: cerebral blood flow f=60ml blood/min/100ml tissue7, label duration tL=2s, arterial transit time tA=1.2s13 (note this is variable in vivo depending on labelling location and brain region), brain:blood partition coefficient λ=0.913 and inversion efficiency α=0.8513.
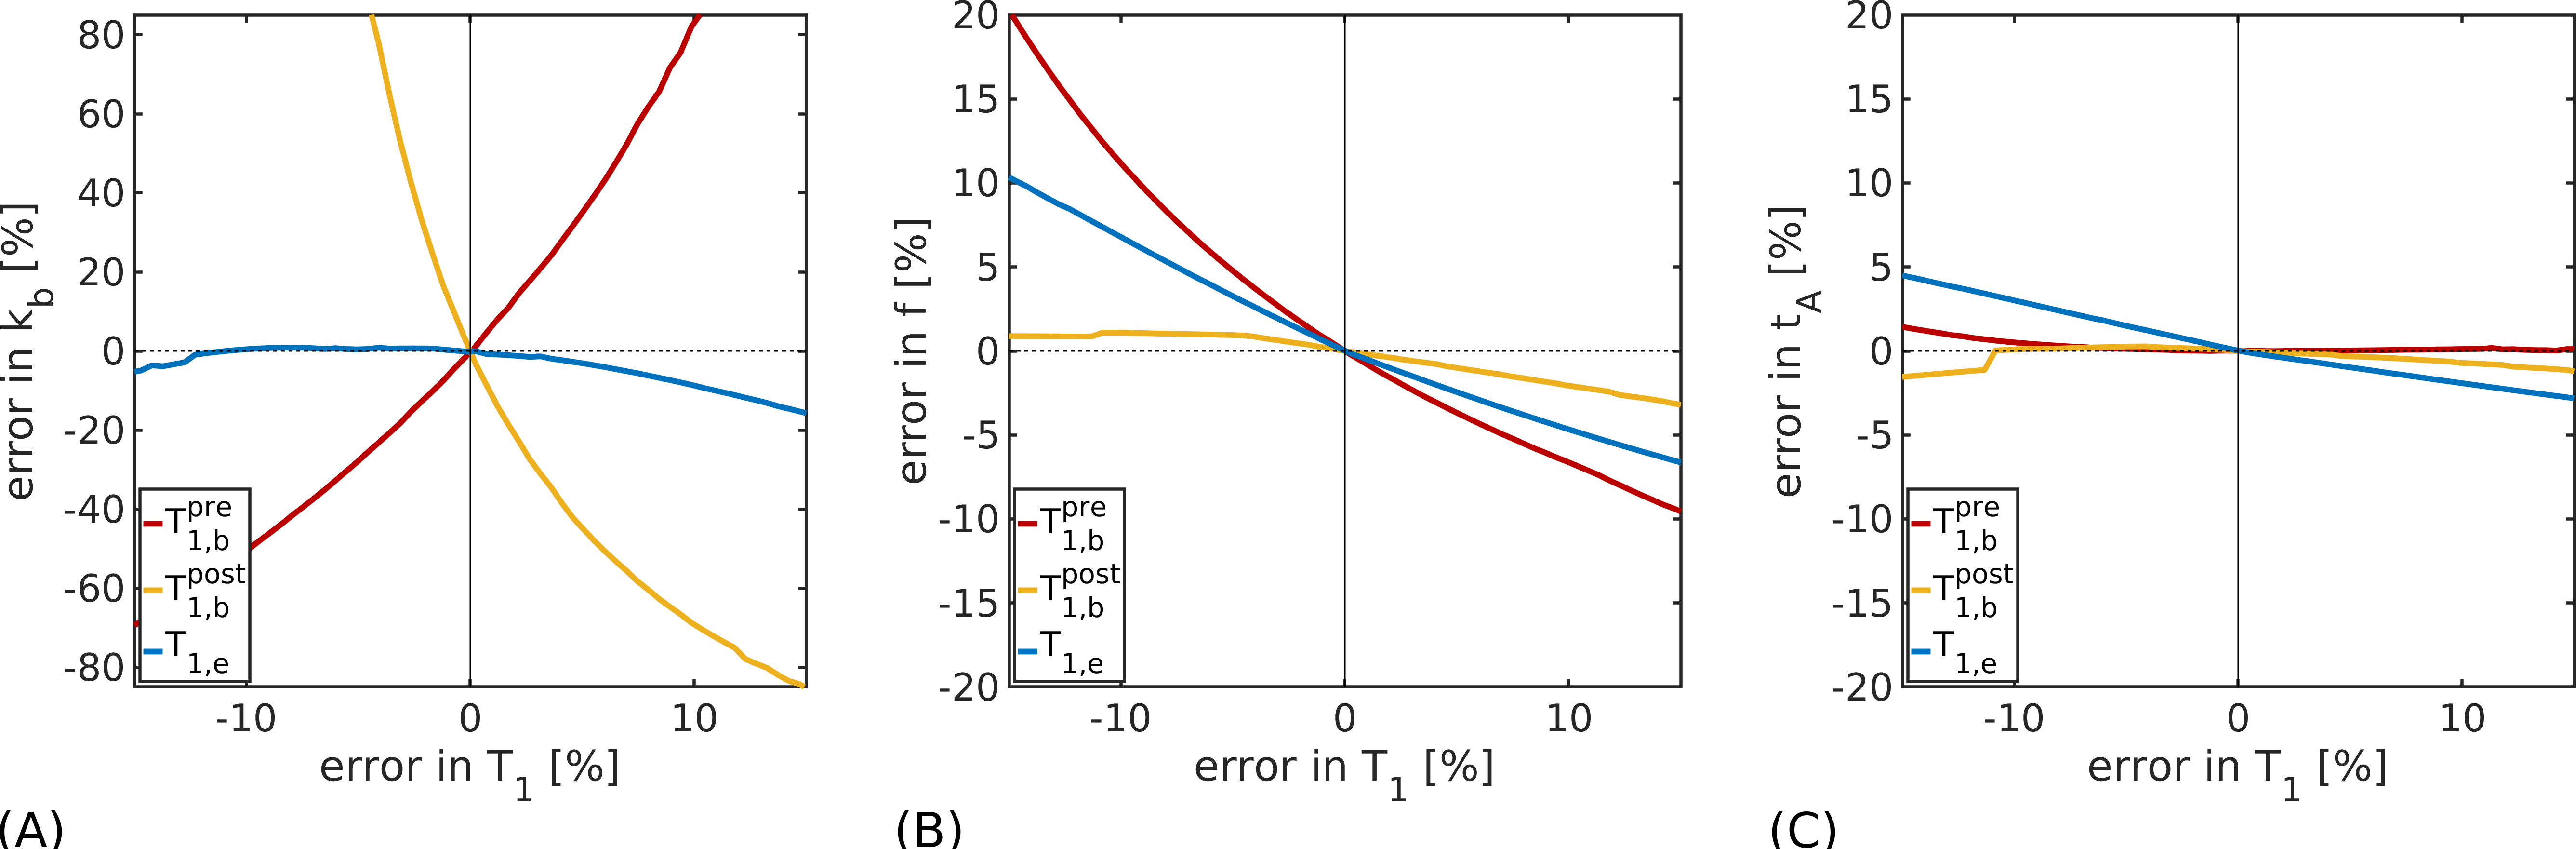
Figure 1. Error analysis simulations. The error propagated into fitted parameters from errors in T1 values is shown for: (A) the exchange rate, kb; (B) the cerebral blood flow, f, and; (C) the arterial transit time, tA. Estimates of kb are seen to be sensitive to errors in $$$T^{pre}_{1,b}$$$ and $$$T^{post}_{1,b}$$$; $$$T_{1,e}$$$ errors introduce less uncertainty. Other parameters (f and tA) show less dependency on T1 values.
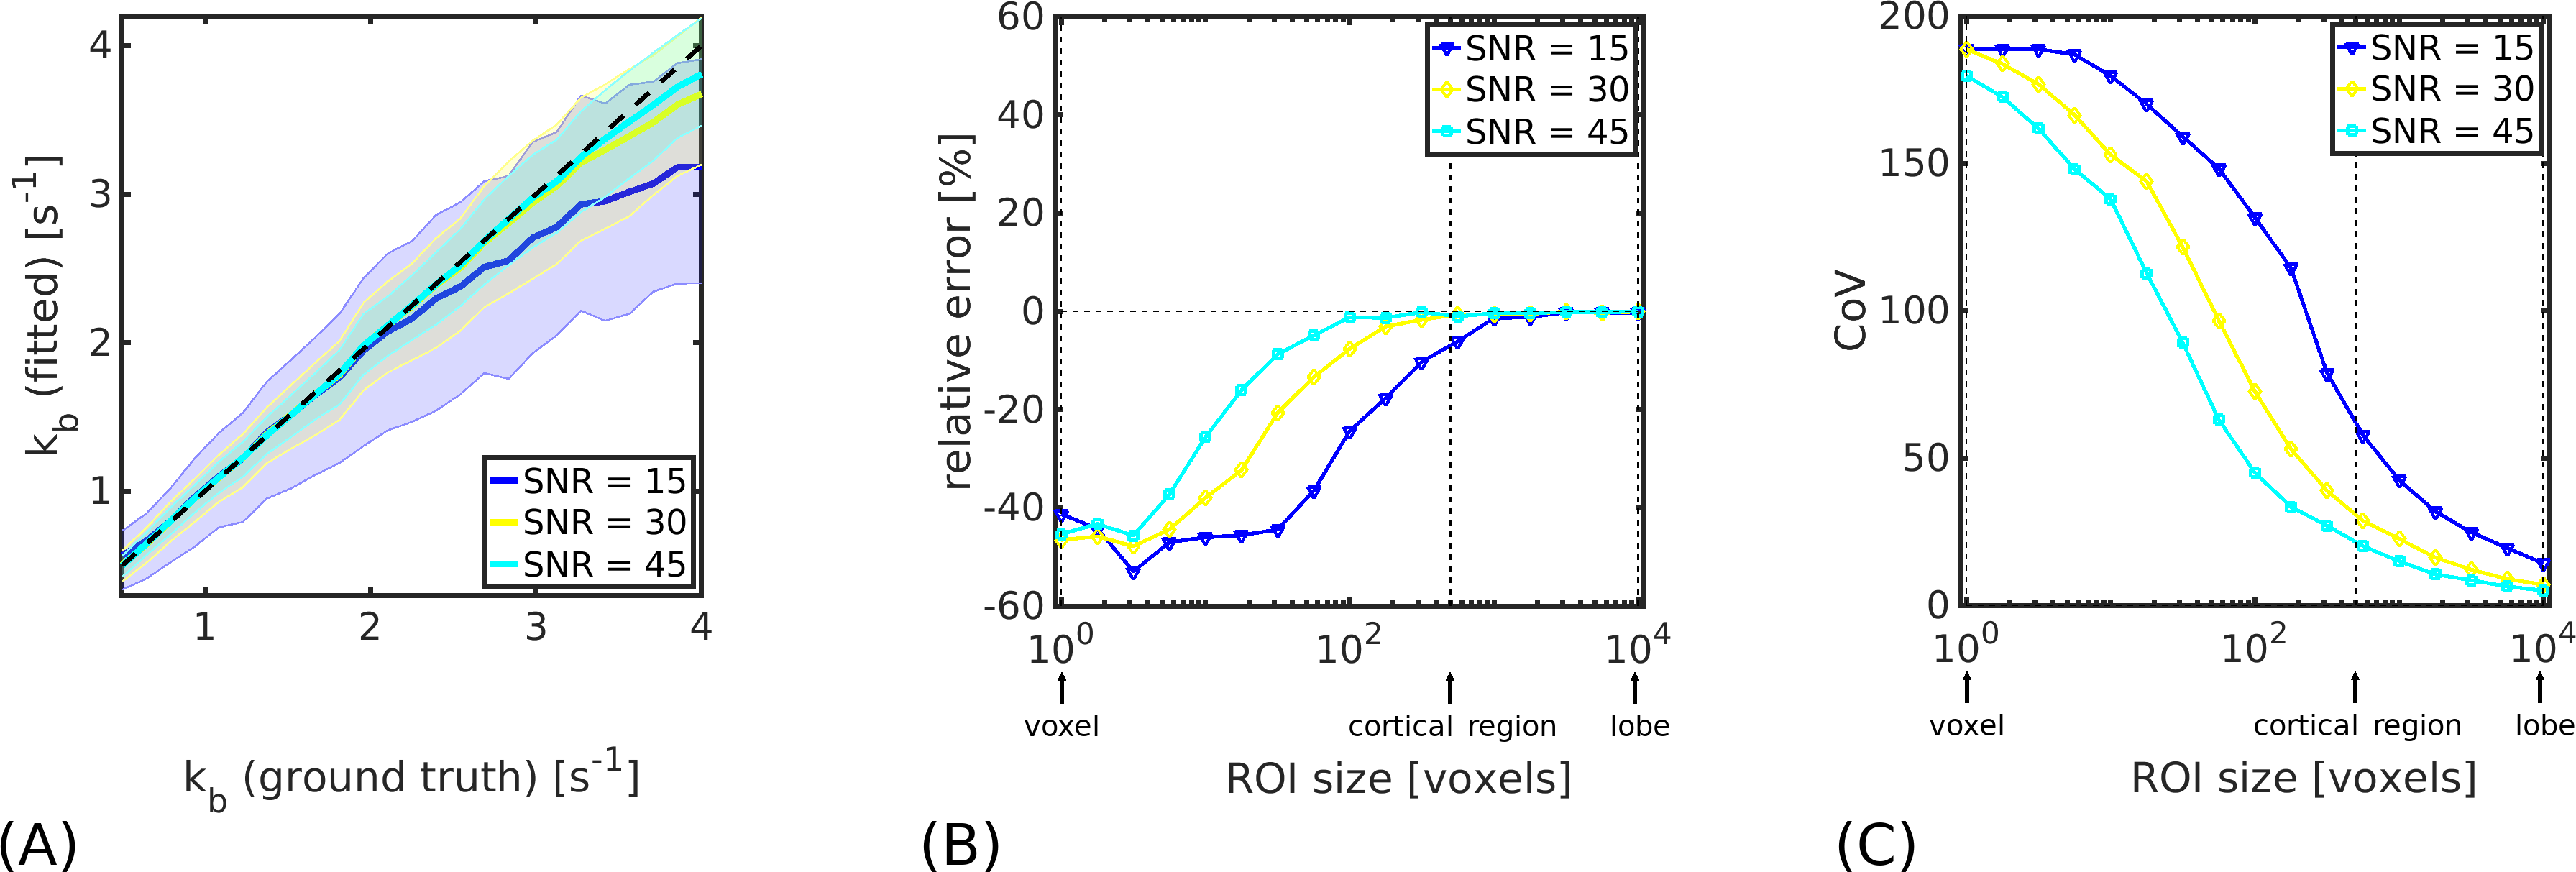
Figure 2. Monte Carlo simulations. (A). Median kb values (solid lines) for a simulated cortical ROI (500 voxels) are shown as a function of ground truth exchange rate. Shaded regions represent the inter-quartile range (IQR) of fitted values; black dashed lines indicate ground truth kb values. (B). Relative error in kb after signal averaging across different simulated ROI sizes. (C). CoV in kb for different ROI sizes. Displayed SNR levels show voxel-wise values in the control signal. At SNR=30, good accuracy and reasonable precision can be expected in kb estimated at the cortical level.
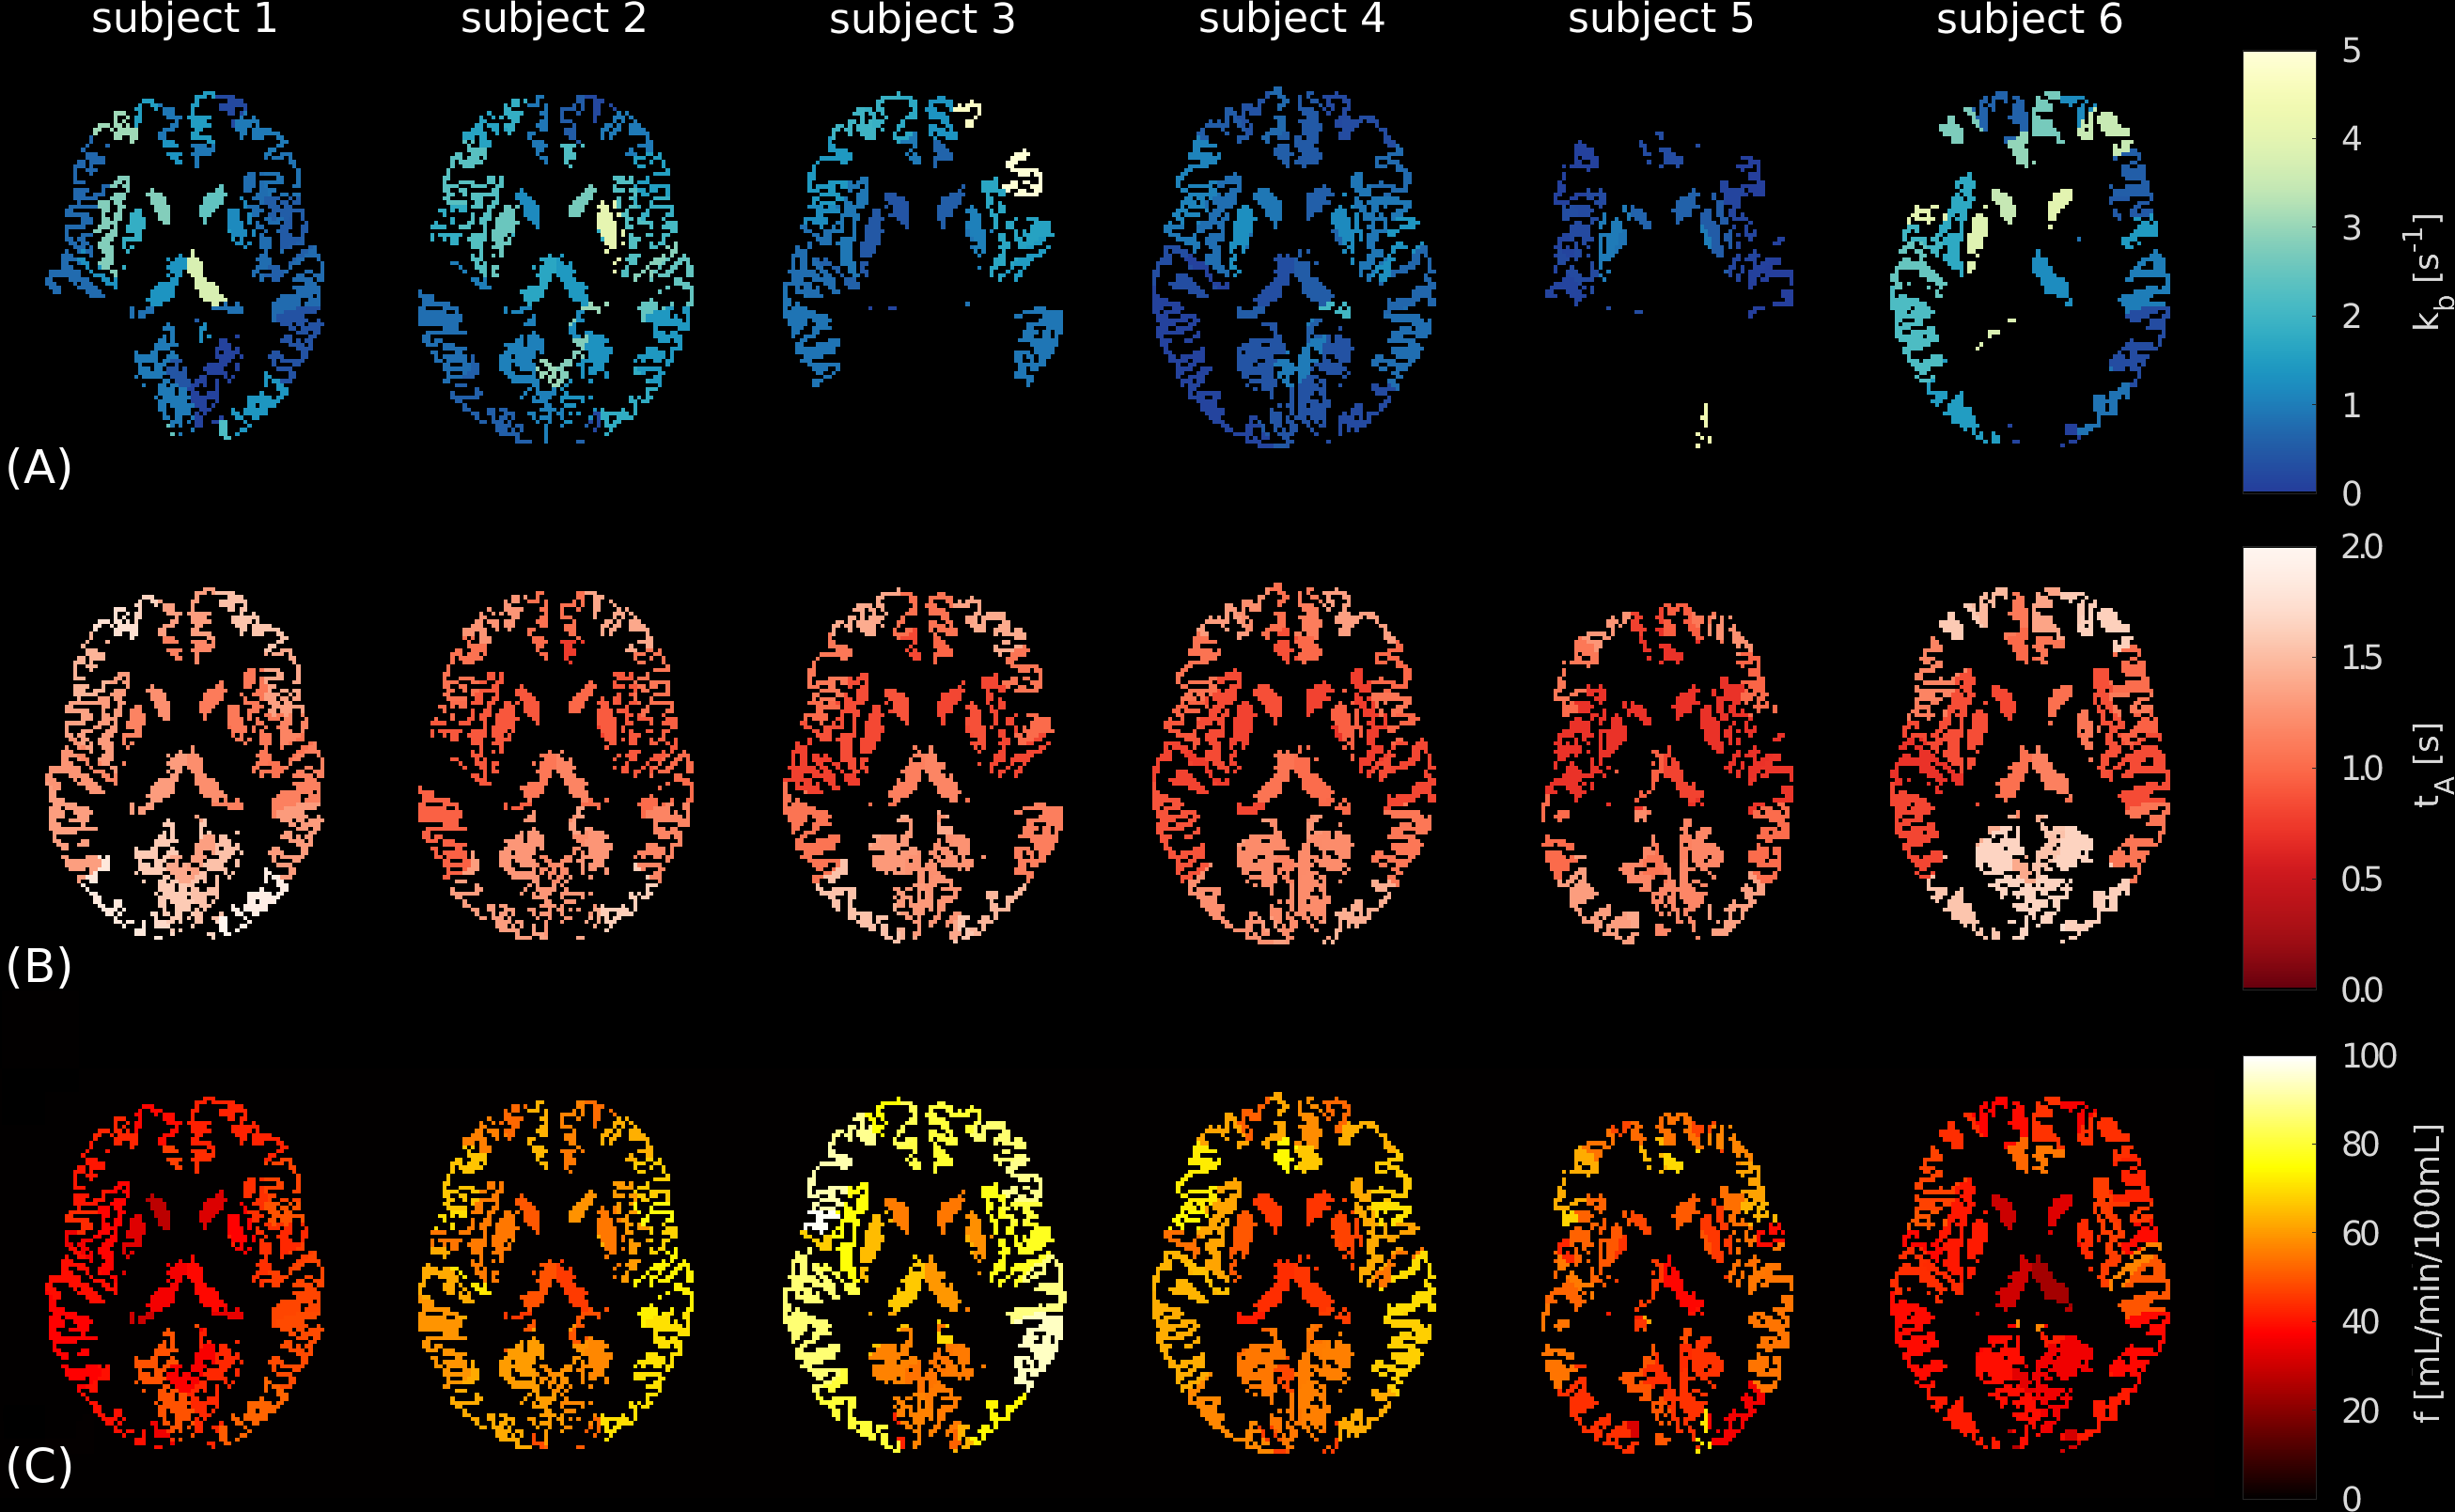
Figure 3. In vivo CE-ASL parameter maps. Regional parameter maps are shown for each subject for: (A) the exchange rate, kb; (B) the arterial transit time, tA, and; (C) the cerebral blood flow, f. Values are the median of voxel-wise fits in each region; black voxels indicate masked WM/CSF and extreme fits in GM (i.e. kb<0s-1 or kb>10s-1). The automatic anatomical labelling (AAL) atlas was used to define regions. Parameter maps are reasonably consistent inter-subject (although some kb maps show several extreme fits) as well as between hemispheres intra-subject.
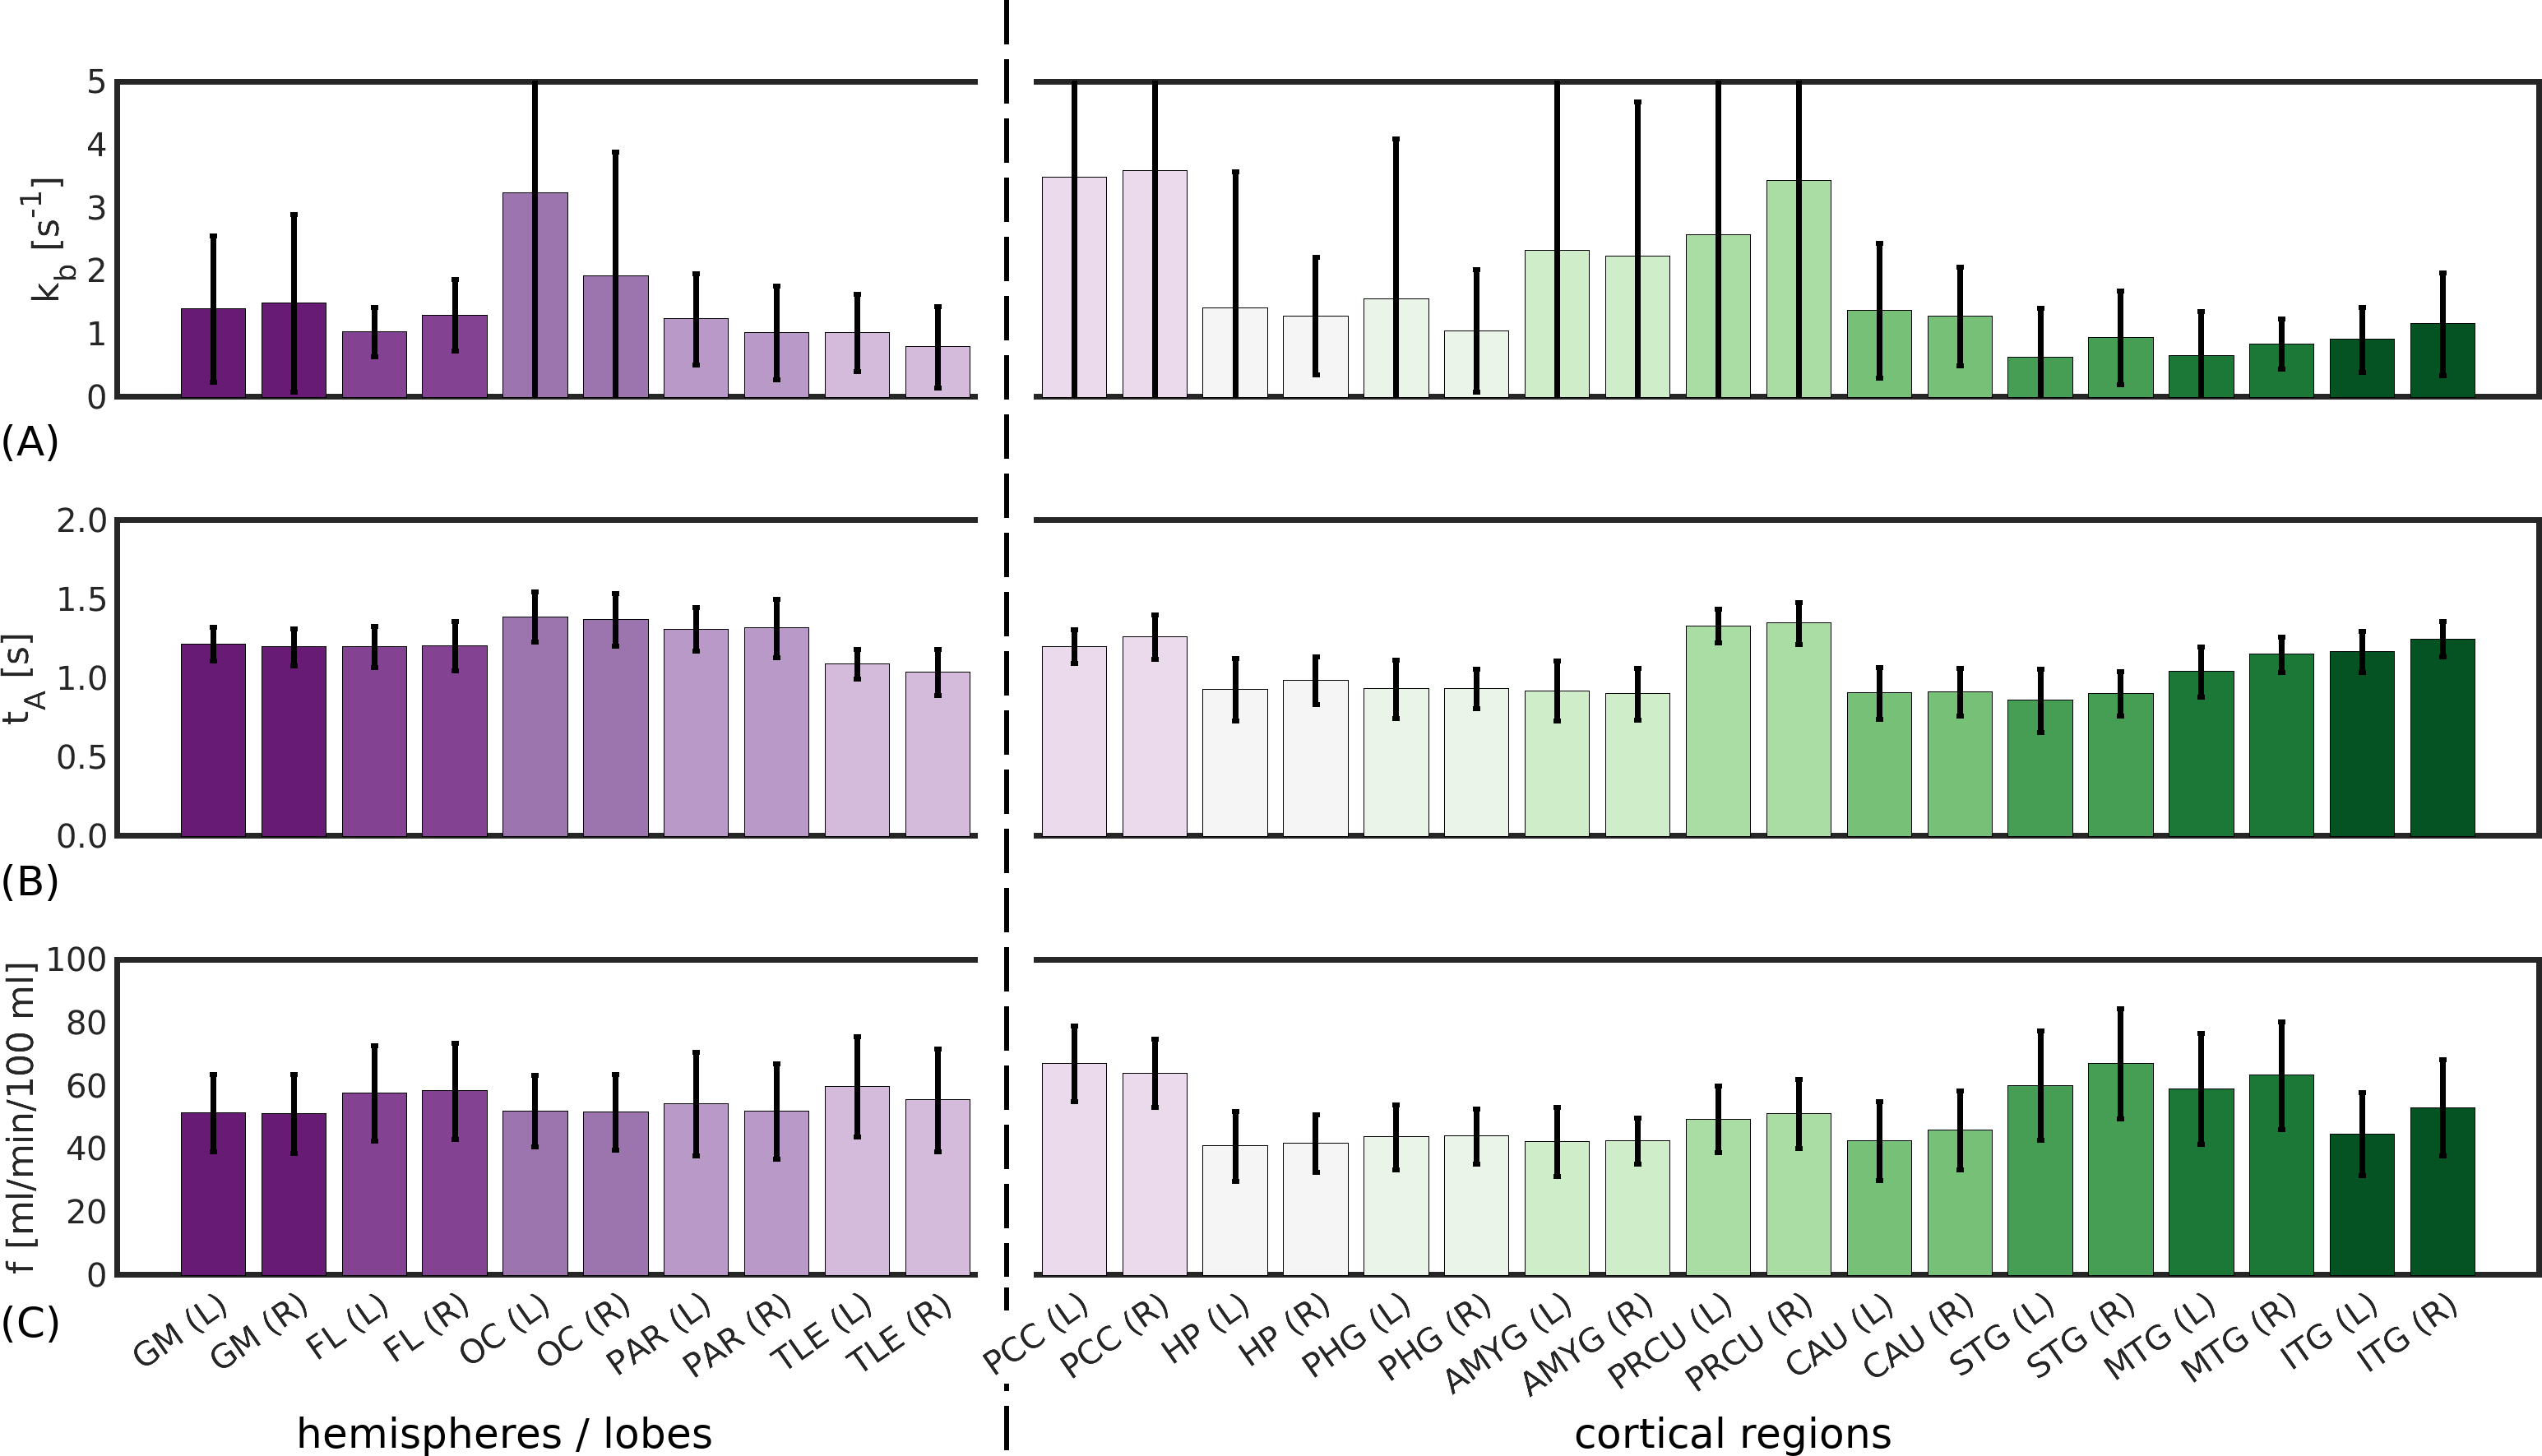
Figure 4. In vivo CE-ASL regional parameter values. Mean across subjects of regional parameter estimates for: (A) the exchange rate, kb; (B) the arterial transit time, tA, and; (C) the cerebral blood flow, f. The automatic anatomical labelling (AAL) atlas was used to define regions. Mean values are within published ranges for all parameters across regions. Good left/right correspondence can be seen in tA and f; more variability is evident in kb, although the left/right correspondence remains reasonable.
DOI: https://doi.org/10.58530/2023/1185