1183
Quantitative Flow Velocity in Cerebral Perforating Arteries with 7T MRI: the EUFIND study.1UMC Utrecht, Utrecht, Netherlands, 2Radiology, UMC Utrecht, Utrecht, Netherlands, 3Neurology, UMC Utrecht, Utrecht, Netherlands, 4IMAGO7 Research Foundation, Pisa, Italy, 5Neuroradiology, Leiden University Medical Center, Leiden, Netherlands, 6Radiology, University Hospital Essen, Essen, Germany, 7Max Planck Institute for Human Cognitive and Brain Sciences, Leipzig, Germany, 8German Cancer Research Center (DKFZ), Heidelberg, Germany, 9Spinoza Centre for Neuroimaging, Amsterdam, Netherlands, 10Centre for Magnetic Resonance in Biology and Medicine (UMR 7339), Marseille, France
Synopsis
Keywords: Data Acquisition, High-Field MRI, Harmonization, two dimensional phase contrast
We analyzed multi-center blood flow velocity measurements in perforating arteries from 7T MRI with the two-dimensional phase-contrast (2D-PC) sequence (eight sites, comprising three MRI vendors). Analysis was performed with the software tool Small vessEL MRI MArkers (SELMA). Inter-rater reliability of SELMA was excellent with overall intra-class coefficients for number of vessels (Ndetected), mean velocity (Vmean) and velocity pulsatility index (vPI) of at least 0.84 for 2D-PC data from all MRI vendors. Inter-vendor differences were larger than the intra-vendor differences (coefficients of variation: 0.62 vs. 0.39, 0.21 vs. 0.12 and 0.39 vs. 0.12 for Ndetected, Vmean and vPI, respectively).Introduction
Sensitive and specific MRI biomarkers of neurodegeneration are key to advancing our understanding on the disease pathology. New techniques have emerged with 7T MRI which fully harness the added benefits of 7T MRI to study aspects of neurodegenerative diseases in more detail such as vessel function in cerebral small vessel disease (SVD)1,2. In SVD, vessel function can be impaired due to vascular stiffening, which can result in parenchymal injury which is related to cognitive decline and dementia3-5. With 7T MRI, small vessel function in SVD can be studied directly at the small vessels themselves. Using a two-dimensional phase-contrast (2D-PC) sequence, blood flow velocity and pulsatility in the basal ganglia (BG) can be measured as possible new biomarkers in SVD6.Previous work has already shown the potential of blood flow pulsatility as a biomarker in SVD and other neurodegenerative diseases7,8. A large challenge for new MRI techniques is the ability to be harmonized across scanners from different vendors. The European Ultrahigh-Field Imaging Network in Neurodegenerative Diseases (EUFIND) workgroup set out to identify opportunities and challenges in harmonizing 7T MRI methods9. In this multi-center study we present the first results of harmonization of the 2D-PC sequence in the perforating arteries of the BG. We also harmonized the analysis of this data by using our own Small vessEL MRI MArkers (SELMA) analysis tool10.
Methods
A total of 8 sites participated in the EUFIND study, comprising three different MRI vendors: Philips (Achieva 7T, Philips Medical Systems, Best, The Netherlands), Siemens (MAGNETOM 7T, Siemens Healthineers, Erlangen, Germany) and General Electric (GE) (Discovery MR950, GE Healthcare, Chicago, Illinois, USA). The 2D-PC sequence was originally developed for the Philips 7T MRI and was attempted to harmonize across all sites with the distributed parameters in Table 1. The acquisition slice was planned in the basal ganglia (BG), targeting perforating arteries that branch from the circle of Willis9.All 2D-PC images were analysed using SELMA, a in-house developed Python tool developed for analysis of cerebral perforating arteries (Figure 1). SELMA was developed to be compatible with all 2D-PC data, regardless of MRI vendor. Details on SELMA have been described previously6,11. A new vessel selection feature was added which was used in this study to allow operators to manually censor ghosting or in-plane vessels in the detected vessel results from the automatic vessel detection algorithm. We assessed the number of perforating arteries (Ndetected), their mean blood flow velocity (Vmean) and the velocity pulsatility index (vPI). The vPI was defined as $$$\frac{V_{max}-V_{min}}{V_{mean}}$$$ , where Vmax, Vmin, and Vmean, are the maximum, minimum, and mean of the median normalized velocity trace over the cardiac cycle (i.e., Vmean in the vPI formula is 1.0 by definition).
All measurements were compared between vendors and institutes using a linear mixed model, with age, gender, and heart rate as possible covariates. The Intra-class Correlation Coefficient (ICC) was computed for all parameters. An ICC above 0.75 was considered to be an excellent correlation between operators12. The coefficient of variation (CV) was used to assess inter- and intra-vendor differences. Inter-rater reliability of SELMA was assessed with manual vessel selection performed by two operators.
Results
In this study 60 participants (mean age ± standard deviation: 59±6 years) were included (eight sites, three MRI vendors). Scan parameters deviated from the distributed protocol per subject, site, and vendor. Table 2 provides an overview of the relevant parameters. The Ndetected, Vmean, and vPI of all vendors and their sites are shown in Table 3.The results of the inter-rater analysis are shown in Table 4 for each vendor. All ICCs for the measurements exceeded 0.75 except for vPI of vendor 1 and Ndetected of vendor 2. The ICC of Ndetected, Vmean, and vPI for the entire dataset was 0.92, 0.84, and 0.85, respectively.
None of the covariates (age, gender, and heart rate) contributed significantly to the linear mixed model. The CV for inter-vendor differences were larger for all measurements than the intra-vendor differences (Table 3). Vendor-specific variance contributed for 56% to the total variance of the mixed model. The remaining variance was explained by the residuals (44%), with no contribution from site-specific variance.
Discussion
Differences in 2D-PC measurements in the perforating arteries of the BG after harmonization of the scanning protocol and analysis with SELMA were larger between vendors than within vendors. An early pilot of harmonizing the 2D-PC sequence in the perforating arteries of the semioval center of the white matter yielded inconsistent inter-vendor results due to sensitivity differences between vendors9. Perforating arteries in the BG are larger and could be less challenging to consistently detect across vendors. However, the high inter-vendor CV for Ndetected (0.62) illustrates the persistent challenges that arise in harmonizing 7T MRI acquisitions. Despite the high reliability of the data analysis, further efforts towards better 7T MRI harmonization are warranted. Further harmonization should address differences between vendors in hardware, sequence implementation, scan parameters and reconstruction.Conclusion
In this study we present the potential for 2D-PC measurements in the perforating arteries to be harmonized across multiple MRI systems. Further efforts towards harmonizing the acquisition between different vendors are warranted.Acknowledgements
This publication is an outcome of an EU Joint Programme Neurodegenerative Disease Research (JPND) working group (see www.jpnd.eu). The working group was supported through the German Federal Ministry of Education and Research (BMBF, funding code 01ED1620) under the aegis of JPND. We want to thank all study participants for participating in the EUFIND study. Furthermore, we want to thank all partners of the EUFIND collaborative program for their efforts towards harmonizing 7T MRI methods. SDTP and JCWS are funded by the UMCU Brain Center Young Talent Fellowship 2019.References
1. Zwanenburg JJM, Van Osch MJP. Targeting cerebral small vessel disease with MRI. Stroke. 2017;48(11):3175-3182.
2. van den Brink H, Kopczak A, Arts T, et al. Zooming in on cerebral small vessel function in small vessel diseases with 7T MRI: Rationale and design of the “ZOOM@SVDs” study. Cereb Circ - Cogn Behav. 2021;2:100013.
3. Wardlaw JM, Smith C, Dichgans M. Small vessel disease: mechanisms and clinical implications. Lancet Neurol. 2019;18(7):684-696.
4. Pantoni L. Cerebral small vessel disease: from pathogenesis and clinical characteristics to therapeutic challenges. Lancet Neurol. 2010;9(7):689-701.
5. Rensma SP, Stehouwer CDA, Boxtel MPJV, Houben AJHM, Berendschot TTJM, Jansen JFA, et al. Associations of Arterial Stiffness With Cognitive Performance, and the Role of Microvascular Dysfunction. Hypertension. 2020;75(6):1607-14.
6. Bouvy WH, Geurts LJ, Kuijf HJ, Luijten PR, Kappelle LJ, Biessels GJ, et al. Assessment of blood flow velocity and pulsatility in cerebral perforating arteries with 7-T quantitative flow MRI. NMR in Biomedicine. 2016;29(9):1295-304.
7. van den Brink, H., Kopczak, A., Arts, T., Onkenhout, L., Siero, J.C., Zwanenburg, J.J., Hein, S., Hübner, M., Gesierich, B., Duering, M., Stringer, M.S., Hendrikse, J., Wardlaw, J.M., Joutel, A., Dichgans, M., Biessels, G.J. and (2022), CADASIL Affects Multiple Aspects of Cerebral Small Vessel Function on 7T-MRI. Ann Neurol.
8. Geurts LJ, Zwanenburg JJM, Klijn CJM, Luijten PR, Biessels GJ. Higher Pulsatility in Cerebral Perforating Arteries in Patients With Small Vessel Disease Related Stroke, a 7T MRI Study. Stroke. 2018;50(1):STROKEAHA118022516-STROKEAHA.
9. Düzel E, Acosta-Cabronero J, Berron D, Biessels GJ, Björkman-Burtscher I, Bottlaender M, Bowtell R, Buchem MV, Cardenas-Blanco A, Boumezbeur F, Chan D, Clare S, Costagli M, de Rochefort L, Fillmer A, Gowland P, Hansson O, Hendrikse J, Kraff O, Ladd ME, Ronen I, Petersen E, Rowe JB, Siebner H, Stoecker T, Straub S, Tosetti M, Uludag K, Vignaud A, Zwanenburg J, Speck O. European Ultrahigh-Field Imaging Network for Neurodegenerative Diseases (EUFIND). Alzheimers Dement (Amst). 2019 Jul 31;11:538-549.
10. Vascular Brain Imaging Group, University Medical Center Utrecht (2022). Small Vessel MRI Markers. Zenodo. https://doi.org/10.5281/zenodo.7307437
11. van Tuijl, R.J., Pham, S.D.T., Ruigrok, Y.M. et al. Reliability of velocity pulsatility in small vessels on 3Tesla MRI in the basal ganglia: a test–retest study. Magn Reson Mater Phy (2022).
12. Cicchetti DV. Guidelines, criteria, and rules of thumb for evaluating normed and standardized assessment instruments in psychology. Psychological Assessment. 1994;6(4):284-90.
Figures
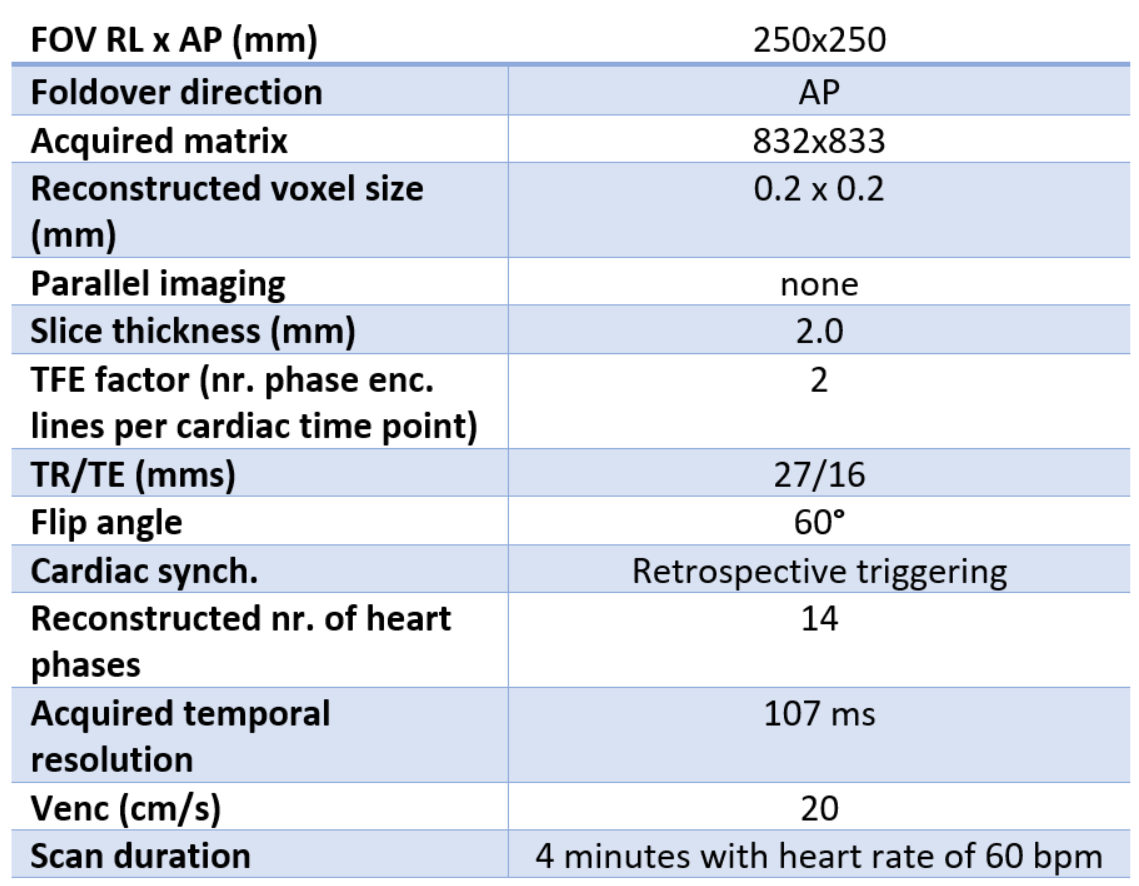
Table 1
Requested scan parameters for the two dimensional phase contrast sequence for all three MRI vendors
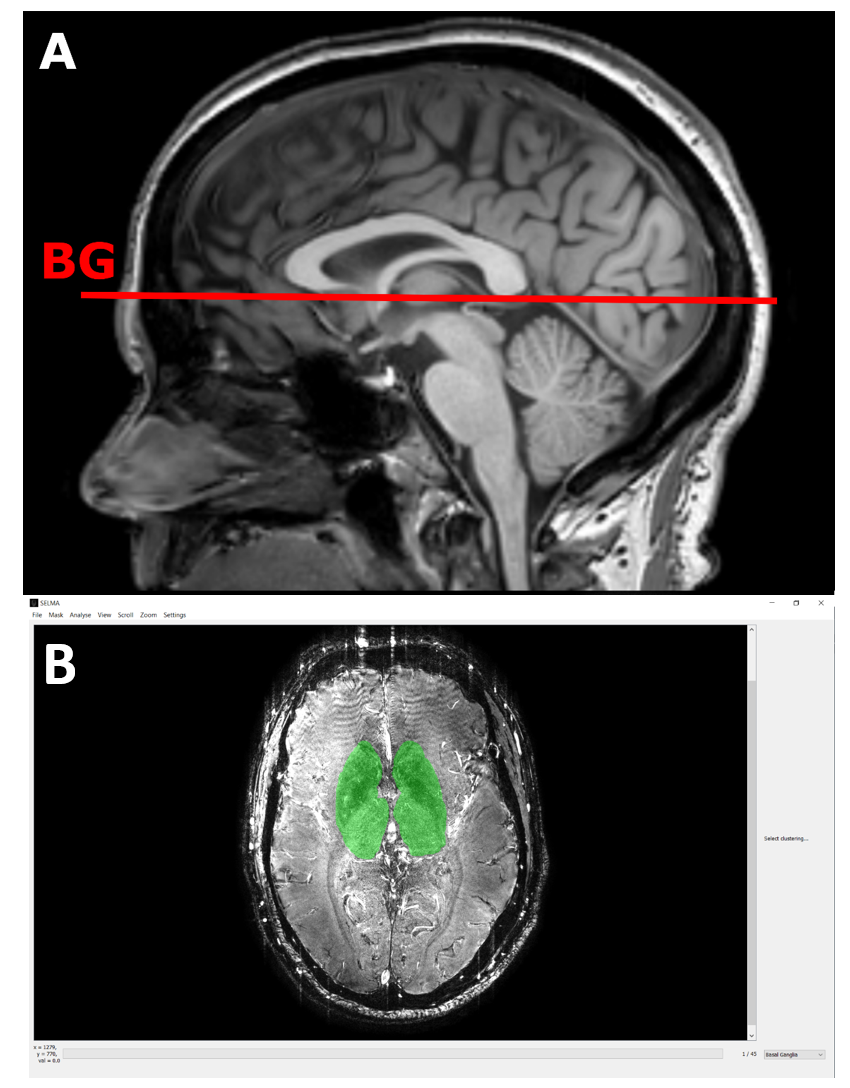
Figure 1
A) The two dimensional phase contrast (2D-PC) acquisition was planned on a 3D anatomic image (T1) at the level of the basal ganglia B) The graphical user interface of the Small vessEL MRI MArkers (SELMA) analysis tool. Operators using SELMA can manually draw the region of interest to initiate analysis.
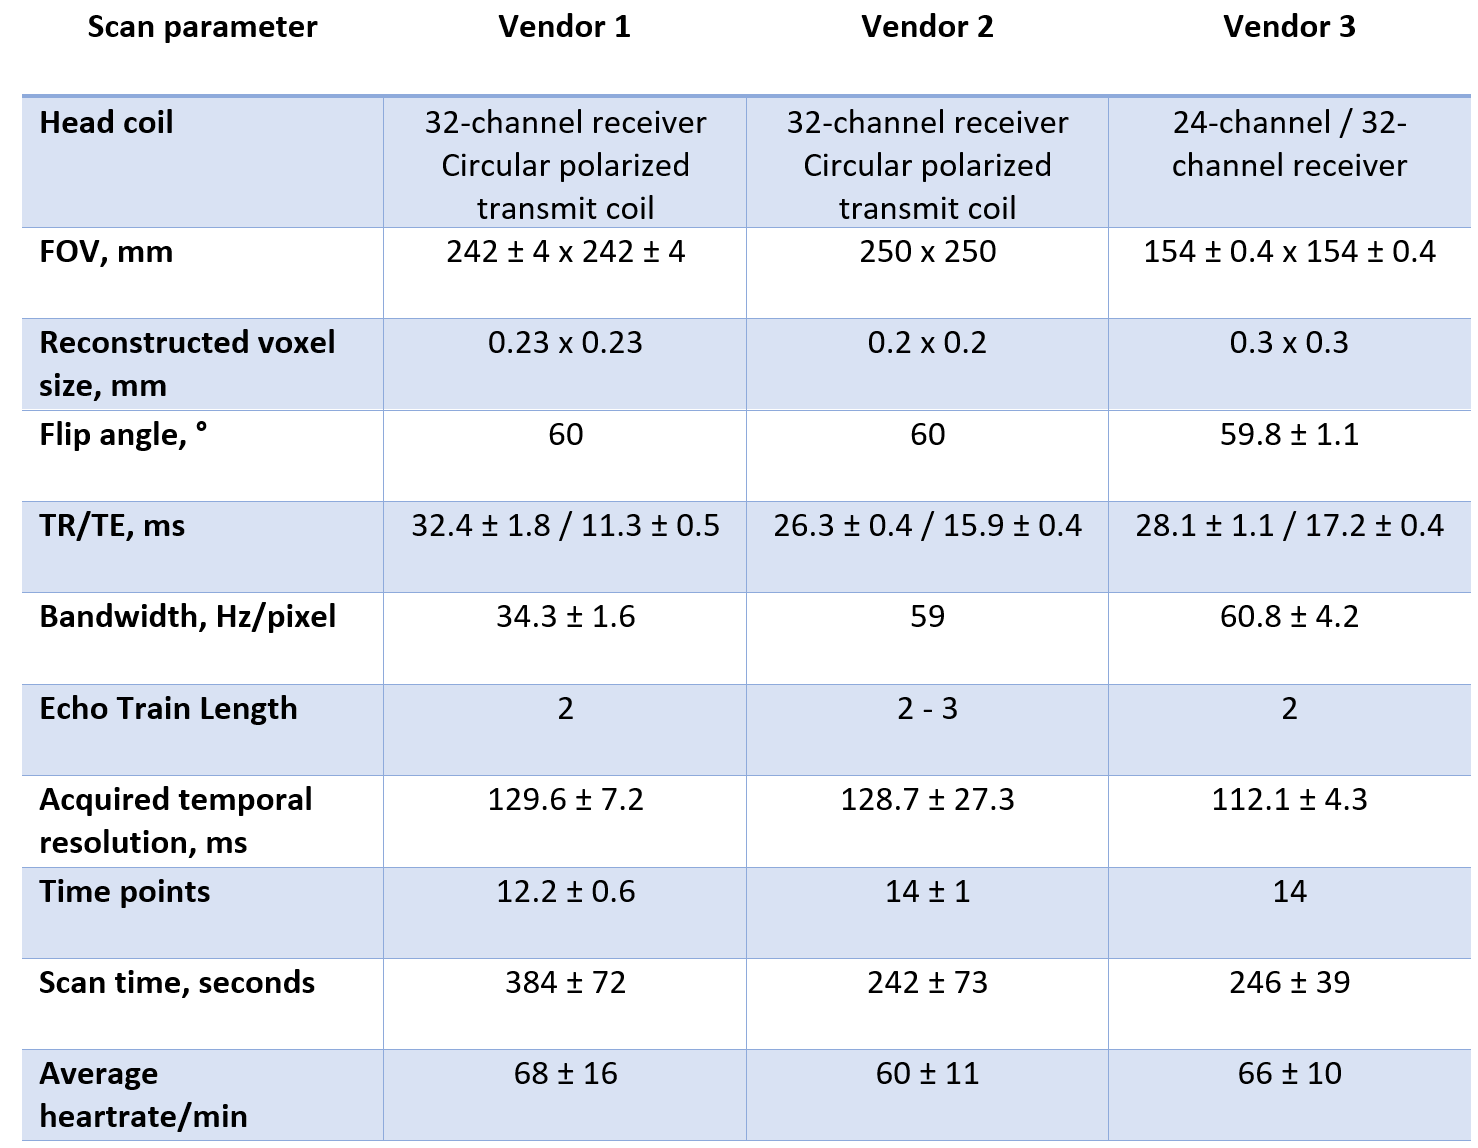
Table 2
Scan parameters (mean ± SD) for the two-dimensional phase-contrast sequence for all three MRI vendors.
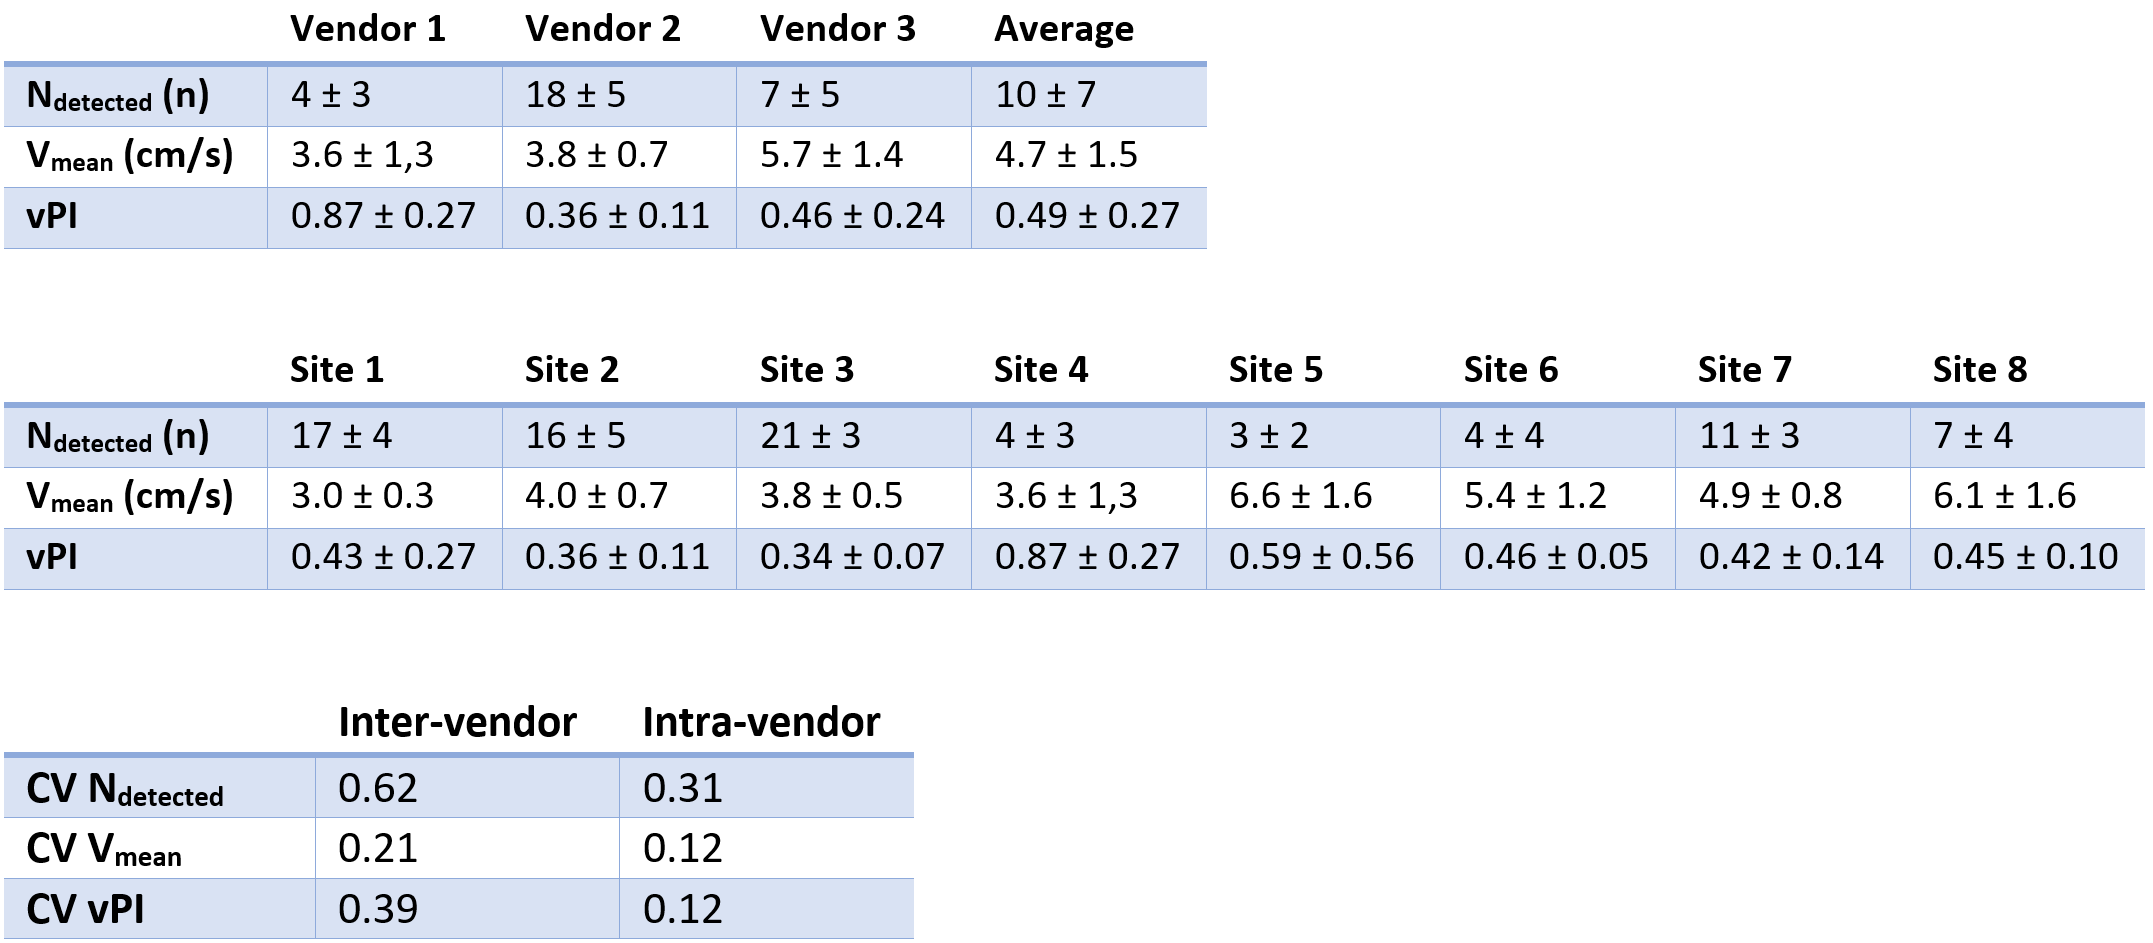
Table 3
Top: Blood flow velocity measurements in the basal ganglia grouped per vendor. Middle: Blood flow velocity measurements in the basal ganglia grouped per site. Bottom: Coefficient of variation for inter-vendor and intra-vendor measurements. Ndetected = amount of detected arteries; Vmean = mean blood flow velocity of the perforating arteries given in cm/s; vPI = velocity pulsatility index; CV = coefficient of variation. Measurements are given in mean with standard deviation. Coefficient of variation was defined as an index.
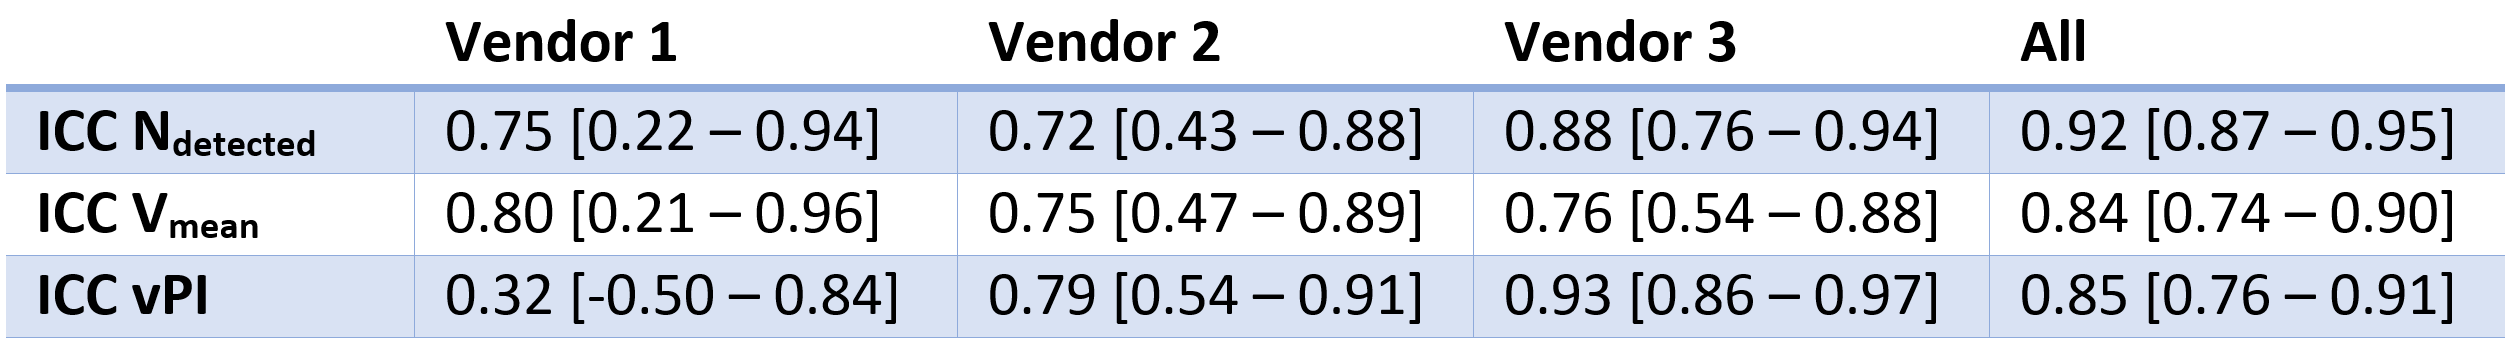
Table 4
Results of inter-rater analysis of blood flow velocity measurements grouped per vendor. Ndetected = amount of detected arteries; Vmean = mean blood flow velocity of the perforating arteries given in cm/s; vPI = velocity pulsatility index; ICC = Intra-class Correlation Coefficient; Values are given in mean with 95% confidence interval.