1179
Advances in Post-Perfusion Venous Territories Imaging with Displacement Spectrum Imaging (DiSpect)
Ekin Karasan1, Jingjia Chen1, Julian Maravilla1, Zhiyong Zhang2, Chunlei Liu1,3, and Michael Lustig1
1Department of Electrical Engineering and Computer Science, University of California, Berkeley, Berkeley, CA, United States, 2School of Biomedical Engineering, Shanghai Jiao Tong University, Shanghai, China, 3Helen Wills Neuroscience Institute, Berkeley, CA, United States
1Department of Electrical Engineering and Computer Science, University of California, Berkeley, Berkeley, CA, United States, 2School of Biomedical Engineering, Shanghai Jiao Tong University, Shanghai, China, 3Helen Wills Neuroscience Institute, Berkeley, CA, United States
Synopsis
Keywords: Pulse Sequence Design, Perfusion
DiSpect resolves the multi-dimensional displacement spectrum that spins exhibit between tagging and imaging. Previously, we showed that DiSpect can be used to trace blood draining from the capillary bed through the cerebral venous system. This work presents three innovations: 1) Validation of our results with flow phantom experiments and comparison of our in-vivo data with a detailed QSM-venogram. 2) Interleaved imaging to simultaneously probe the deep and superficial veins. 3) Use of a conformal head-cap array for imaging, with higher SNR, allowing dynamic measurement of vein drainage and observation of venous territories across large time scales.Introduction
Probing the dynamics of cerebral veins can be useful in disease diagnosis and biophysical function studies1,2. However, current non-contrast enhanced methods are limited in studying venous flow. Arterial Spin Labeling (ASL) is not suitable because it requires a single labeling plane3. Velocity-based techniques (Time of Flight (TOF)/phase-contrast MRI4,5,6) have limited sensitivity to slow flow. Displacement Spectrum Imaging (DiSpect)7 resolves a multi-dimensional displacement spectrum for each image voxel, revealing the blood displacement between tagging and imaging. We have shown that DiSpect can be used to trace blood flow from the capillary bed into the superficial cerebral veins (SCV) and map venous territories8, similar to a previously proposed preliminary technique based on remote sensing9.Here, we present several extensions. First, we validate DiSpect in a phantom by computing velocity maps and in-vivo by comparing DiSpect to a QSM-venogram. Second, we perform an interleaved two-slice acquisition to simultaneously image the SCV and deep cerebral veins (DCV). Finally, we image with a conformal head-cap array with higher surface sensitivity. The improved SNR makes it feasible to trace blood draining for a long duration after tagging, allowing us to observe venous territories over large time-scales.
Methods
Flow Phantom:Scanner experiments were conducted with a 3T GE MR750W system (Waukesha, Wisconsin). DiSpect acquisitions were performed with the sequence shown in Figure 1a. The sequence was implemented on the HeartVista platform (Palo Alto, CA). A flow phantom was constructed to simulate the SCV, with four tubes merging at the top (Figures 2b-c). The phantom was placed inside a water pool and a peristaltic pump was used to draw water out of the tubes (Figure 2a). A 2D-DiSpect acquisition was performed with an axial imaging slice (resolution=4x4mm2, FOV=20x20cm2). Displacement encoding (resolution=3x3mm2, FOV=4.2x6cm2) was in the LR and SI directions, resulting in a 2D coronal spectrum (projected along AP). Images were acquired from 100ms to 4s after tagging (150ms increments). Image voxels containing the four tubes were selected and their displacement spectra visualized. The average flow velocity of the tubes were estimated based on their displacement spectra.
For validation of estimated velocities, the tubes were imaged with a 4D-flow10,11 sequence (Resolution=1x1x1mm3/TE=5ms/TR=33ms/FA=5o/Venc=5cm/s).
Validation with QSM-Venogram:
We used Quantitative Susceptibility Mapping (QSM) to obtain a detailed map of veins12. An axial Multi-Echo 3D-GRE sequence was performed in-vivo (resolution=0.7×0.7×2mm3, TE1/ΔTE/TE16=2.3/0.8/14.3ms, TR=50ms, BW=62.5kHz, FA=12o). STI Suite V3.013 was used to obtain susceptibility maps for each echo with the iLSQR14 method. The maps from 4-8th echoes were averaged. To visualize a coronal vein structure, a maximum intensity projection was performed on the echo-averaged QSM map along AP direction, with a slab thickness of 5cm.
Next, a 2D-DiSpect acquisition (image resolution=4x4mm2, FOV=16x16cm2, displacement resolution=6x6mm2, FOV=12x7.2cm2) was performed with LR and SI displacement encoding (Figure 3a). Images were acquired from 100ms to 2.2s (150ms increments). For visualization, five vein ROIs were selected and their spectra were overlaid on the QSM-venogram.
Interleaved Two-Slice Acquisition:
An interleaved two slice acquisition (Figure 4a) was performed to simultaneously image SCV and DCV. Two axial slices were chosen: one for SCV (4x4mm2, 16x16cm2 FOV) and one for DCV (4x4mm2, 22x22cm2 FOV). Image acquisitions after tagging (100ms to 1.6s, in 100ms increments) were alternated between the two slices. AP and SI displacement encoding was performed (resolution=6x6mm2, FOV=12x7.2cm2).
DiSpect with Head-Cap Array:
To improve the SNR, an in-vivo experiment was performed with a custom 15-channel conformal head-cap array15(Figure 5c). An axial slice (resolution=4x4mm2, 16x16cm2 FOV) was imaged with LR and SI displacement encoding (resolution=6x6mm2, FOV=12x7.2cm2). Images were acquired from 100ms to 3.1s (150ms increments).
A 3D phase-contrast-based venogram was acquired for in-vivo experiments.
Results and Discussion
For the flow phantom experiment, the displacement spectrum of each tube is overlaid on the corresponding schematic of the tubes (Figure 2d). The 4D-flow velocity maps and the estimated velocity maps from DiSpect are shown (Figure 2e). The spectra show water arriving to the imaging slice over 4s from the tubes as well as the pool. The estimated velocity maps from DiSpect closely match 4D-flow results.The displacement spectra overlaid on QSM-venograms are shown (Figure 3d). QSM recovers smaller veins that are missing in the phase-contrast-venogram (Figure 3e). The displacement spectra show great overlap with the QSM-venogram, also displaying flow from small veins.
For the interleaved acquisition, five vein ROIs were selected from the slices and their spectra were overlaid on the sagittal phase-contrast-venogram displaying the corresponding vein (Figure 4c). The acquisition can simultaneously recover flow from SCV and DCV enabling full brain coverage.
Finally for the dataset with the head-cap, four vein ROIs were selected and their spectra overlaid on the coronal phase-contrast-venogram of the corresponding vein. The dynamic results show that signal can be retained for a long duration after tagging, allowing sufficient time for blood coming from capillaries farther in the surrounding tissue to drain into the imaged vein (Figure 5d).
Conclusions
We validate DiSpect for venous imaging with a flow phantom experiment and a comparison with a QSM-venogram. We demonstrate the possibility to image two slices in an interleaved manner to image draining of multiple vein groups. Finally, we show that using a conformal coil with high surface SNR, we can observe venous territories across large time scales.Acknowledgements
We thank the following funding sources: R01MH127104, UCB-UCSF VCR Faculty Collaboration Award and GE Healthcare.References
- Leach, James L., et al. "Imaging of cerebral venous thrombosis: current techniques, spectrum of findings, and diagnostic pitfalls." Radiographics 26.suppl_1 (2006): S19-S41.
- Agid, Ronit, et al. "Imaging of the intracranial venous system." The neurologist 14.1 (2008): 12-22.
- Alsop, David C., et al. "Recommended implementation of arterial spin‐labeled perfusion MRI for clinical applications: A consensus of the ISMRM perfusion study group and the European consortium for ASL in dementia." Magnetic resonance in medicine 73.1 (2015): 102-116.
- Stoquart-ElSankari, Souraya, et al. "A phase-contrast MRI study of physiologic cerebral venous flow." Journal of Cerebral Blood Flow & Metabolism 29.6 (2009): 1208-1215.
- Ruehm, Stefan G. "MR venography." Magnetic Resonance Angiography. Springer, Milano, 2005. 331-340.
- Morgan, Alasdair G., et al. "4D flow MRI for non-invasive measurement of blood flow in the brain: a systematic review." Journal of Cerebral Blood Flow & Metabolism 41.2 (2021): 206-218.
- Zhang, Zhiyong, et al. "DiSpect: Displacement spectrum imaging of flow and tissue perfusion using spin‐labeling and stimulated echoes." Magnetic Resonance in Medicine (2021).
- Karasan, Ekin et al. ““Reverse Perfusion” Imaging of the Cerebral Venous System with Displacement Spectrum Imaging (DiSpect).” Proc. ISMRM (2022).
- Wong, Eric et al. “VENTI: Venous Territory Imaging Using Remote Sensing.” Proc. ISMRM (2013).
- Markl, M., Frydrychowicz, A., Kozerke, S., Hope, M., & Wieben, O. (2012). 4D flow MRI. Journal of magnetic resonance imaging : JMRI, 36(5), 1015–1036. https://doi.org/10.1002/jmri.23632
- Cheng, J. Y., Hanneman, K., Zhang, T., Alley, M. T., Lai, P., Tamir, J. I., Uecker, M., Pauly, J. M., Lustig, M., & Vasanawala, S. S. (2016). Comprehensive motion-compensated highly accelerated 4D flow MRI with ferumoxytol enhancement for pediatric congenital heart disease. Journal of magnetic resonance imaging : JMRI, 43(6), 1355–1368. https://doi.org/10.1002/jmri.25106
- Liu, C., Wei, H., Gong, N. J., Cronin, M., Dibb, R., & Decker, K. (2015). Quantitative Susceptibility Mapping: Contrast Mechanisms and Clinical Applications. Tomography (Ann Arbor, Mich.), 1(1), 3–17. https://doi.org/10.18383/j.tom.2015.00136
- https://people.eecs.berkeley.edu/~chunlei.liu/software.html
- Li, Wei, et al. "A method for estimating and removing streaking artifacts in quantitative susceptibility mapping." Neuroimage, 108 (2015): 111-122
- Maravilla, Julian Adolfo, et al. "Transmission Line Receiver Coils (TLCs) for MRI." Proc. ISMRM (2022).
Figures
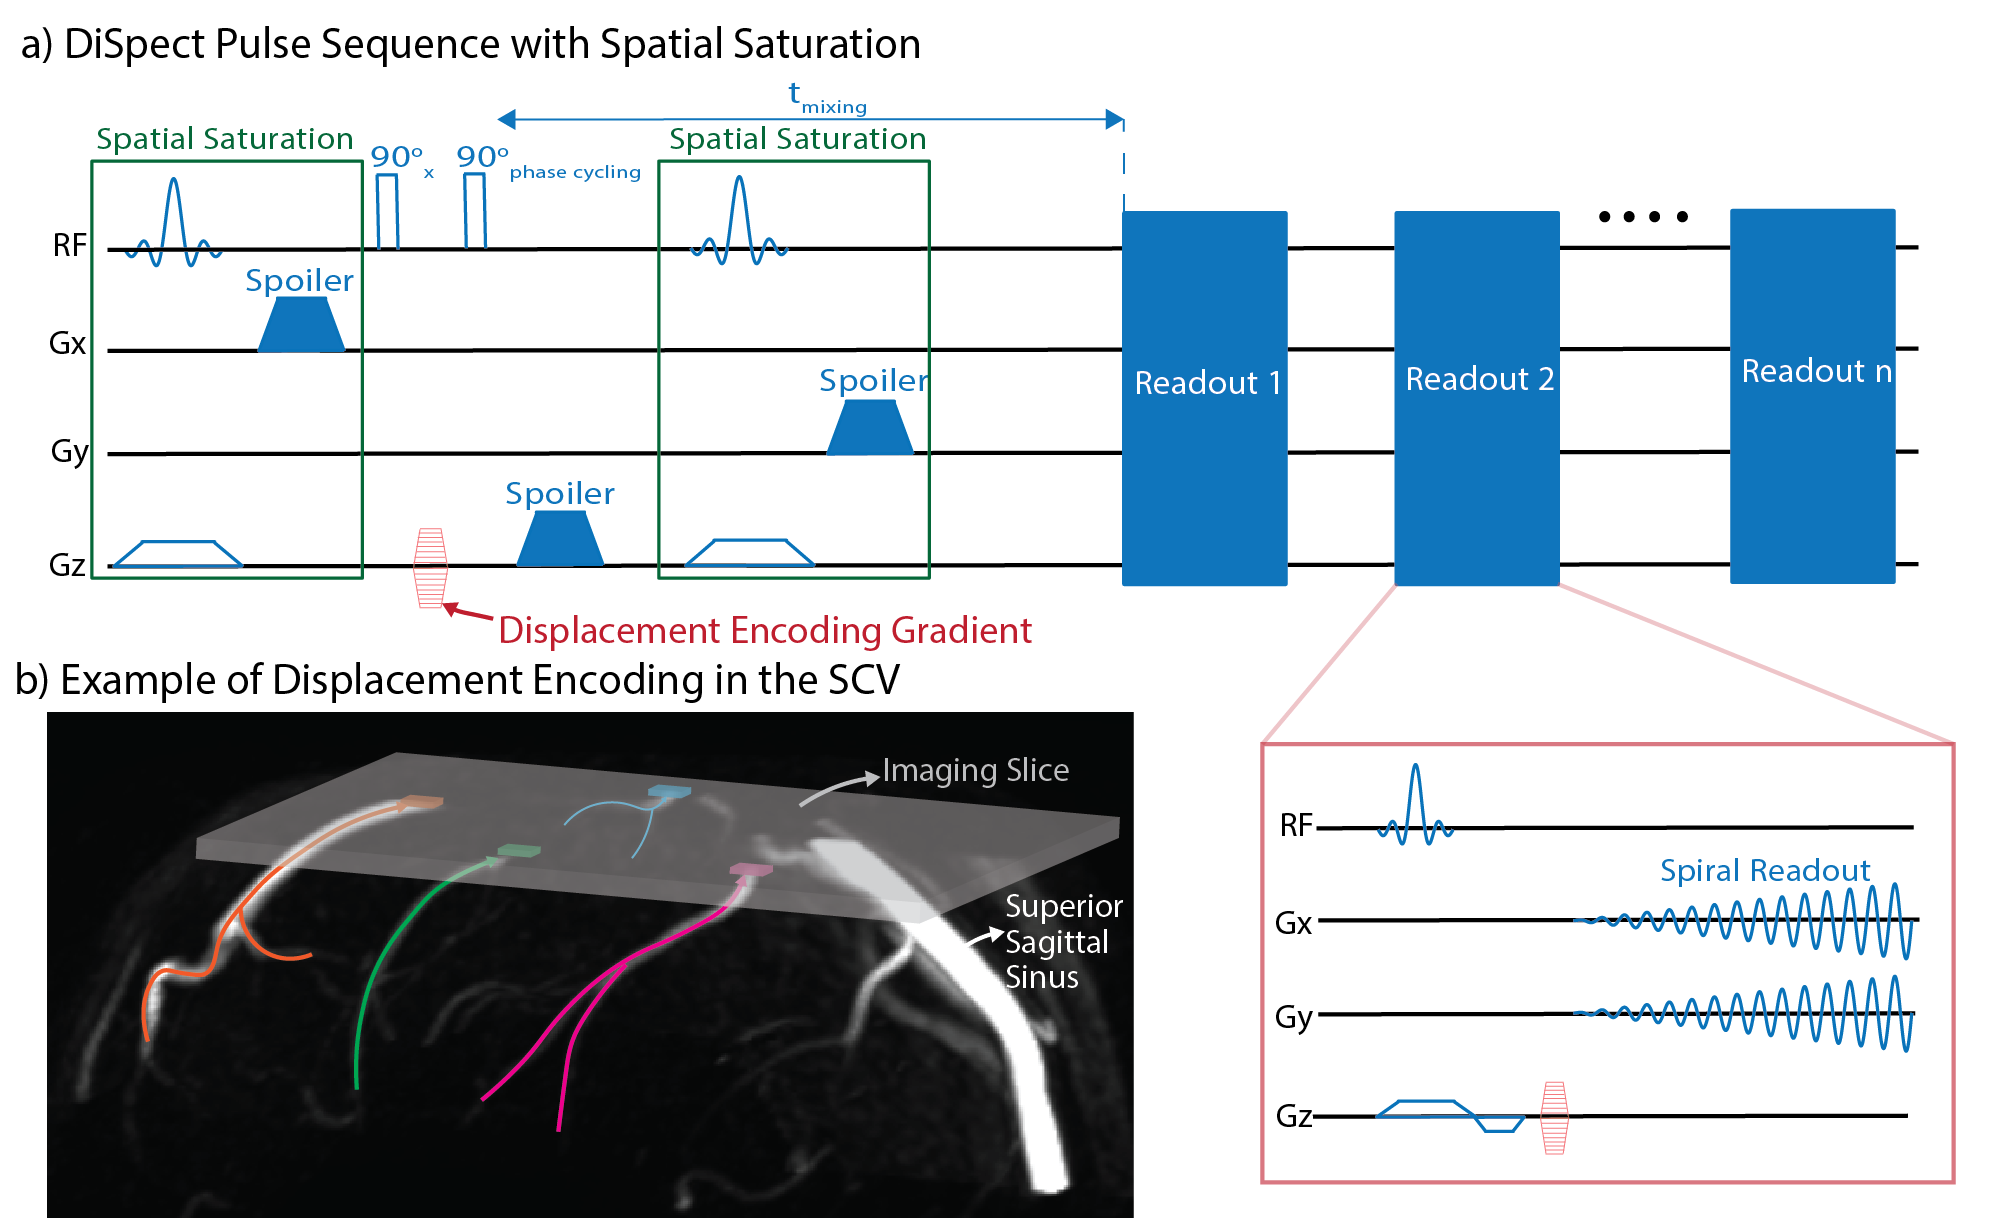
Figure 1: a) The DiSpect pulse sequence: Spatial saturation pulses are placed before and after tagging to suppress unwanted signals. Images are acquired repeatedly after tagging with a single shot spiral readout. b) Example imaging setup to image the SCV. An axial imaging slice is placed towards the top of the head. Different superficial veins will drain into different regions of the imaging slice. The displacement spectra of each region will contain information about blood draining from each vein as well as surrounding tissue.
Figure 2: (Animated) Flow phantom experiment: a) A phantom is designed to simulate the SCV. The phantom is placed in a large pool and a peristaltic pump is used to draw water out of the tubes. b) Coronal and c) sagittal view of the phantom marking four sets of tubes in different colors. Each tube flows into a different region of the imaging slice. d) Voxels containing each tube are selected and their displacement spectra are dynamically overlaid on the schematic of the tubes with corresponding colors. e) Z-axis velocity maps obtained from 4D flow and estimated with DiSpect show good agreement.
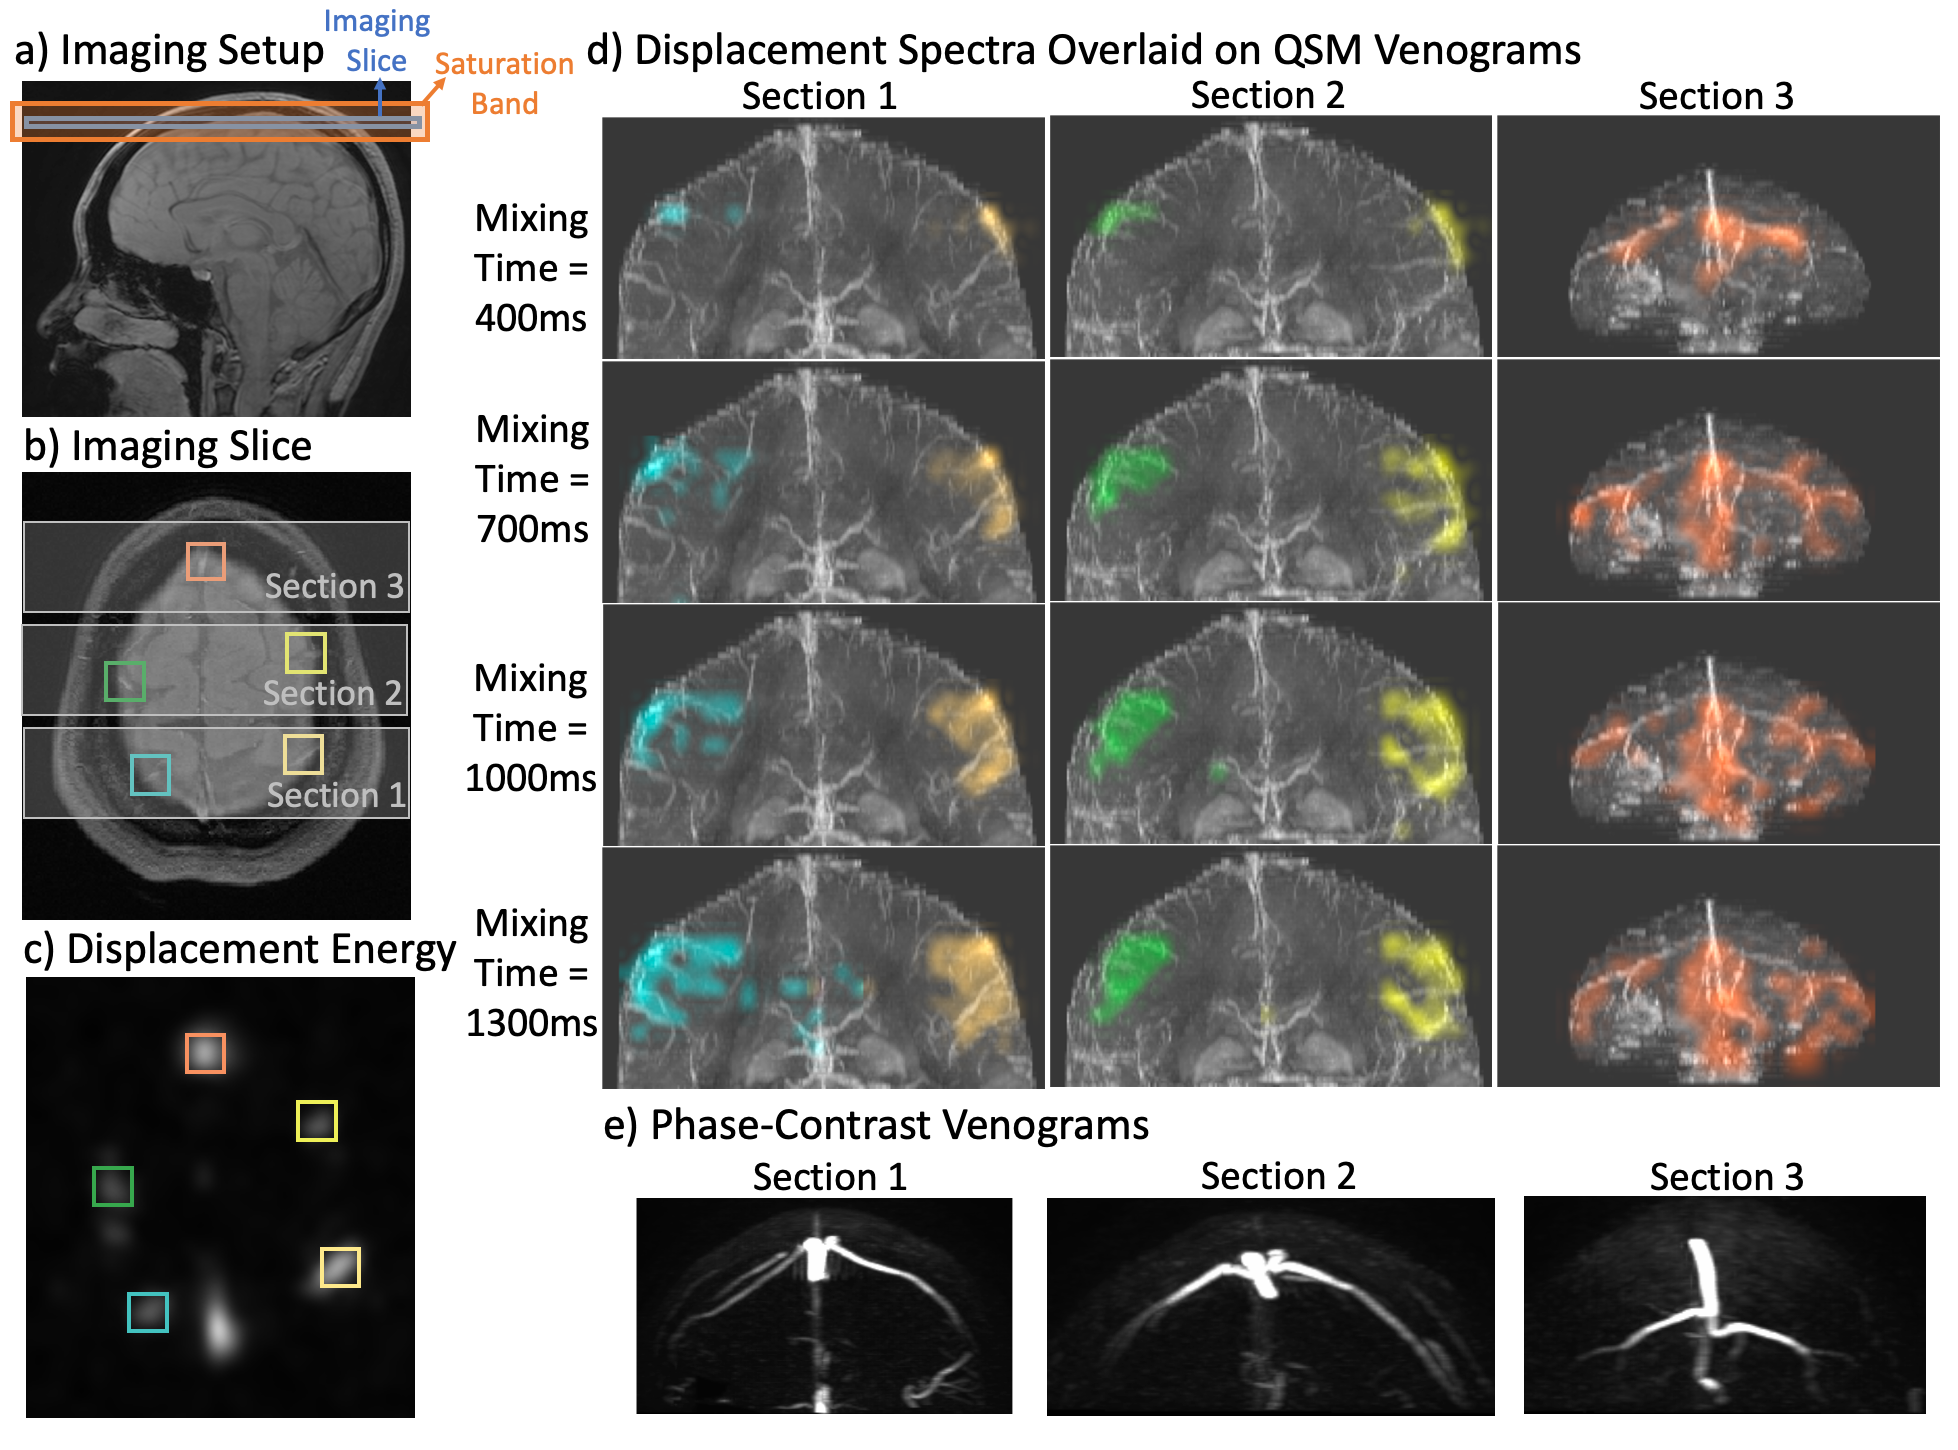
Figure 3: Validation with a QSM-venogram: a) Imaging setup. A 22-channel commercial head coil was used. b) The axial imaging slice with five ROIs selected containing veins. c) The displacement spectrum energy of the imaging slice showing five ROIs. d) The displacement spectra of each ROI is overlaid on the QSM-venogram of the corresponding section (as marked in (b)). The QSM-venograms reveal the venous structure with high detail. The overlaid displacement spectra greatly overlap with the provided structure. e) Phase-contrast based venograms of each section, showing a lack of detail.
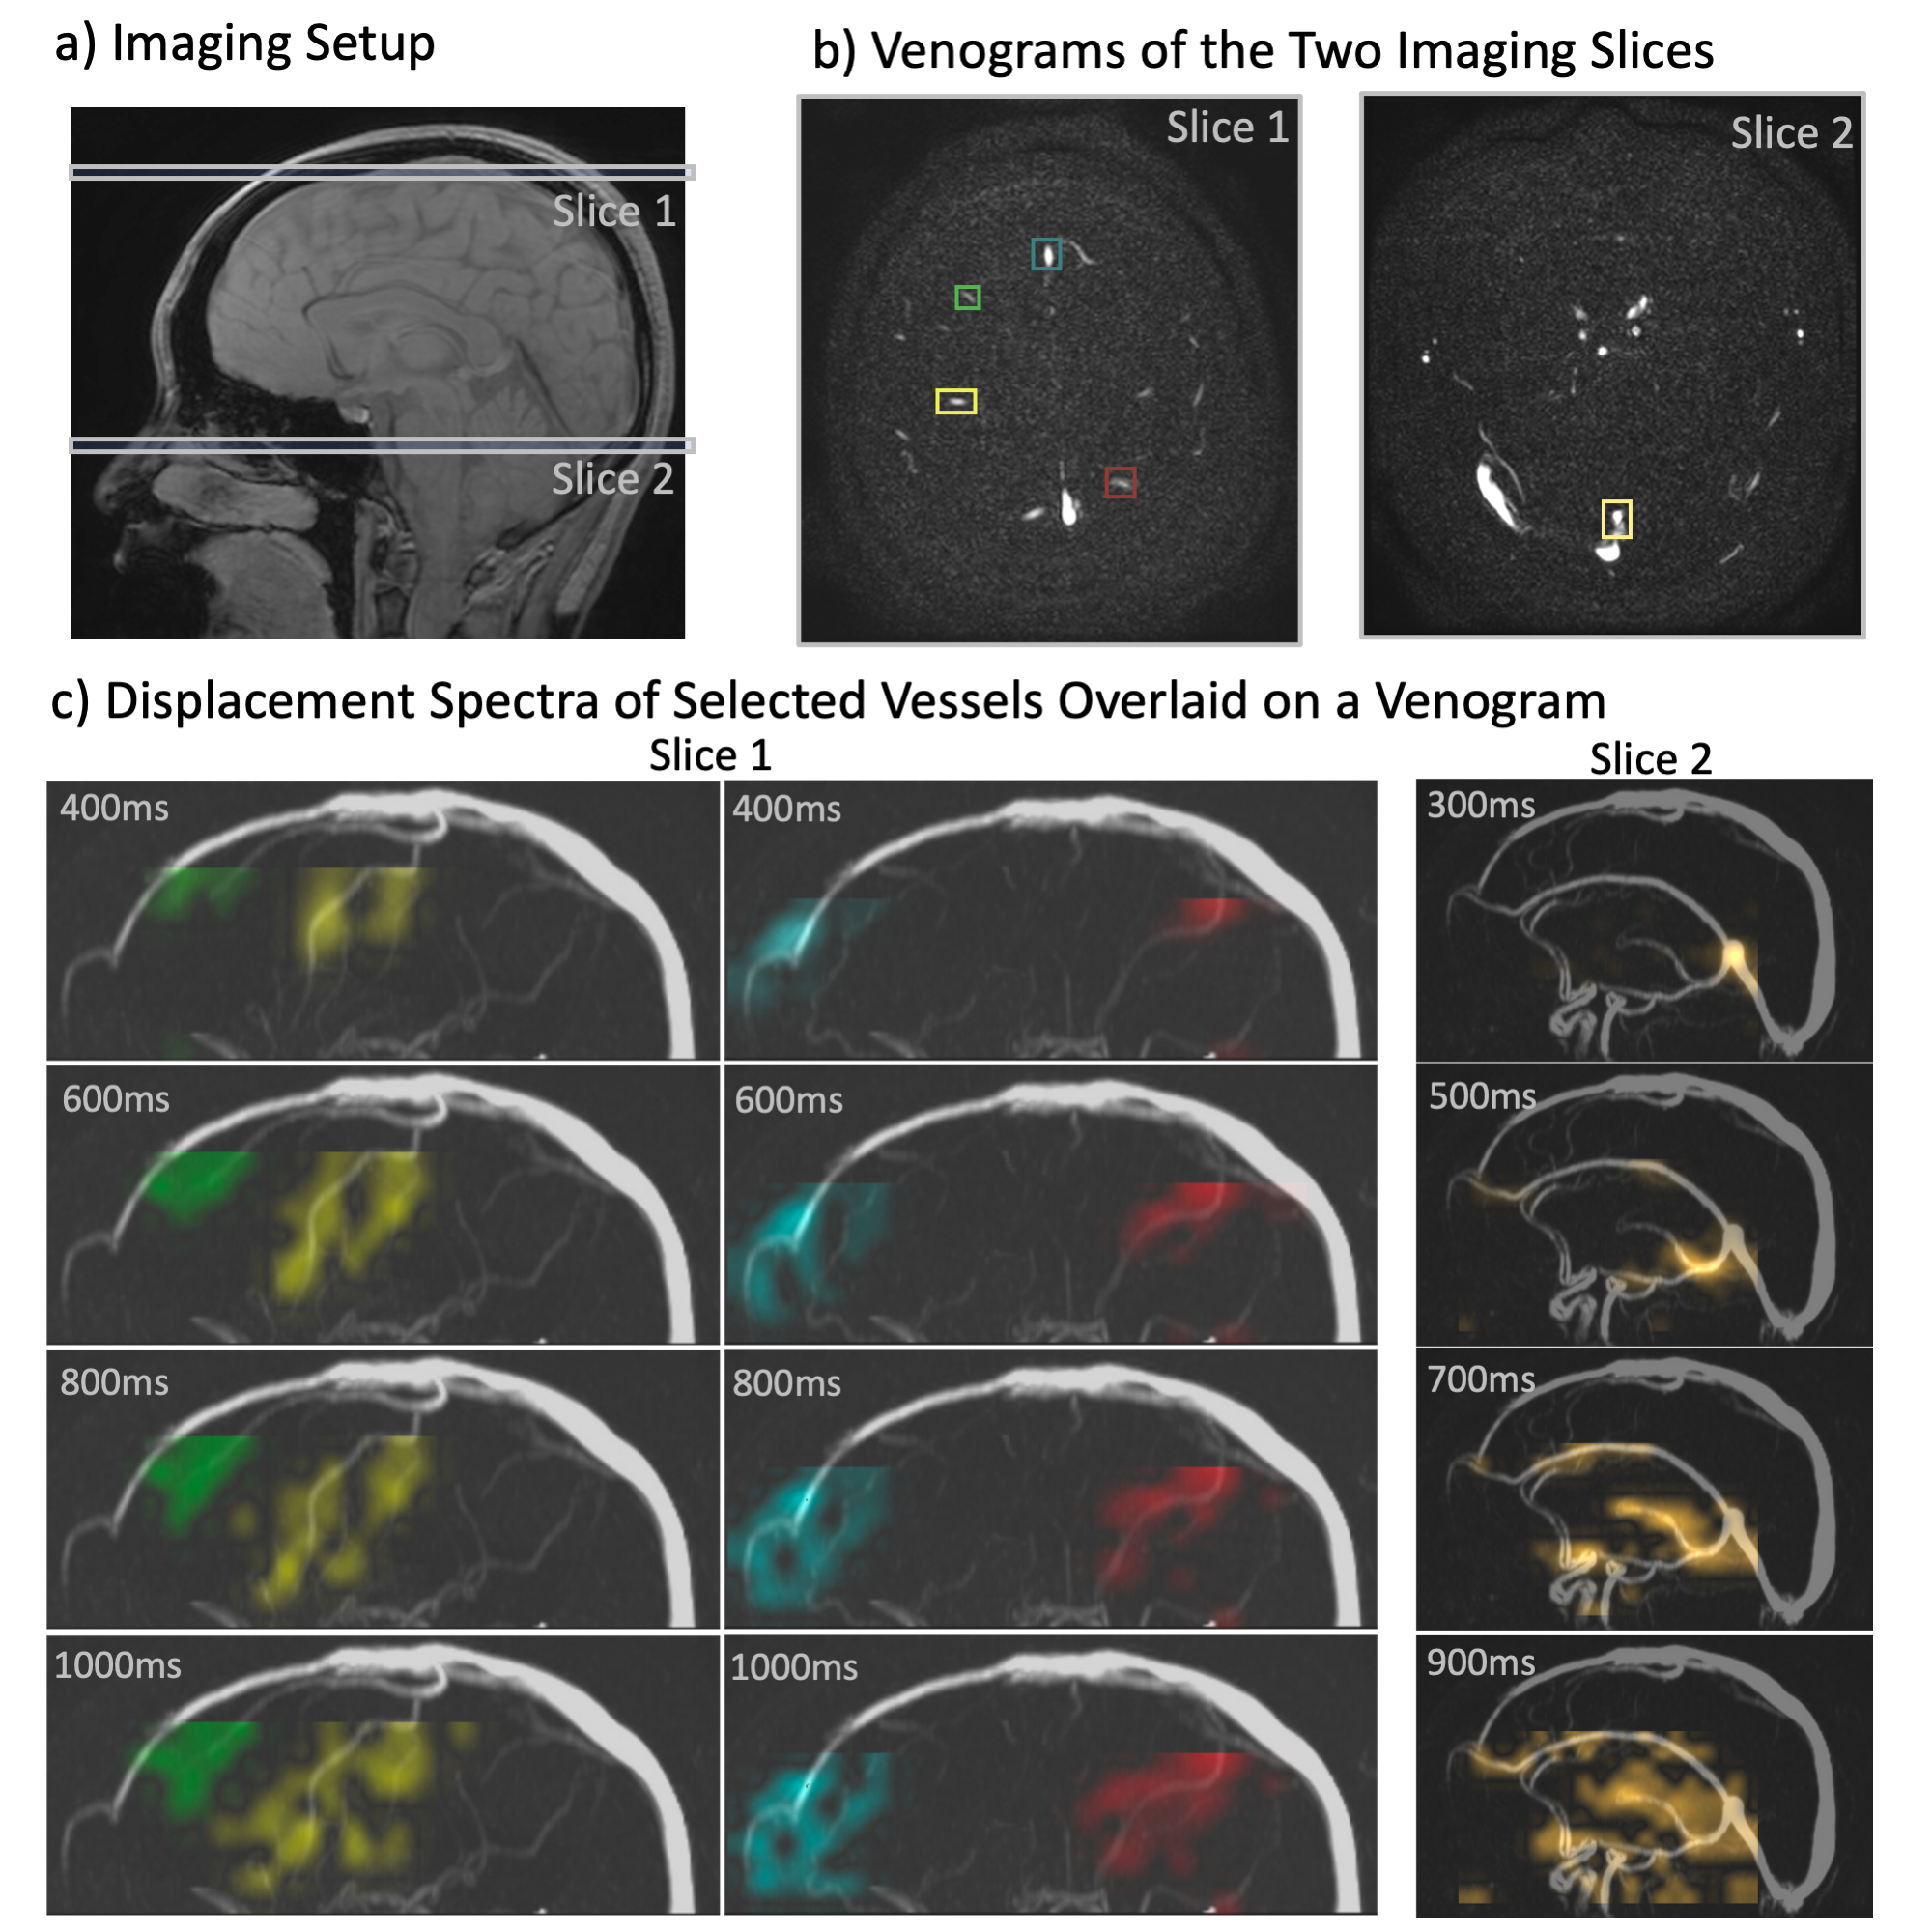
Figure 4: Interleaved multi-slice acquisition. Two slices are imaged in an interleaved manner after tagging. a) Imaging setup showing the two imaged slices: Slice 1 to image the SCV and Slice 2 placed on the straight sinus to image the DCV. A 22-channel commercial head coil was used for imaging. b) Phase-contrast venograms of the two imaged slices displaying the five vein ROIs selected. c) The displacement spectra of each ROI is overlaid on the sagittal venogram of the corresponding vein at four mixing times. The mixing time is specified on the top-left corner of each image.
Figure 5: (Animated) DiSpect with conformal head-cap array: a) Imaging Setup. b) Venogram of the imaging slice marking four selected ROIs. c) Schematic and image of the conformal head-cap array. d) Displacement spectra of each ROI dynamically overlaid on the coronal projection of the corresponding vein. Spectra are displayed up to a 3s mixing time. For shorter mixing times the signal is constrained within the main vein. At longer mixing times, the signal gets dispersed to tissue surrounding the vein, giving us the ability to map venous territories across large time scales.
DOI: https://doi.org/10.58530/2023/1179