1178
Test-Retest Reliability of 3D Velocity-Selective Arterial Spin Labeling for Detecting Normal Variations of Cerebral Blood Flow1The Russell H. Morgan Department of Radiology and Radiological Science, Johns Hopkins University, Baltimore, MD, United States, 2F.M. Kirby Research Center for Functional Brain Imaging, Kennedy Krieger Institute, Baltimore, MD, United States, 3Department of Neurology, Johns Hopkins University, Baltimore, MD, United States, 4Department of Psychiatry and Behavioral Sciences, Johns Hopkins University, Baltimore, MD, United States
Synopsis
Keywords: Data Acquisition, Arterial spin labelling
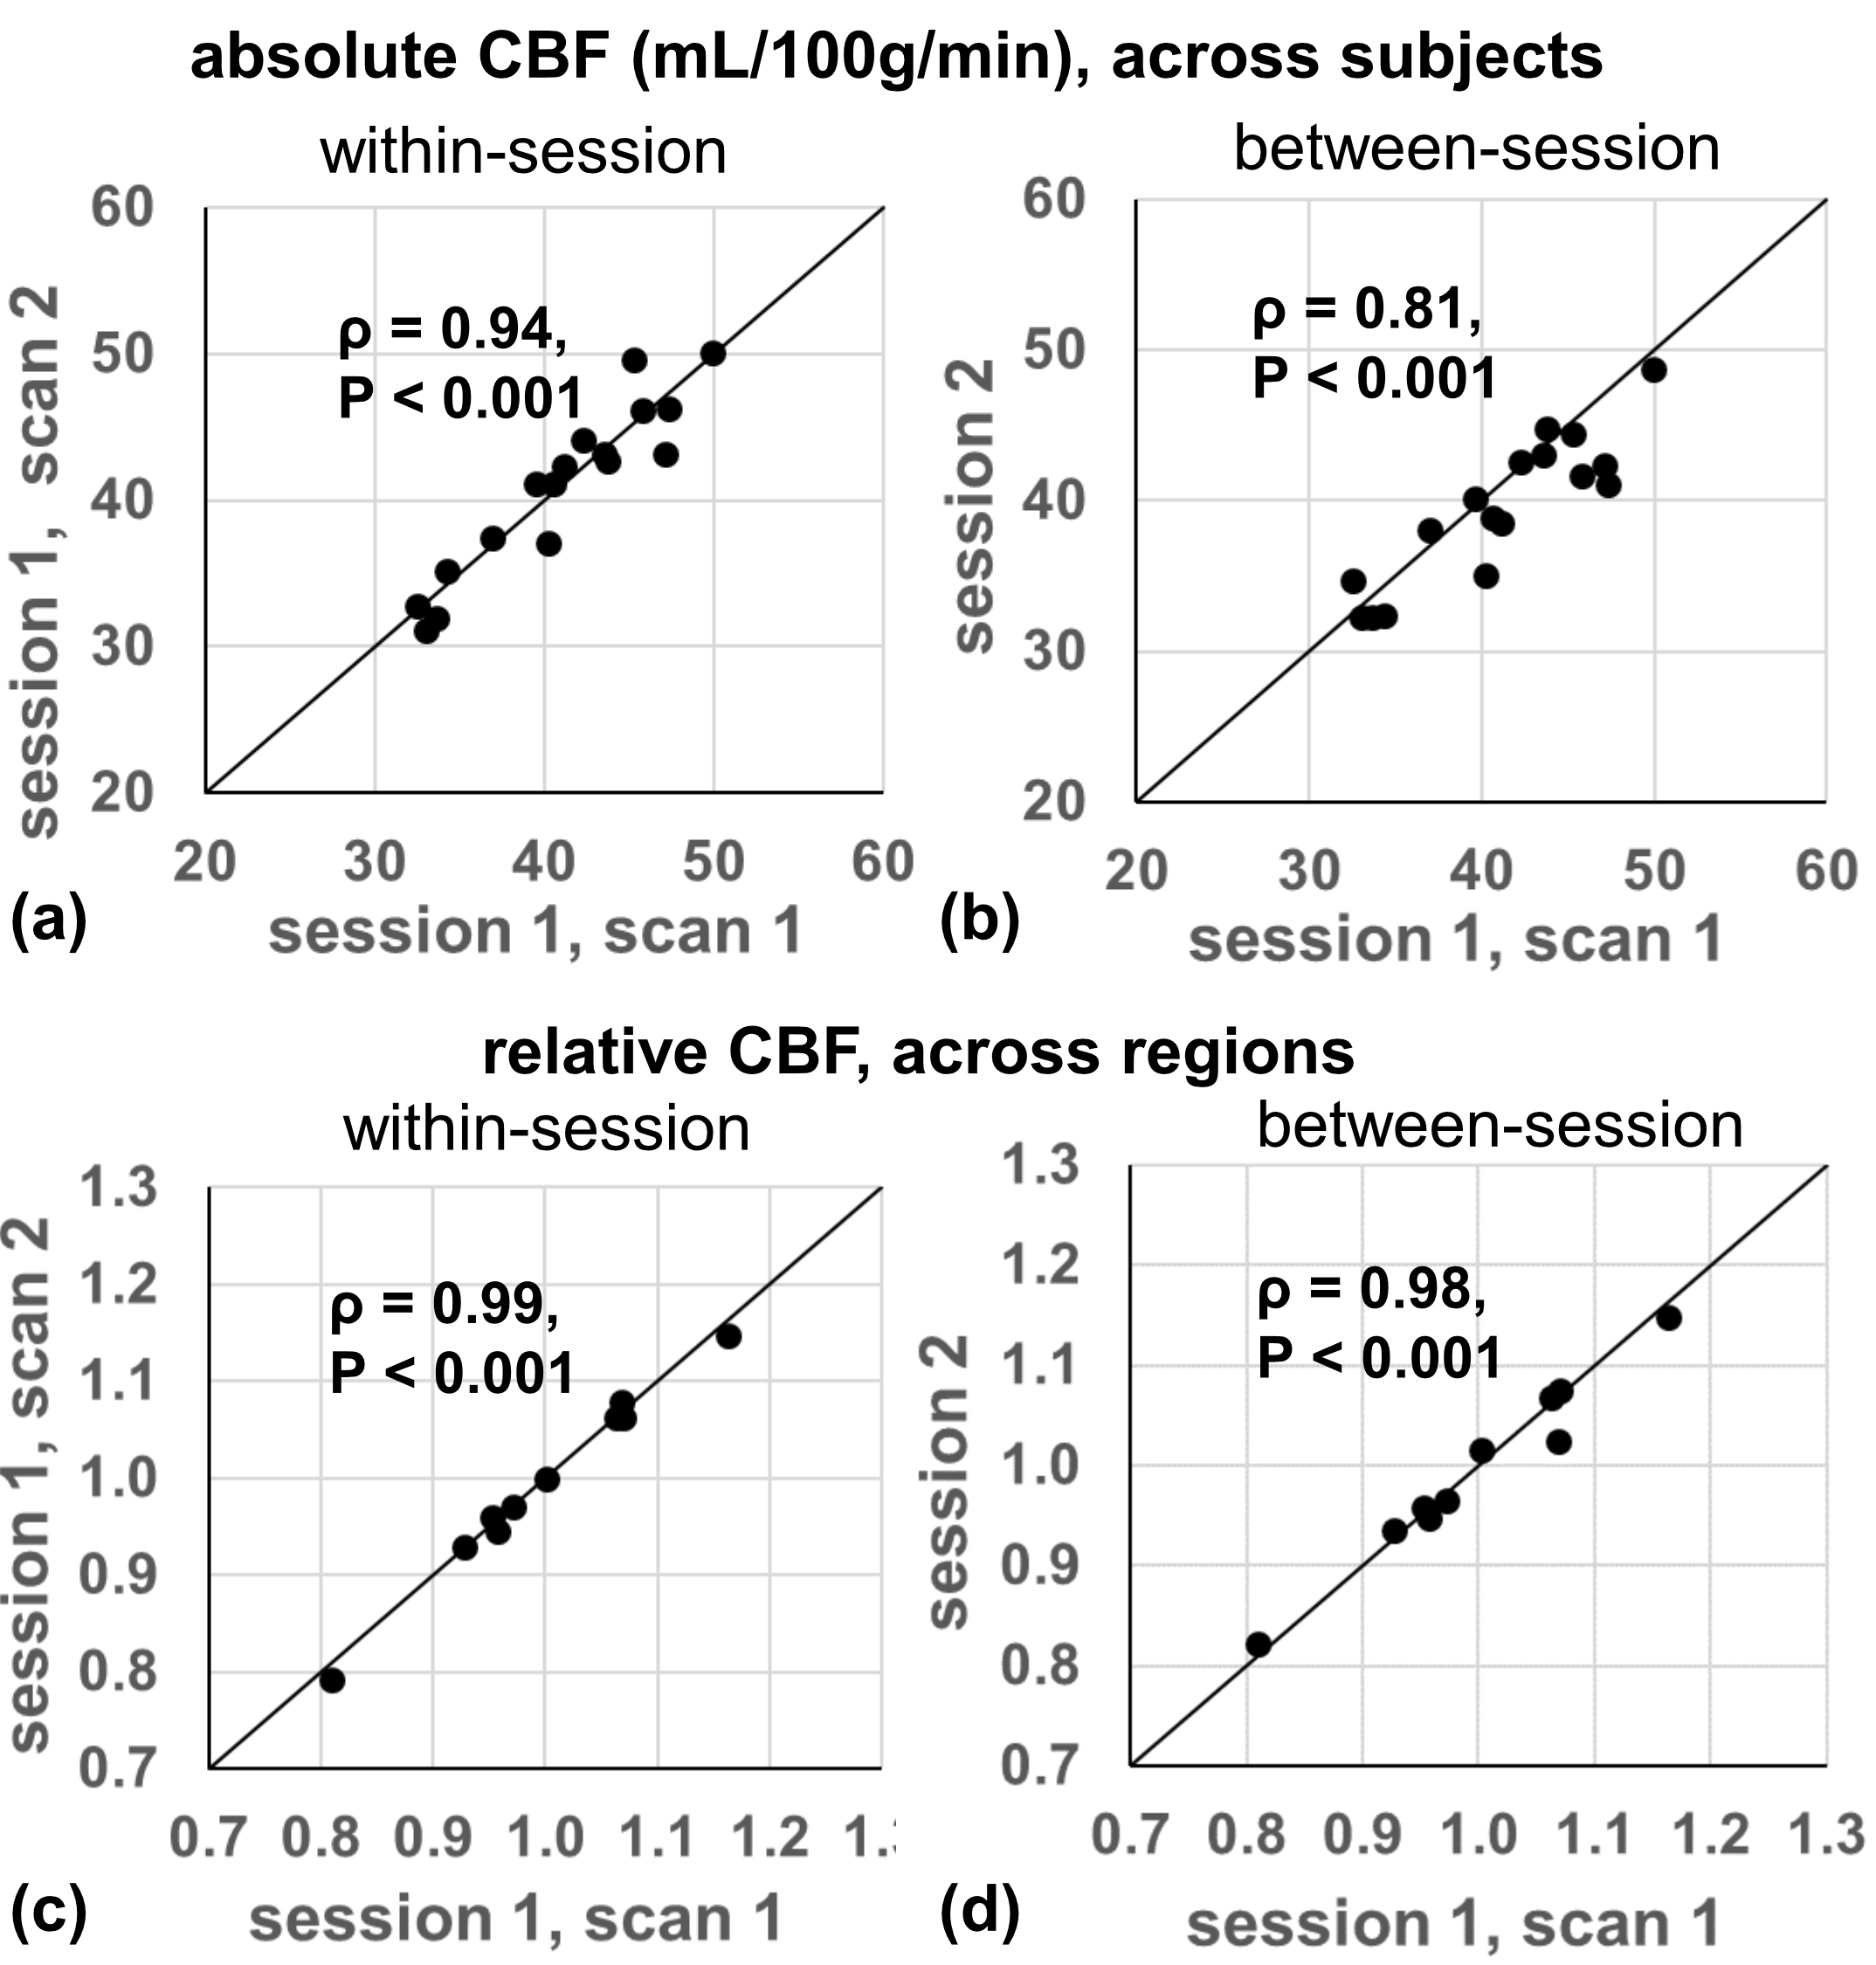
Velocity selective inversion (VSI) based velocity selective arterial spin labeling (VSASL) was recommended by a recent guideline paper. We conducted a test-retest study to evaluate the reliability of 3D VSI-VSASL. The correlations between repeated measures were 0.94/0.81 (within- /between-session) for individual absolute CBF and 0.99/0.98 for regional relative CBF. The intraclass correlation coefficients were 0.88/0.77 for absolute CBF and 0.92/0.85 for regional relative CBF. Between-subject variation in CBF was partially contributed by age and physiological parameters. VSI-VSASL demonstrates moderate to excellent reliability for detecting between-subject and between-region variations among healthy subjects, suggesting its merit in clinical applications.Introduction
Velocity selective inversion (VSI) based velocity selective arterial spin labeling (VSASL) has been developed for quantitative measurement of cerebral blood flow (CBF) with the advantages of low susceptibility to the prolonged arterial transit time and high sensitivity to brain perfusion signal 1,2. More recently, the first guideline paper on VSASL recommended VSI as a promising labeling approach for brain applications 3. Here we conducted a test-retest study to evaluate the reliability of VSI-prepared 3D VSASL with whole-brain coverage to detect baseline CBF variations both among healthy subjects and in different brain regions.Methods
This study was conducted on a 3T Philips Ingenia scanner. Seventeen healthy volunteers (25-66 years old, 10M/7F) providing written informed consent were enrolled in a two-session study with a 10-minute break outside the scanner. Two VSASL measures were performed in the 1st session and another one in the 2nd session. Vital signs including systolic/diastolic/mean blood pressure (SBP/DBP/MAP), heart rate (HR), and arterial oxygen saturation (Ya), were measured before sessions 1, and 2, respectively. The end-tidal CO2 (EtCO2) was recorded after session 2.The VSI pulse train was described previously 1,2 and employed a cut-off velocity (Vcut) of 2.0 cm/s with bipolar gradient lobes (23 mT/m strength, 0.6 ms duration, 0.2 ms ramp time). A vascular crushing module with a T2 preparation pulse train was applied at the same Vcut. 3D GRASE readout with the following parameters: FOV=218x218x120mm3, acquired resolution=3.4x3.6x5mm3, TR/TE=3791/14ms, SENSE=2.5, TSE/EPI factor=12/15, 6 pairs of label and control acquired with a duration of 3min20sec. The proton-density weighted M0 scan with TR of 10sec. Additionally, T1 weighted MPRAGE, global CBF using PC MRI 4, and blood T1 at the internal jugular vein (IJV) 5,6 were acquired. The blood T1 was converted to hematocrit (Hct) via a calibration plot 4.
ASL images were motion corrected and smoothed with a Gaussian kernel of 4 mm. Grey matter (GM) mask and regional ROIs obtained from the segmentation of MPRAGE in SPM12 (University College London, UK) and MRICloud (https://braingps.mricloud.org/) 7 were frontal lobe, temporal lobe, occipital lobe, parietal lobe, limbic regions, deep gray nuclei including basal ganglia and thalami, insular cortex, anterior cingulate cortex, posterior cingulate cortex, and cerebellum. The relative CBF of each GM ROI was calculated as their absolute CBF values normalized by the individual’s global GM CBF.
The within- and between-session repeatability was assessed by scatter plot, coefficient of variation (CoV), Pearson’s correlation coefficient (ρ), and the intraclass correlation coefficient (ICC). The difference in regional CBF was tested by the one-way ANOVA and pair-wise multiple comparisons with Bonferroni correction.
Results and Discussion
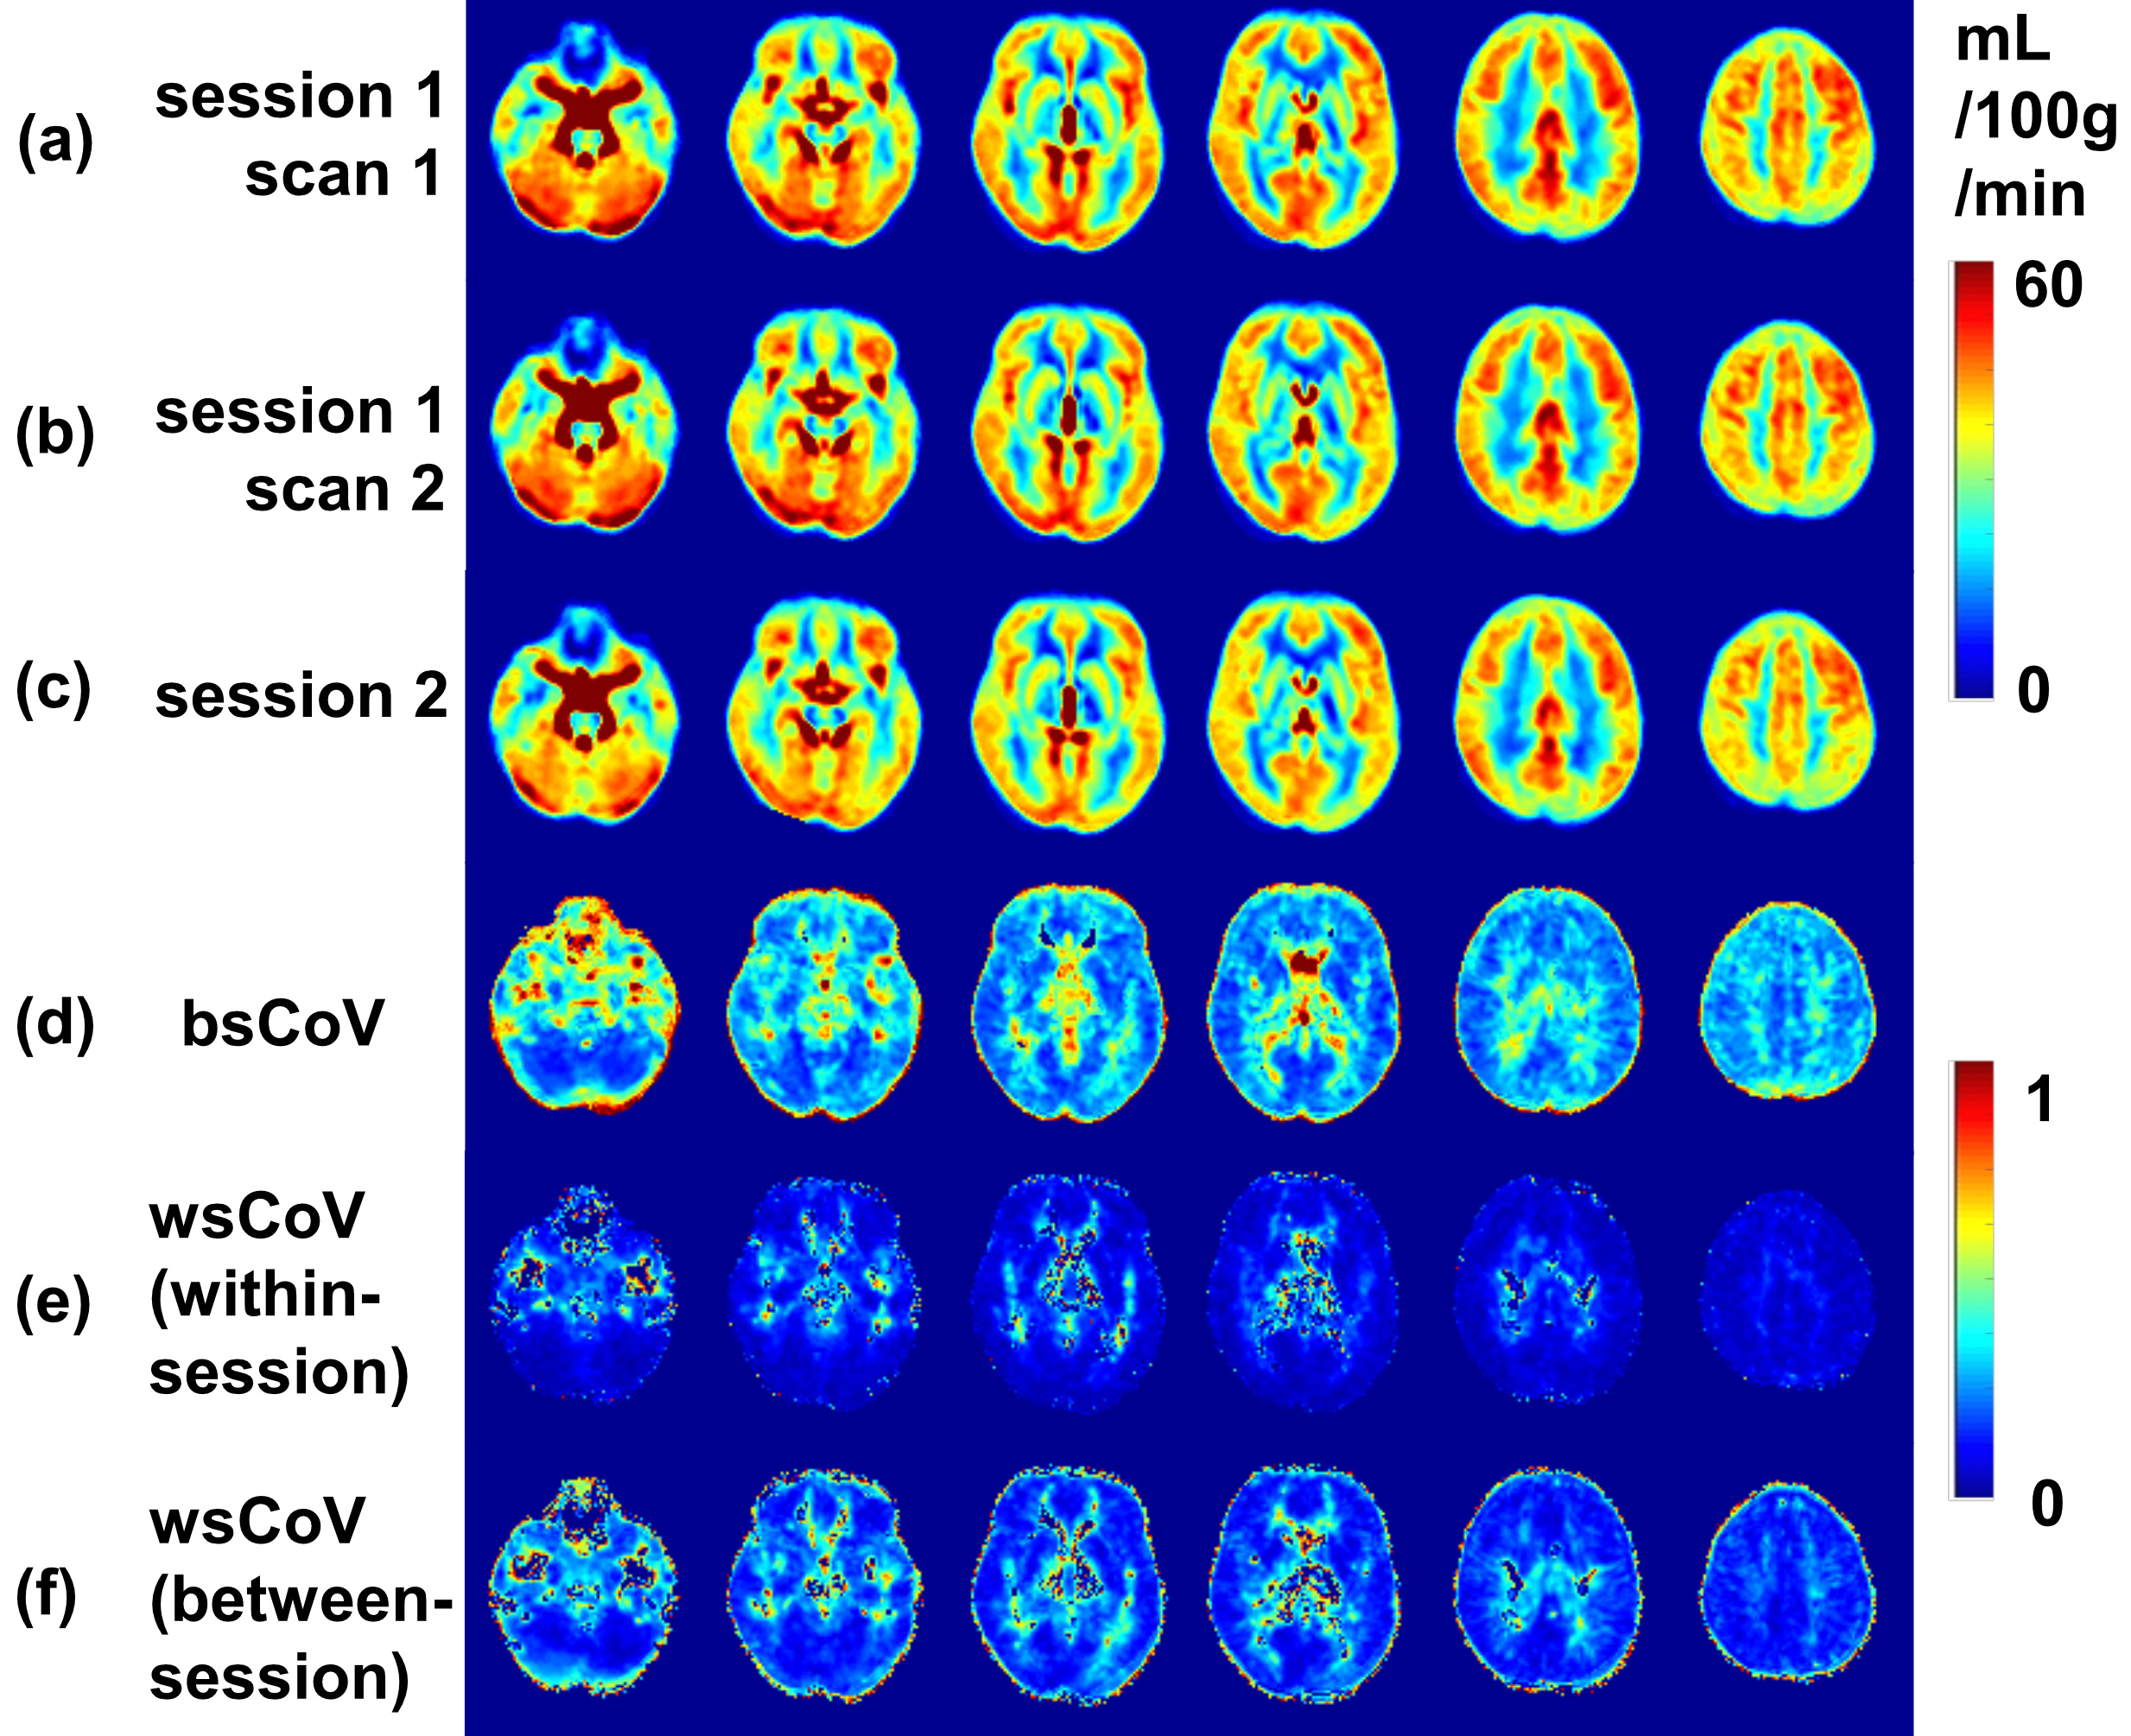
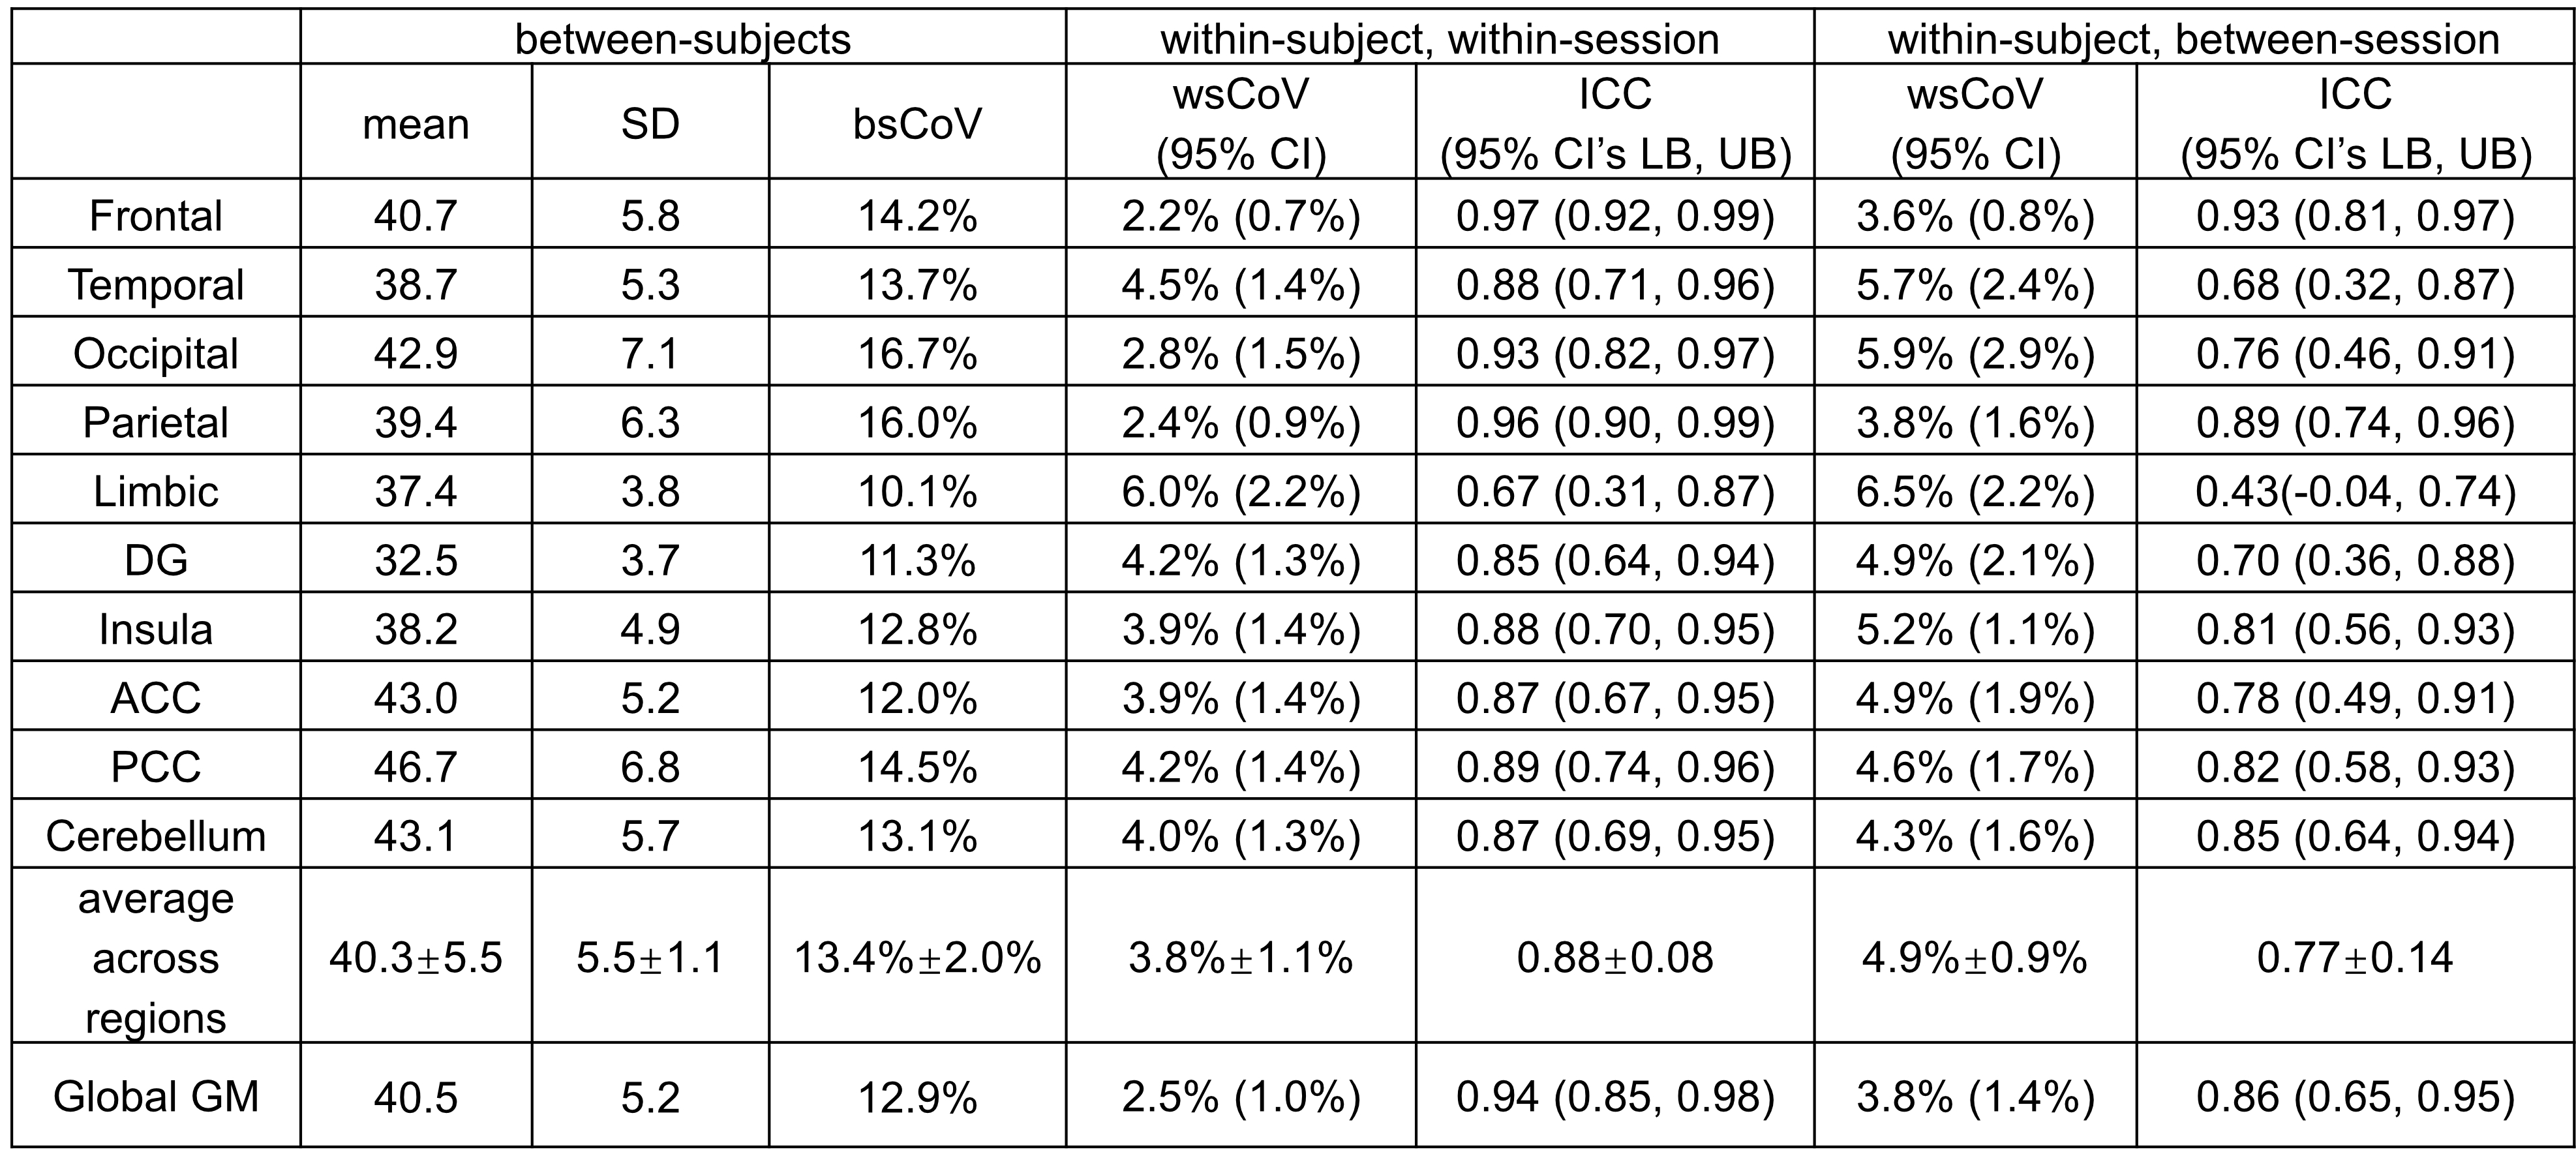
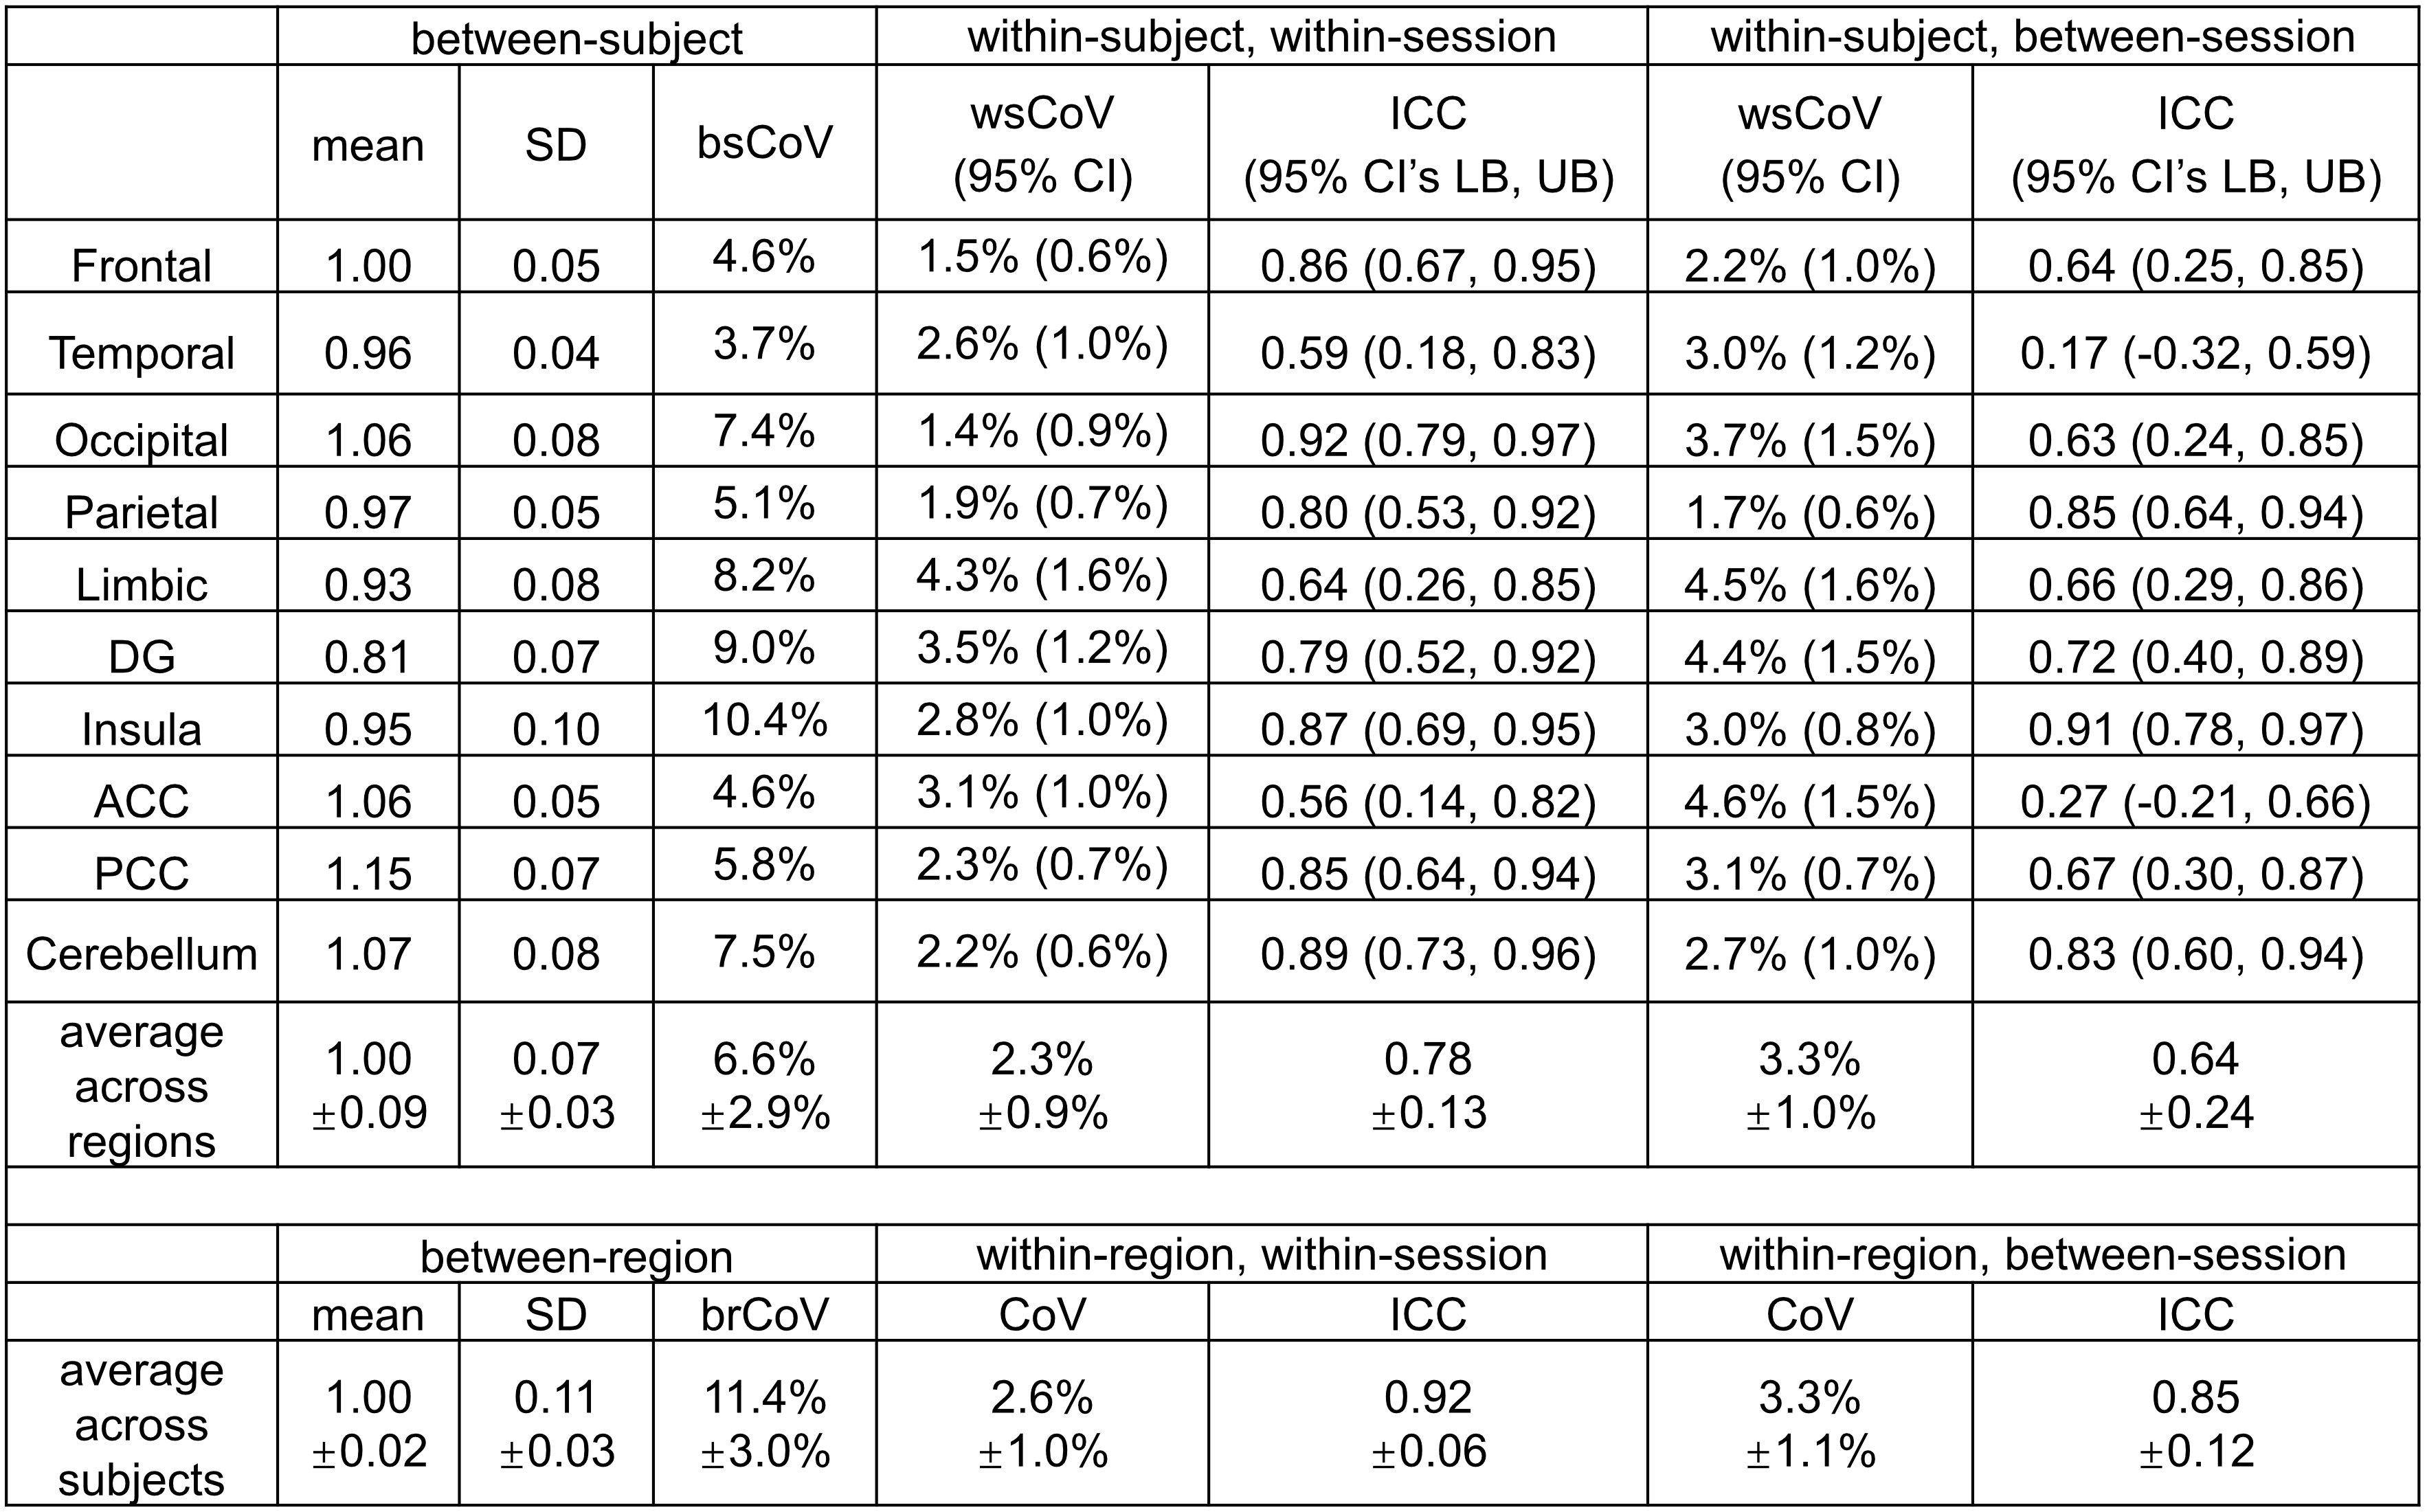
Group-averaged CBF maps normalized to the MNI space are shown in Figure 1a-c. The CoV maps show substantially larger between-subject variability than within-subject variability (Figure 1d-f). GM shows considerably less variance compared to WM as well as CSF close to major arteries or within ventricles. Scatter plots show the excellent correlation of within-session and between-session measurements for the absolute CBF of global GM across 17 subjects (Figure 2a,b) and relative CBF across 10 GM ROIs (Figure 2c,d).Quantitative measurements and reproducibility in different brain regions are reported in Table 1 for absolute CBF, and Table 2 for relative CBF. Within-subject CoVs were slightly higher at between-session than at within-session (4.9±0.9% vs. 3.8±1.1%, P<0.01, Table 1), but both were 63-72% lower compared to the between-subject CoV (13.4±2.0%). The ICC values ranged from good to excellent in all GM regions (Table 1), with the highest in frontal and parietal lobes, and the lowest in limbic, temporal, and deep gray nuclei. The relative CBF (Table 2) among regions was not the same (P<0.001 ANOVA) with higher values in the occipital (1.06), anterior cingulate cortex (1.06), posterior cingulate cortex (1.15), cerebellum (1.07) and lower values in temporal (0.96), parietal (0.97), limbic (0.93), insula (0.95), and deep gray (0.81) regions (P<0.05). Finally, the between-region CoV across subjects was 11.4±3.0%, with excellent ICC values for detecting regional differences (Table 2).
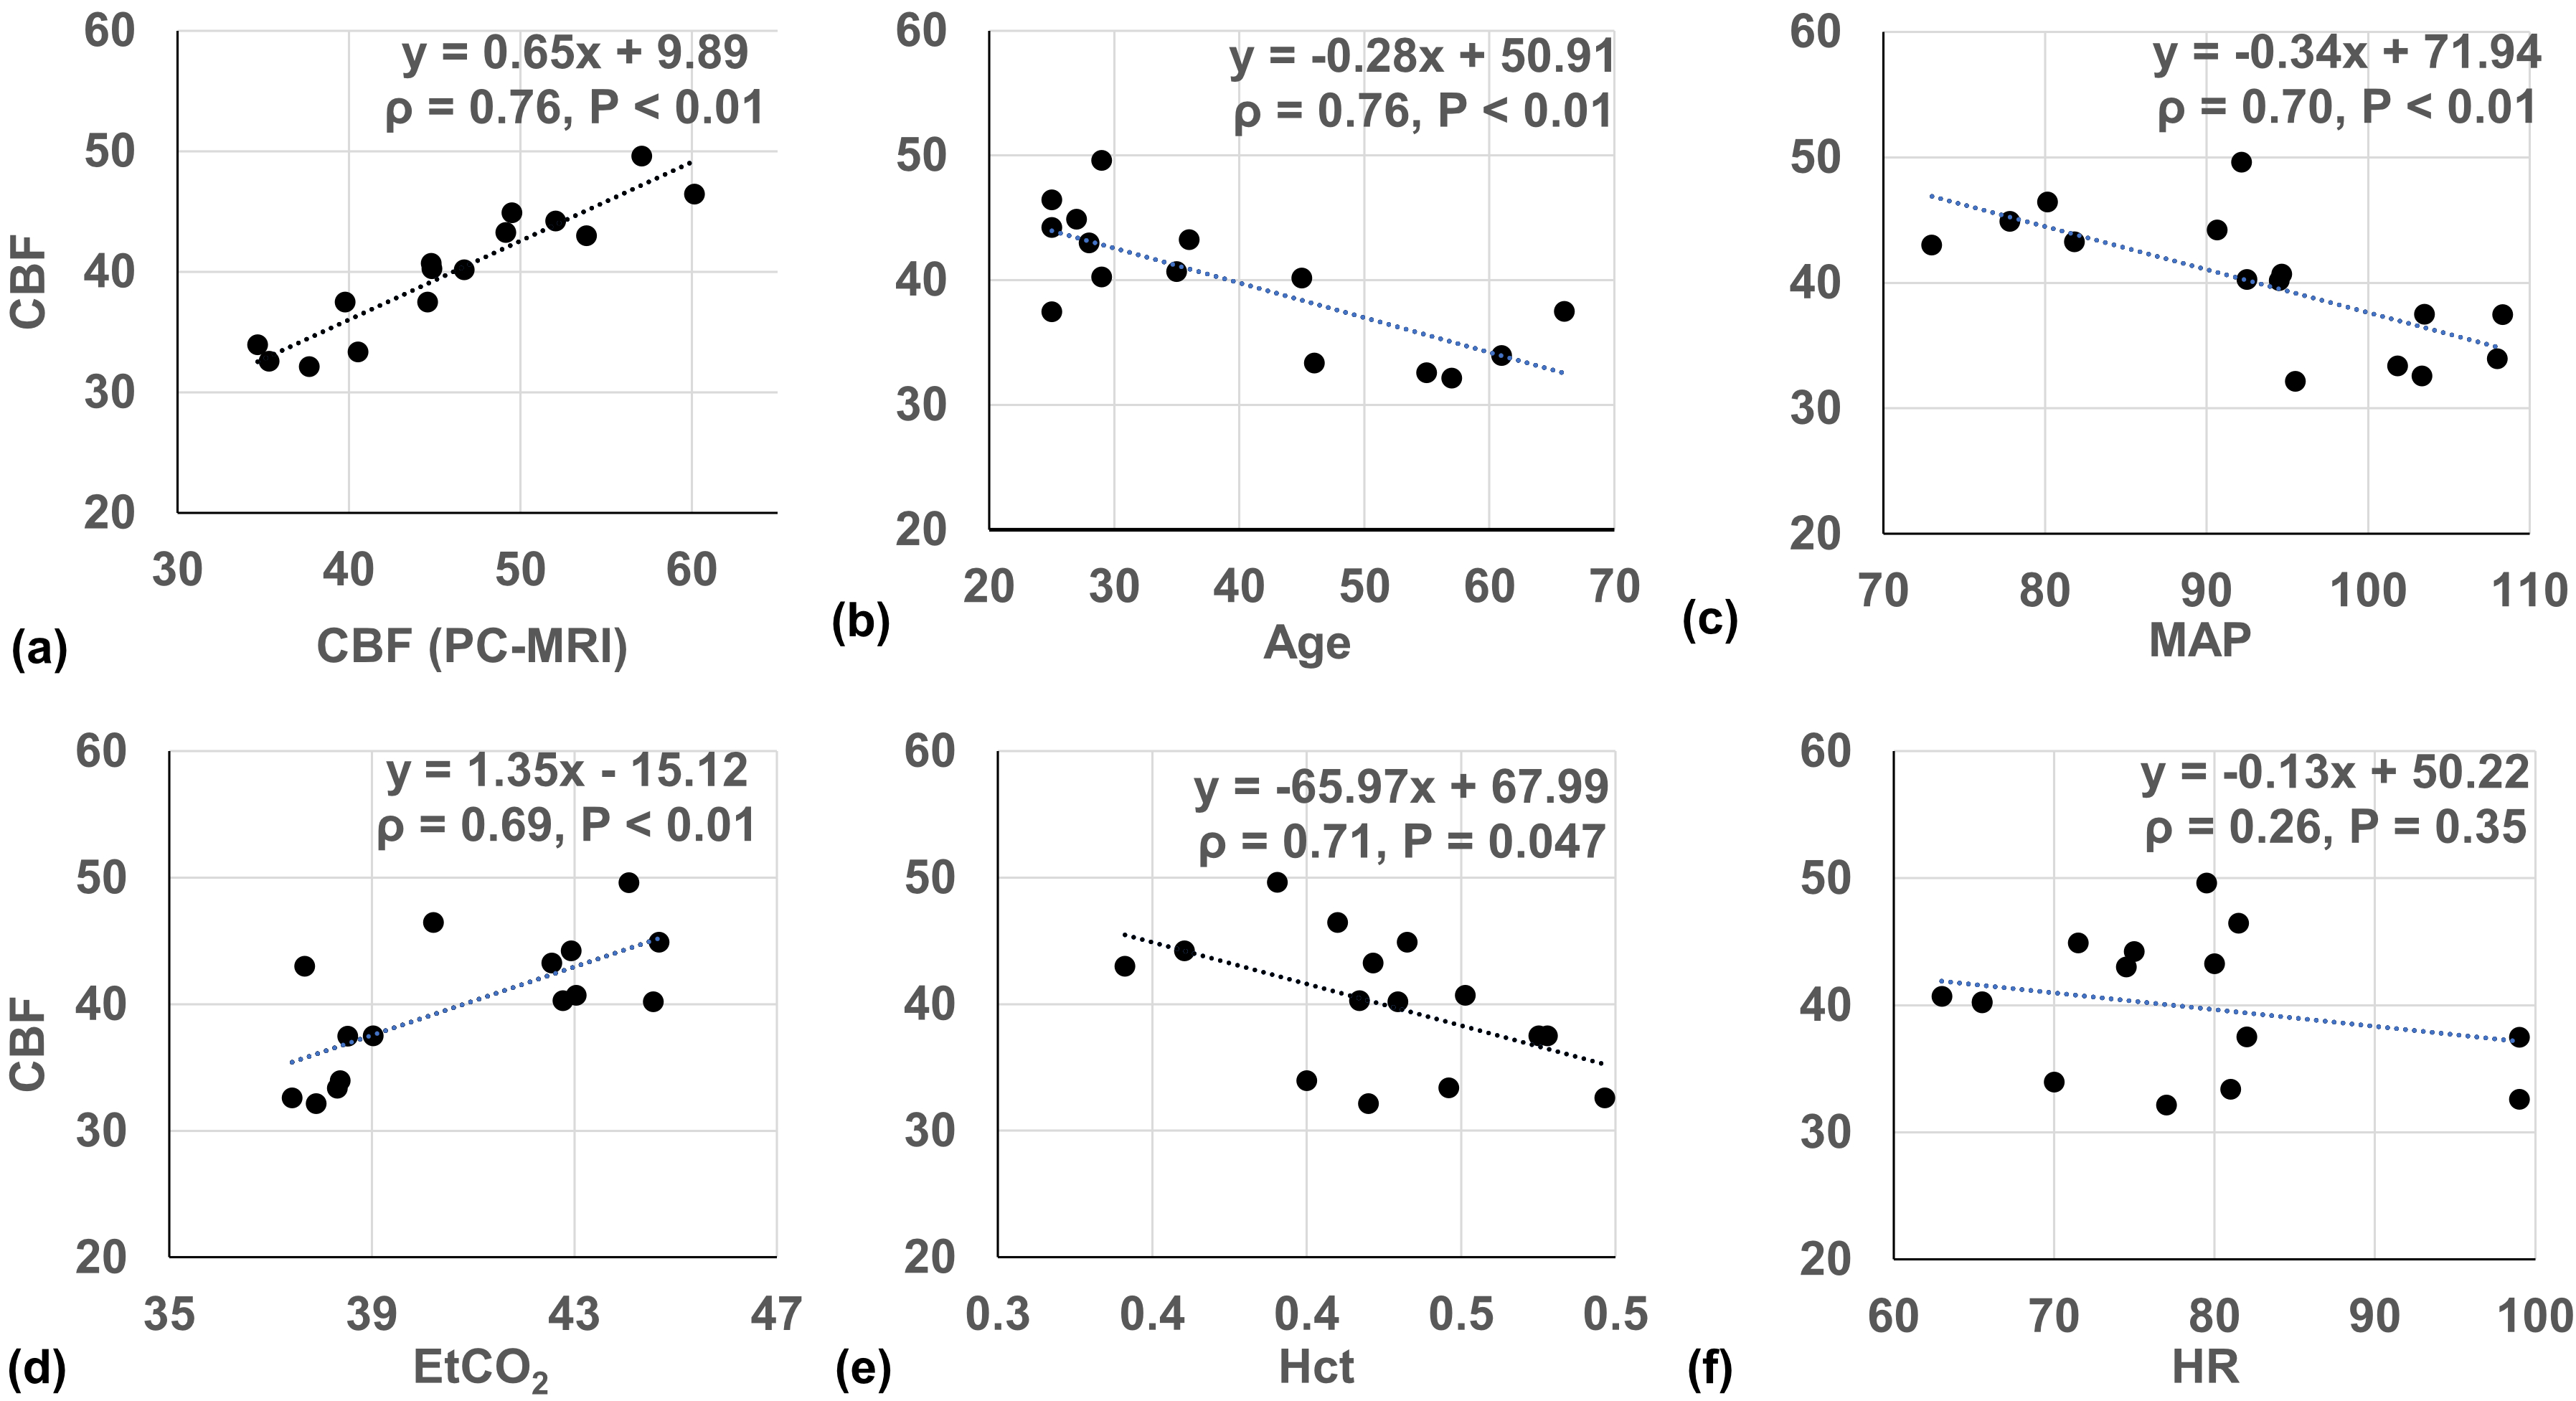
Linear regression between CBF of global GM and the individual physiological parameters are shown as scatter plots in Figure 3 to further evaluate the source of between-subject variations. VSASL-derived GM CBF and PC-MRI-derived global CBF were significantly correlated (ρ=0.93, P<0.01, Figure 3a). GM CBF was negatively correlated with age (ρ=0.76, P <0.01, Figure 3b), SBP (ρ=0.71, P<0.01), DBP (ρ=0.63, P=0.01), MAP (ρ=0.70, P<0.01, Figure 3c), Hct (ρ=0.71, P=0.047, Figure 3e), positively correlated with EtCO2 (ρ=0.69, P<0.01, Figure 3d), and without significant correlation with HR (ρ=0.26, P=0.35, Figure 3f).
Conclusion
3D VSI-prepared VSASL demonstrates high correlations of within-session and between-session measurements, low CoV, and moderate to excellent ICC for within-subject absolute CBF and within-region relative CBF, suggesting sufficient reliability, for detecting between-subject and between-region variations among healthy subjects using absolute and relative CBF, which are important to ensure its clinical utility.Acknowledgements
No acknowledgement found.References
1 Qin Q, van Zijl PCM. Velocity-selective-inversion prepared arterial spin labeling. Magn Reson Med 2016; 76: 1136–1148.
2 Liu D, Xu F, Li W, van Zijl PC, Lin DD, Qin Q. Improved velocity-selective-inversion arterial spin labeling for cerebral blood flow mapping with 3D acquisition. Magn Reson Med 2020; 84: 2512–2522.
3 Qin Q, Alsop DC, Bolar DS, Hernandez-Garcia L, Meakin J, Liu D et al. Velocity-selective arterial spin labeling perfusion MRI: A review of the state of the art and recommendations for clinical implementation. Magn Reson Med 2022; 88: 1528–1547.
4 Xu F, Li W, Liu P, Hua J, Strouse JJ, Pekar JJ et al. Accounting for the role of hematocrit in between-subject variations of MRI-derived baseline cerebral hemodynamic parameters and functional BOLD responses. Hum Brain Mapp 2018; 39: 344–353.
5 Qin Q, Strouse JJ, van Zijl PCM. Fast measurement of blood T1 in the human jugular vein at 3 Tesla. Magn Reson Med 2011; 65: 1297–1304.
6 Li W, Liu P, Lu H, Strouse JJ, van Zijl PCM, Qin Q. Fast measurement of blood T1 in the human carotid artery at 3T: Accuracy, precision, and reproducibility. Magn Reson Med 2017; 77: 2296–2302.
7 Mori S, Wu D, Ceritoglu C, Li Y, Kolasny A, Vaillant MA et al. MRICloud: Delivering High-Throughput MRI Neuroinformatics as Cloud-Based Software as a Service. Computing in Science Engineering 2016; 18: 21–35.
Figures