1176
Integrated heart-brain 4D flow MRI evaluation of hemodynamic coupling in healthy aging adults1Department of Radiology, Feinberg School of Medicine, Northwestern University, Chicago, IL, United States, 2Department of Medical Physics, Institute of Physics, University of Greifswald, Greifswald, Germany, 3Psychiatry and Behavioral Sciences, Northwestern University, Chicago, IL, United States
Synopsis
Keywords: Data Analysis, Velocity & Flow, Cerebral arteries
Age-related changes in cardiovascular hemodynamics may be associated with brain changes. However, this relationship is not clear since blood flow in the heart and brain are usually imaged and analyzed in separate exams and pipelines. We have developed a technique for parameter mapping in both the aorta and intracranial vessels to allow for integrated MRI evaluation of heart-brain hemodynamic coupling. This study demonstrates a single MRI study and analysis pipeline to facilitate more comprehensive, integrated heart-brain hemodynamic analysis in clinical and research settings.
Introduction
Aortic stiffening, measured by carotid-femoral pulse wave velocity (PWV), lessens dampening of blood flow from the heart, potentially increasing pulsatility in cerebral arteries.1 This may lead to brain injury, including cortical atrophy, microbleeds, and potentially dementia.1,2 Underlying mechanisms are not fully understood, necessitating new tools to integrate hemodynamic analyses of the aorta and cerebral vessels. 4D flow MRI (time-resolved three-directional velocity encoding) measures blood velocity in all three spatial dimensions.3,4 Cardiovascular and neuroimaging evaluations are usually performed separately. A new protocol for heart-brain MRI was introduced enabling 4D flow MRI of thoracic and intracranial vessels in 6-8 min and 7-12 min, respectively.5 Parametric mapping techniques have been developed for aortic hemodynamics6 but never applied to the brain. We developed parameter mapping in the aorta and intracranial vessels for more integrated heart-brain MRI evaluation of hemodynamic coupling. We hypothesized a) hemodynamics (velocity, kinetic energy (KE), and time-to-peak) are associated between the thoracic aorta and cerebral arteries and b) velocity, KE, and time-to-peak decrease with age in both regions while aortic PWV increases.Methods
17 healthy participants (age=53.5 ± 16.3 [25-76] years) underwent heart-brain MRI at 3T (MAGNETOM Prisma, Siemens, Erlangen, Germany). Exam included prototype free-breathing whole heart 4D flow MRI (venc=120-150 cm/s, compressed sensing R=10.2, 2.5×2.5×2.5 mm3, temporal resolution=41.3 ms) and intracranial dual-venc 4D flow MRI (venc=50-60 cm/s and 100-120 cm/s, k-t GRAPPA R=5, 1.0×1.0×1.0 mm3, temporal resolution=85.4 ms). Exclusion criteria included history of cardio- or cerebrovascular problems, BMI>40, blood pressure>160/90 mmHg, heart or brain surgery, stroke, brain injury, seizures, coma, diabetes, cancer, liver or kidney disease, arrhythmia, regular smoking, or drug abuse. Figure 1 shows the imaging workflow. Whole heart and intracranial 4D flow MRI datasets were preprocessed including calculation of time-averaged 3D phase-contrast angiograms (PC-MRA).7 Thoracic aorta and cerebral arteries were manually segmented from PC-MRAs using Mimics (Materialize, Belgium). Cerebral artery segmentation included internal carotid arteries, A1 segment of anterior cerebral arteries, M1 segment of middle cerebral arteries, P2A segment of posterior cerebral arteries, and the basilar artery. Aortic PWV was evaluated using a cross-correlation algorithm with a repeated approach.8 Parameter mapping of hemodynamic parameters was adapted from previous methods.6 To improve accuracy, vessel segmentations were processed in two steps: 1) 3D spatial smoothing with a Gaussian convulsion kernel and 2) removing voxels whose velocity versus time curve had a standard deviation over 50% of the venc. Maximum velocity (Vmax) was calculated on a voxel-wise basis, and the 95th-98th percentile of values were averaged.6 Mean velocity (Vmean) and KE were calculated on a voxel-wise basis, then all values were averaged. Time-to-peak was calculated on a voxel-wise basis as the time from the start of the cardiac cycle until Vmax, then all values were averaged. Parametric maps of Vmax, Vmean, time-to-peak, and KE were created by taking voxel-wise values, collapsing over time, and then collapsing axially by taking the maximum intensity projection (MIP) for Vmax and average for Vmean, time-to-peak, and KE. Velocity versus time curves for each subject were generated by calculating the average velocity across every voxel at each time point in both the aorta and cerebral arteries. Relationships were analyzed using correlation analysis with significance defined as p<0.05.Results
Parametric maps for Vmax, Vmean, time-to-peak, and KE were created for the cerebral arteries and aorta. Maps for an example participant (Figure 2) indicate qualitatively that Vmax, Vmean, and KE tended to decrease as blood travels peripherally, and time-to-peak tended to increase. Velocity versus time curves in the aorta tended to appear more pulsatile than in the cerebral arteries for all participants (Figure 3A-B). Cerebral arteries were significantly correlated with the aorta in time-to-peak (p=0.0027, r=0.68), but not Vmax (p=0.87, r=0.043), Vmean (p=0.34, r=0.24), or KE (p=0.23, r=0.31). PWV in the aorta was significantly correlated with age (p=0.013, r=0.59). Vmean of the aorta (p=0.012, r=-0.59) and Vmean of the cerebral arteries (p=0.048, r=-0.49) were significantly negatively correlated with age. Vmax of the cerebral arteries was significantly negatively correlated with age (p=0.045, r=-0.49), but Vmax of the aorta was not (p=0.89, r=-0.036). KE of the aorta (p=0.0022, r=-0.69) and KE of the cerebral arteries (p=0.030, r=-0.53) were significantly correlated with age. Figure 3C-H and Table 1 illustrate correlation analysis results.Discussion
Heart-brain 4D flow MRI and parametric mapping afford integrated evaluation of the aorta and cerebral arteries, generating qualitative maps of hemodynamics for the same parameters in both regions. This may facilitate future studies of hemodynamic coupling with age. Relationships were identified between aortic and cerebral arterial hemodynamics for time-to-peak, indicating its importance in assessing hemodynamic coupling going forward. Exploring increased temporal resolution, particularly for intracranial hemodynamics, is warranted. Mean velocity and KE decreased with age in both the aorta and cerebral arteries, agreeing with previous studies.9,10 Aortic PWV increased with age, agreeing with previous results.11,12 Peak velocity decreased with age in cerebral vessels but not in the aorta, possibly due to variations in ascending aortic peak velocity with age.9Conclusion
This study supports feasibility of simultaneous acquisition of heart-brain MRI and parametric mapping techniques for unified heart-brain hemodynamic analysis. This approach has potential for investigating hemodynamic coupling in larger cohorts and clinical studies, such as early-stage dementia.Acknowledgements
Funding: NIH NIA P30AG059988, NINDS R21NS122511, Summer Research Scholars Program at Northwestern UniversityReferences
- de Roos A, van der Grond J, Mitchell G, Westenberg J. Magnetic Resonance Imaging of Cardiovascular Function and the Brain. Circulation. 2017;135(22):2178-2195. doi:10.1161/CIRCULATIONAHA.116.021978
- Pase MP, Beiser A, Himali JJ, et al. Aortic Stiffness and the Risk of Incident Mild Cognitive Impairment and Dementia. Stroke. 2016;47(9):2256-2261. doi:10.1161/STROKEAHA.116.013508
- Dyverfeldt P, Bissell M, Barker AJ, et al. 4D flow cardiovascular magnetic resonance consensus statement. Journal of Cardiovascular Magnetic Resonance. 2015;17(1):72. doi:10.1186/s12968-015-0174-5
- Wåhlin A, Ambarki K, Birgander R, et al. Measuring pulsatile flow in cerebral arteries using 4D phase-contrast MR imaging. AJNR Am J Neuroradiol. 2013;34(9):1740-1745. doi:10.3174/ajnr.A3442
- Jarvis K, Moore JE, Aristova M, et al. Heart-brain MRI evaluation in one exam: a feasibility study in healthy aging adults. In: International Society for Magnetic Resonance in Medicine; 2022.
- Jarvis K, Pruijssen JT, Son AY, et al. Parametric Hemodynamic 4D Flow MRI Maps for the Characterization of Chronic Thoracic Descending Aortic Dissection. J Magn Reson Imaging. 2020;51(5):1357-1368. doi:10.1002/jmri.26986
- Bock J, Kreher BW, Hennig J, Markl M. Optimized pre-processing of time-resolved 2 D and 3 D Phase Contrast MRI data. In: 15th Annual Meeting ISMRM; 2007.
- Jarvis K, Scott MB, Soulat G, et al. Aortic Pulse Wave Velocity Evaluated by 4D Flow MRI Across the Adult Lifespan. J Magn Reson Imaging. 2022;56(2):464-473. doi:10.1002/jmri.28045
- Scott MB, Huh H, van Ooij P, et al. Impact of age, sex, and global function on normal aortic hemodynamics. Magn Reson Med. 2020;84(4):2088-2102. doi:10.1002/mrm.28250
- Wu C, Honarmand AR, Schnell S, et al. Age-Related Changes of Normal Cerebral and Cardiac Blood Flow in Children and Adults Aged 7 Months to 61 Years. J Am Heart Assoc. 2016;5(1):e002657. doi:10.1161/JAHA.115.002657
- Jarvis K, Soulat G, Scott M, et al. Investigation of Aortic Wall Thickness, Stiffness and Flow Reversal in Patients With Cryptogenic Stroke: A 4D Flow MRI Study. Journal of Magnetic Resonance Imaging. 2021;53(3):942-952. doi:10.1002/jmri.27345
- Harloff A, Mirzaee H, Lodemann T, et al. Determination of aortic stiffness using 4D flow cardiovascular magnetic resonance - a population-based study. Journal of Cardiovascular Magnetic Resonance. 2018;20(1):43. doi:10.1186/s12968-018-0461-z
Figures
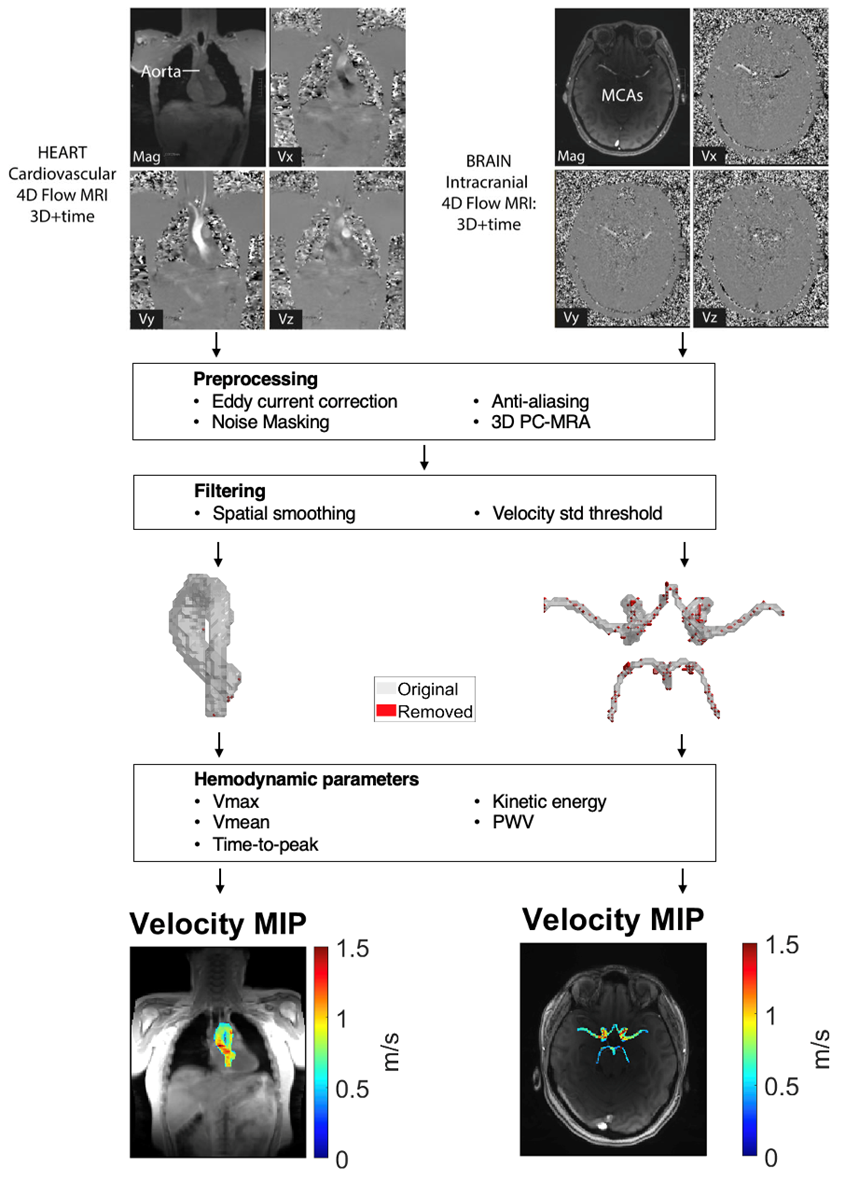
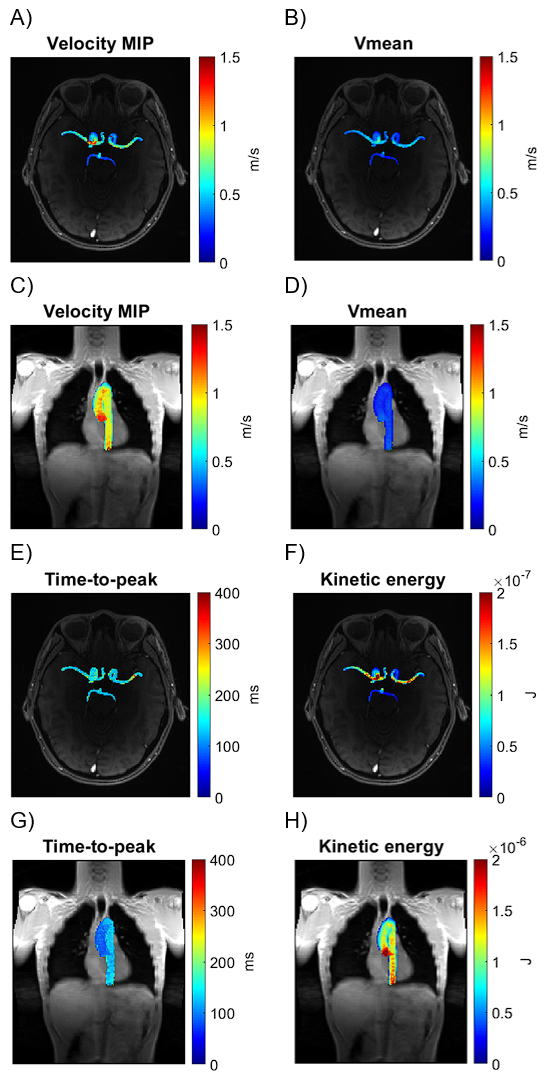
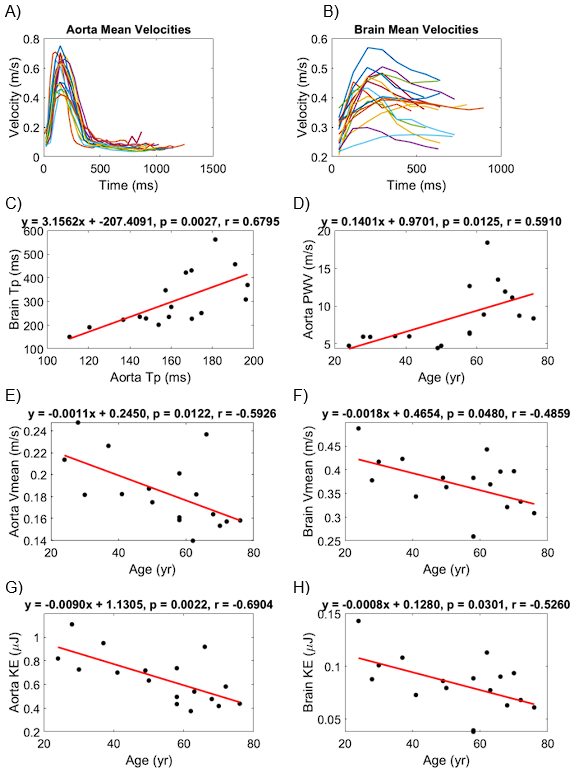
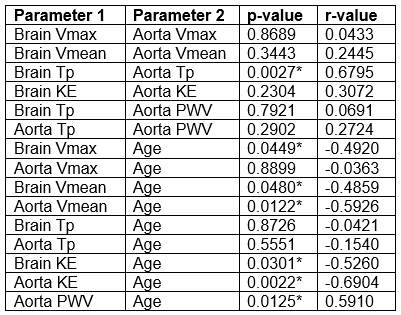
Table 1: Parameter Correlation Analysis Results. Parameter 1 versus Parameter 2. Tp=time-to-peak. KE=kinetic energy. *=p < 0.05.