1175
Towards whole brain mapping of the hemodynamic response function1MARBILab, Enrico Fermi Research Center, Rome, Italy, 2Sapienza University, Rome, Italy, 3Fondazione Santa Lucia IRCCS, Rome, Italy, 4CNR-NANOTEC, Rome, Italy, 5CMRR, Minneapolis, MN, United States
Synopsis
Keywords: Signal Modeling, fMRI, HRF
We characterized a deconvolved haemodynamic response function (dHRF) across the whole cortex exploiting a sine series expansion in a cohort of young healthy subjects from the Human Connectome Project. We report, for different tasks and brain regions, the amplitude, latency, time-to-peak and full-width at half maximum of the fitted BOLD response and of the dHRF. We show that each of those parameters vary throughout the cortex and, to a smaller extent, across subjects. Additionally, the use of a flexible model, like the one we explored in this study, reveals that the HRF in some brain regions deviates from canonicity.Introduction
The shape and features of the hemodynamic response function (HRF), such as its magnitude, latency and duration, have been reported to carry information on the underlying neuronal activity [1] and, therefore, depend on the interaction between complex neuronal, glial and vascular events that lead from a stimulus to the BOLD response [2]. Neural activity in response to a stimulus is task-dependent, region-dependent, subject-dependent and not constant over time [3]. Similarly, the haemodynamic response varies in amplitude, timing and shape [4, 5]. The extent of this variation and its possible sources (across datasets or regions for the same subject, across subjects for the same region, and across regions in group level studies) are current topic of research, with heterogeneous results. In this study, we sought to characterize a deconvolved haemodynamic response function (dHRF) across the whole cortex for the positive BOLD response in case of block design stimulations and linear model analyses. To this end, we applied a flexible model based on a sine series expansion of the response function in a cohort of young healthy subjects from the Human Connectome Project (HCP) [6].Materials and Methods
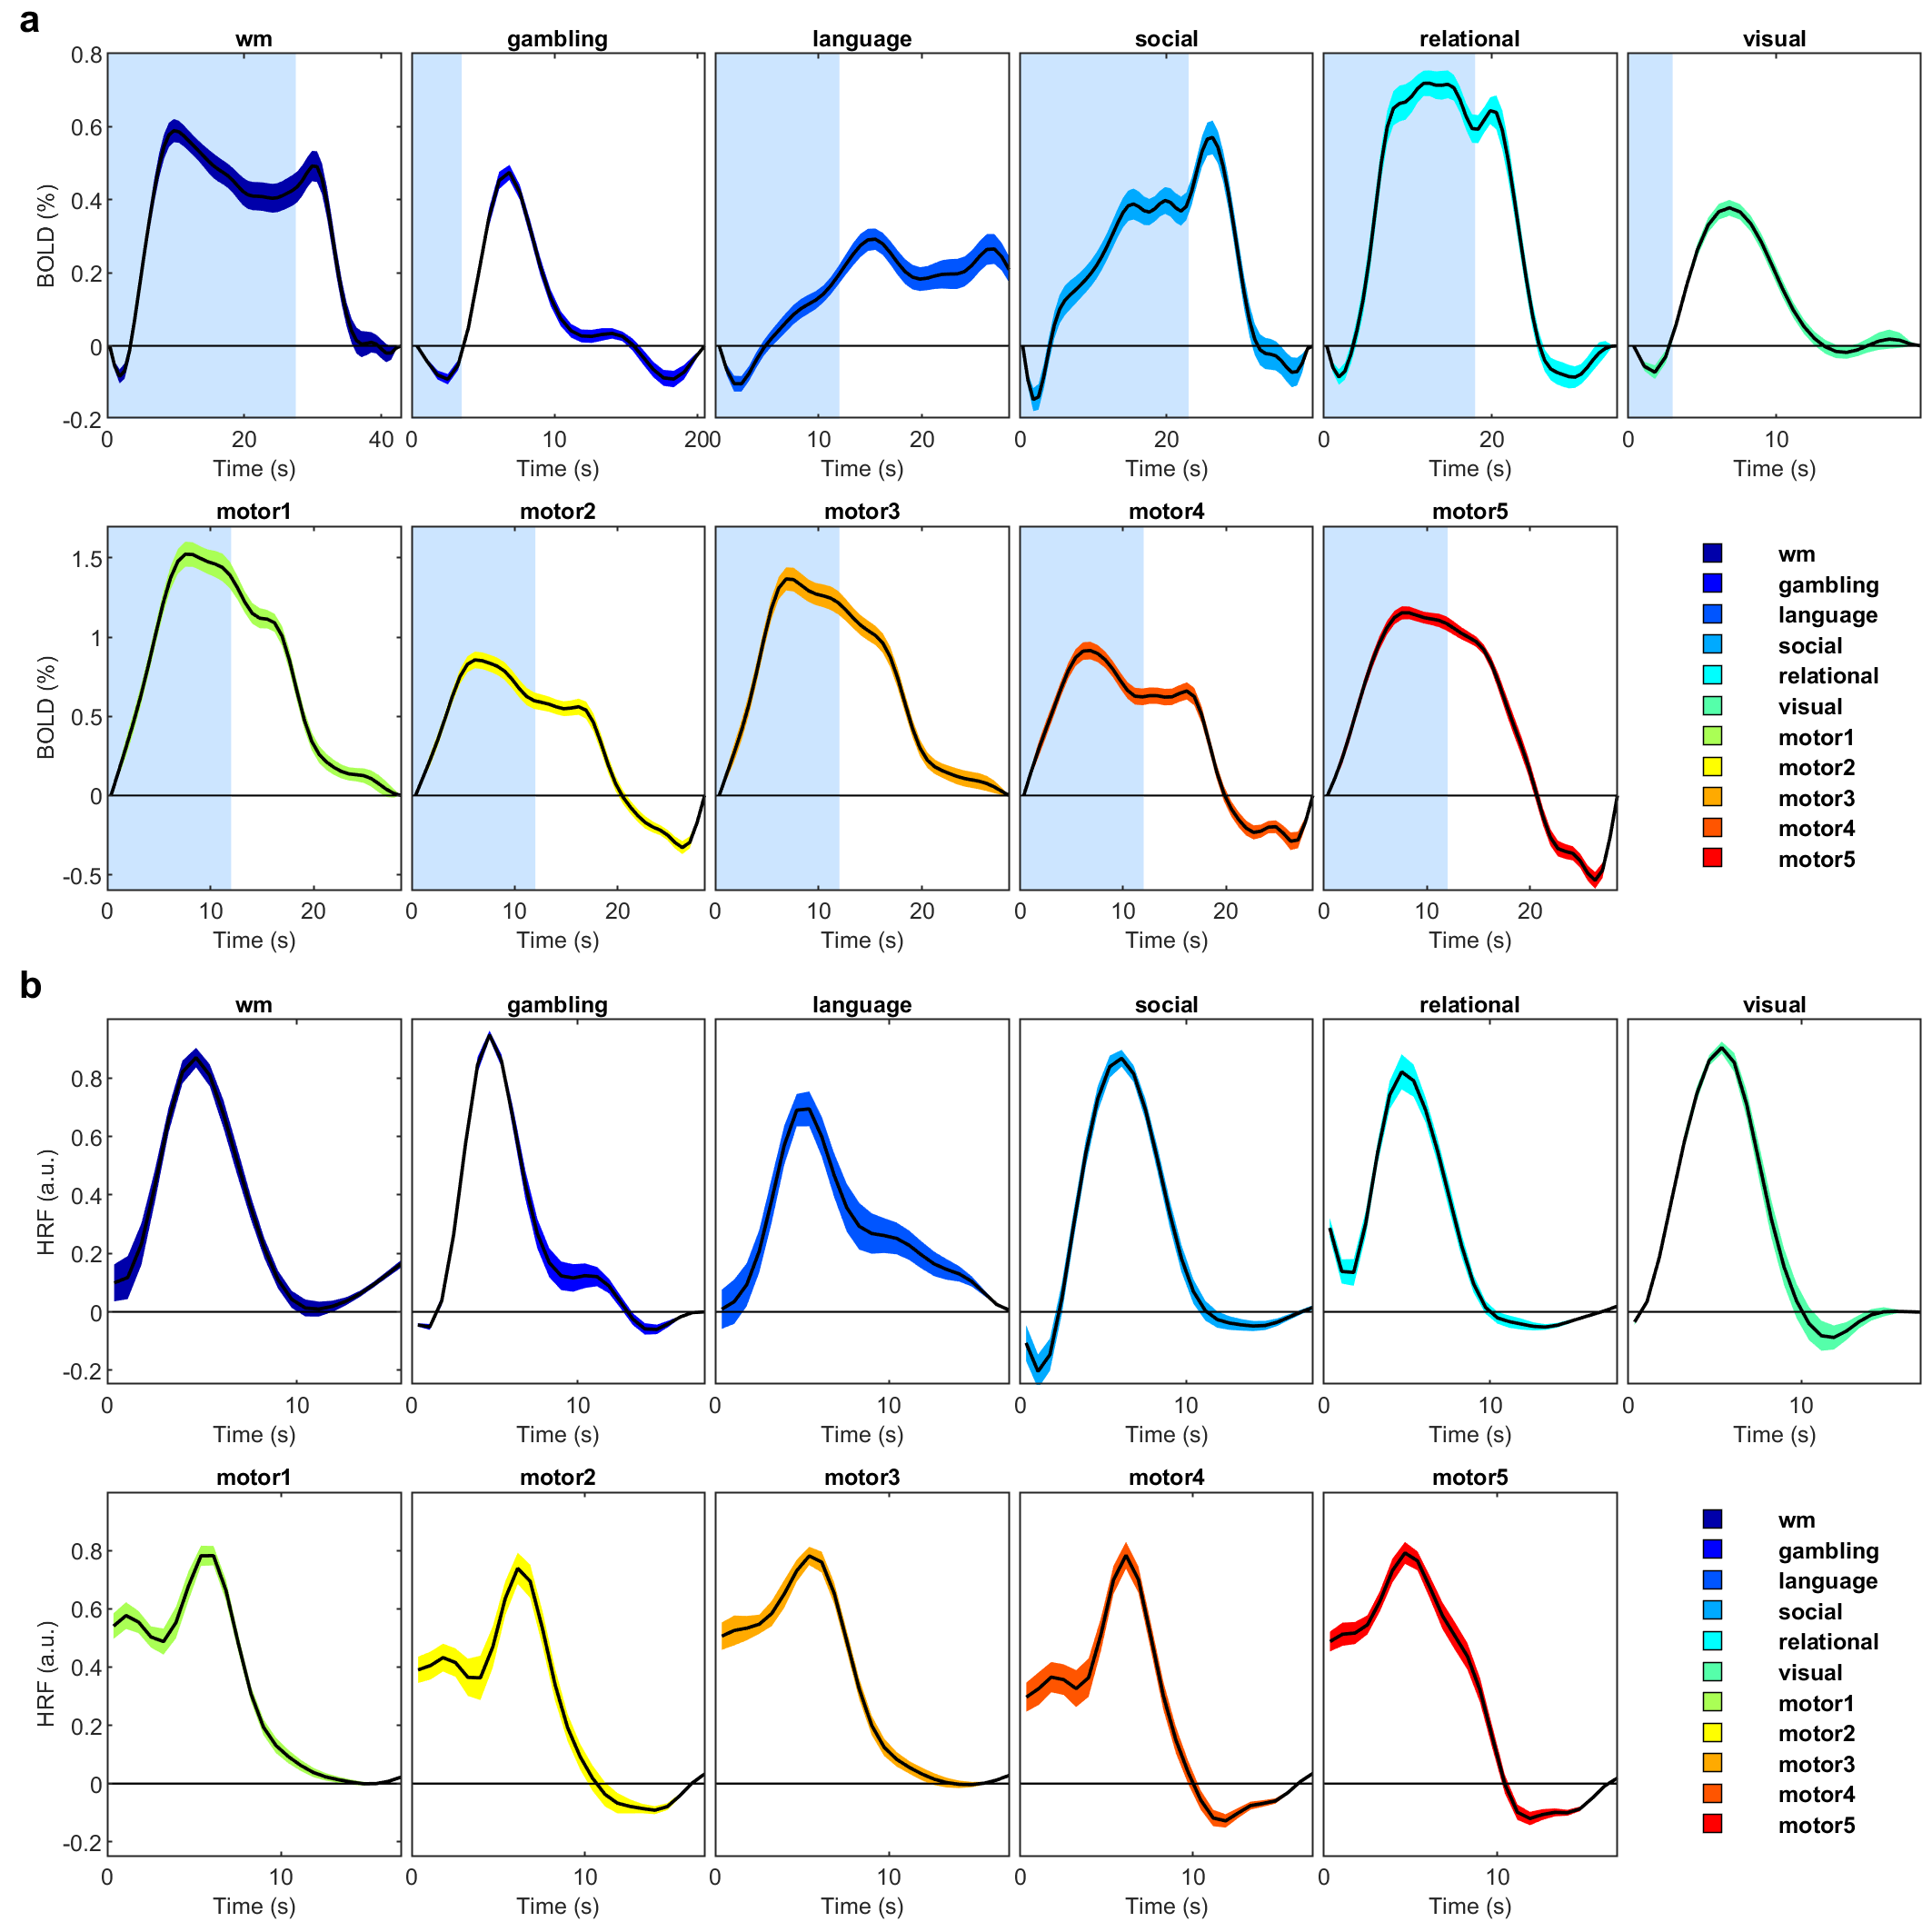
Subjects (N = 48, 24 females, age: 22-35 years) were part of the Q3 release of the HCP [6]. HCP stimulations elicit task-evoked responses in several cortical and subcortical networks. In the present study, we included the following tasks: a) working memory/cognitive control; b) incentive processing; c) visual, motion, somatosensory and motor; d) language processing; e) social cognition; f) relational processing. Our analysis was conducted on datasets that underwent the HCP minimal preprocessing pipeline [7]. Functional analysis of fMRI time series was carried out in the time domain on a voxel basis (3dDeconvolve – AFNI). The average response shape to each stimulus was estimated using a model (dubbed M1) that employed a sine series expansion for the response function, extended from the beginning of the stimulus to 20 seconds after the end of the stimulus. A variable number of basis functions was included in the model: the longest sine period matched the full duration of the fitted response, and faster terms were added in steps following the harmonic series, so that the shortest period was around 4 seconds for all tasks. To estimate the dHRF, the voxel-specific fitted BOLD responses were deconvolved with a boxcar function whose duration matched the task duration, using Tikhonov regularization [8]. Then, to characterize the hemodynamic response for a specific task, the timecourses of the dHRF and fitted responses were averaged within the activated areas for each task and subject, and amplitude, latency, time-to-peak (TTP) and full-width at half maximum (FWHM) were calculated from the averaged dHRF and the fitted response shape. Voxel-wise variance of the estimated dHRF shape from the canonical HRF implemented in SPM12 [9] was investigated. For each voxel and subject, the dHRF was obtained by averaging the dHRFs of tasks for which the voxel was considered to be responding (according to the second-level results) and was then correlated to the canonical HRF.Results
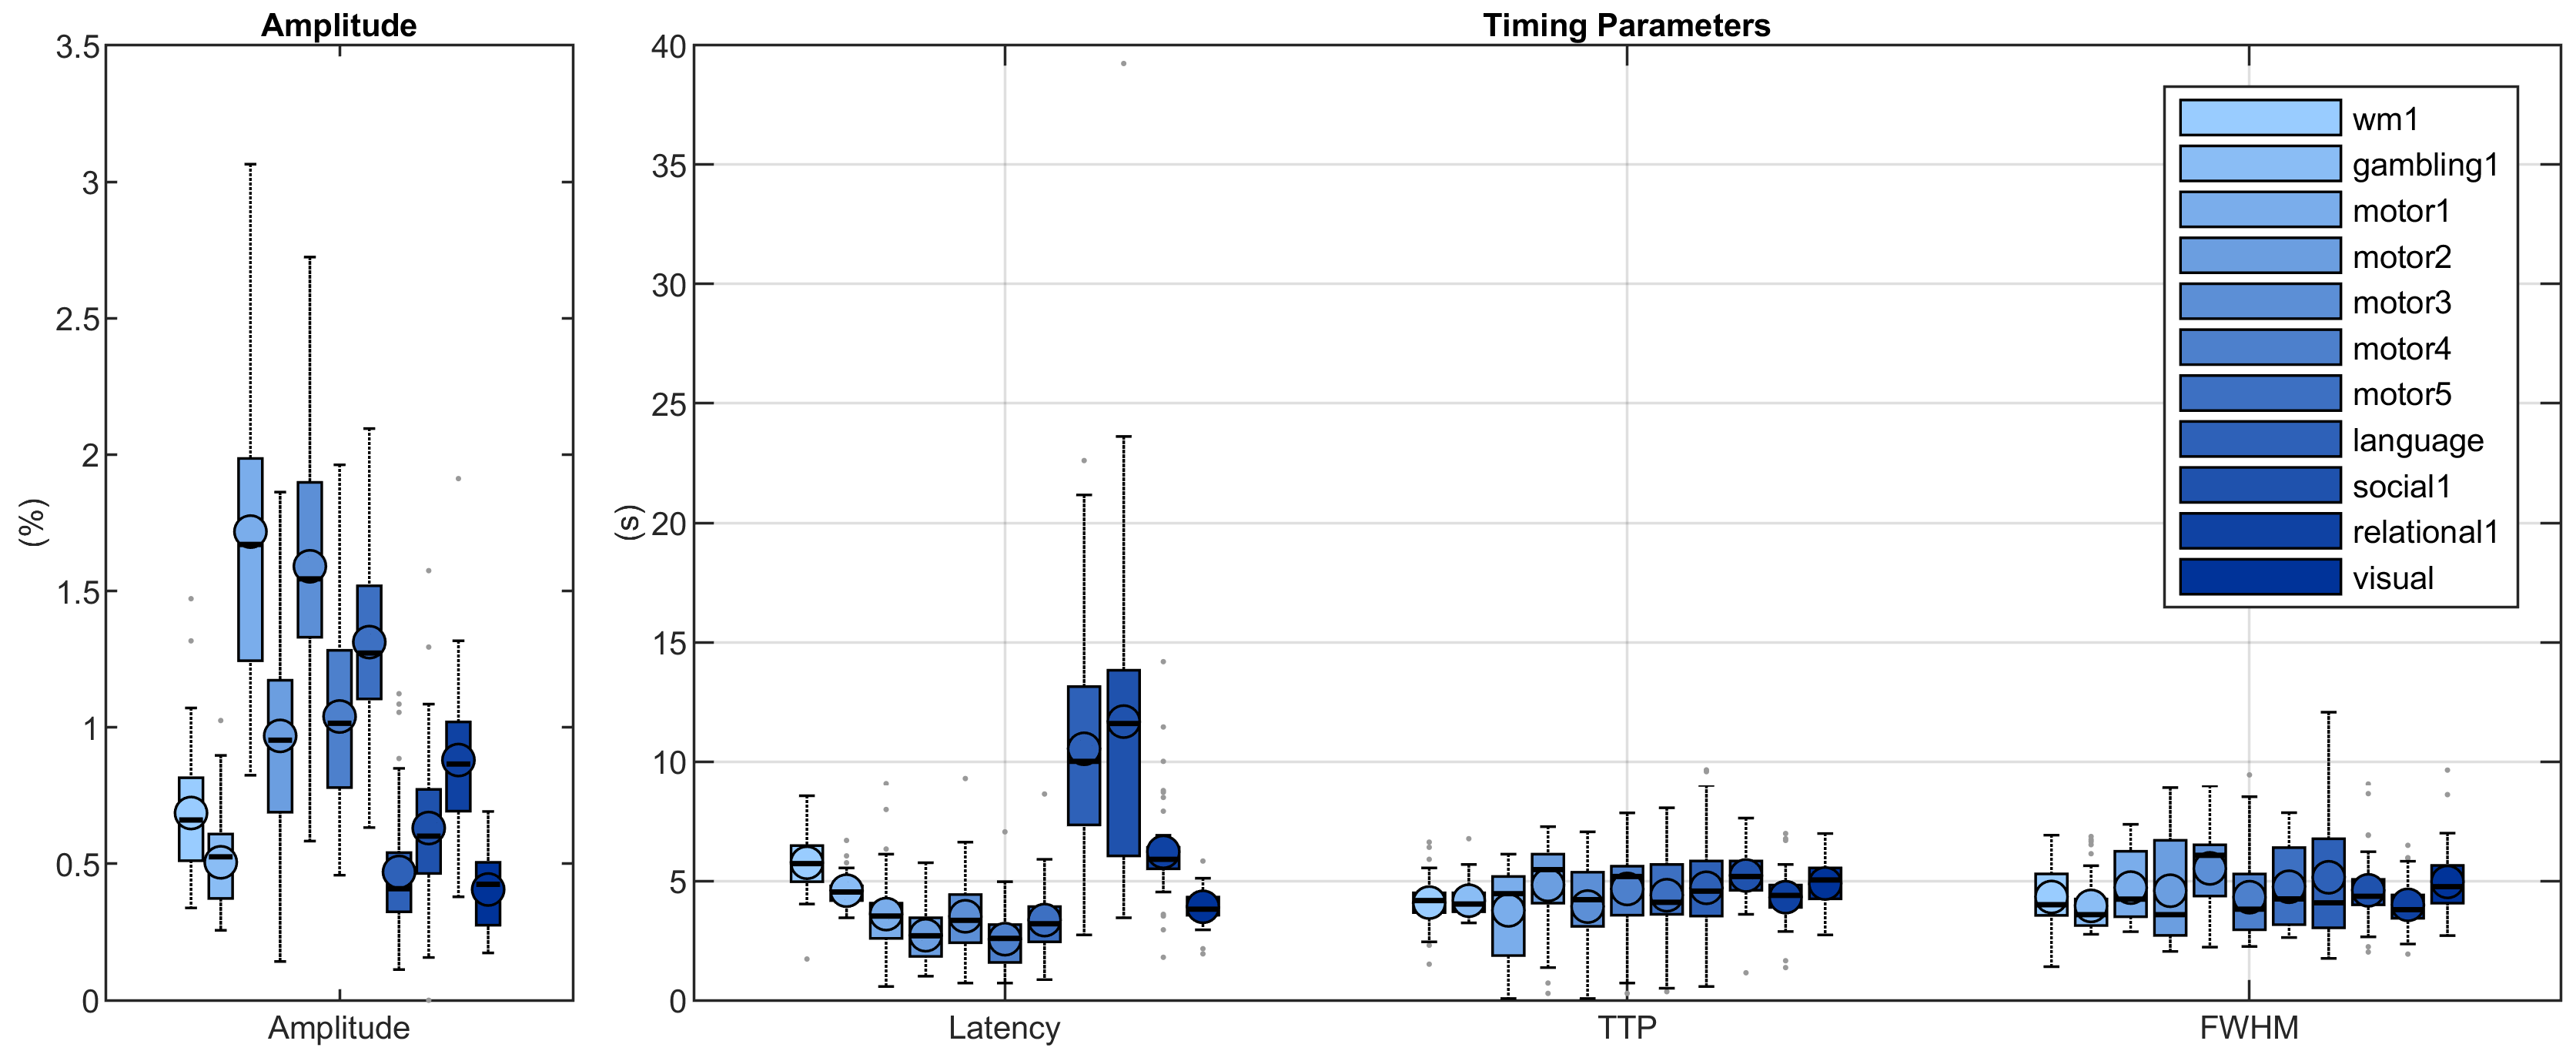
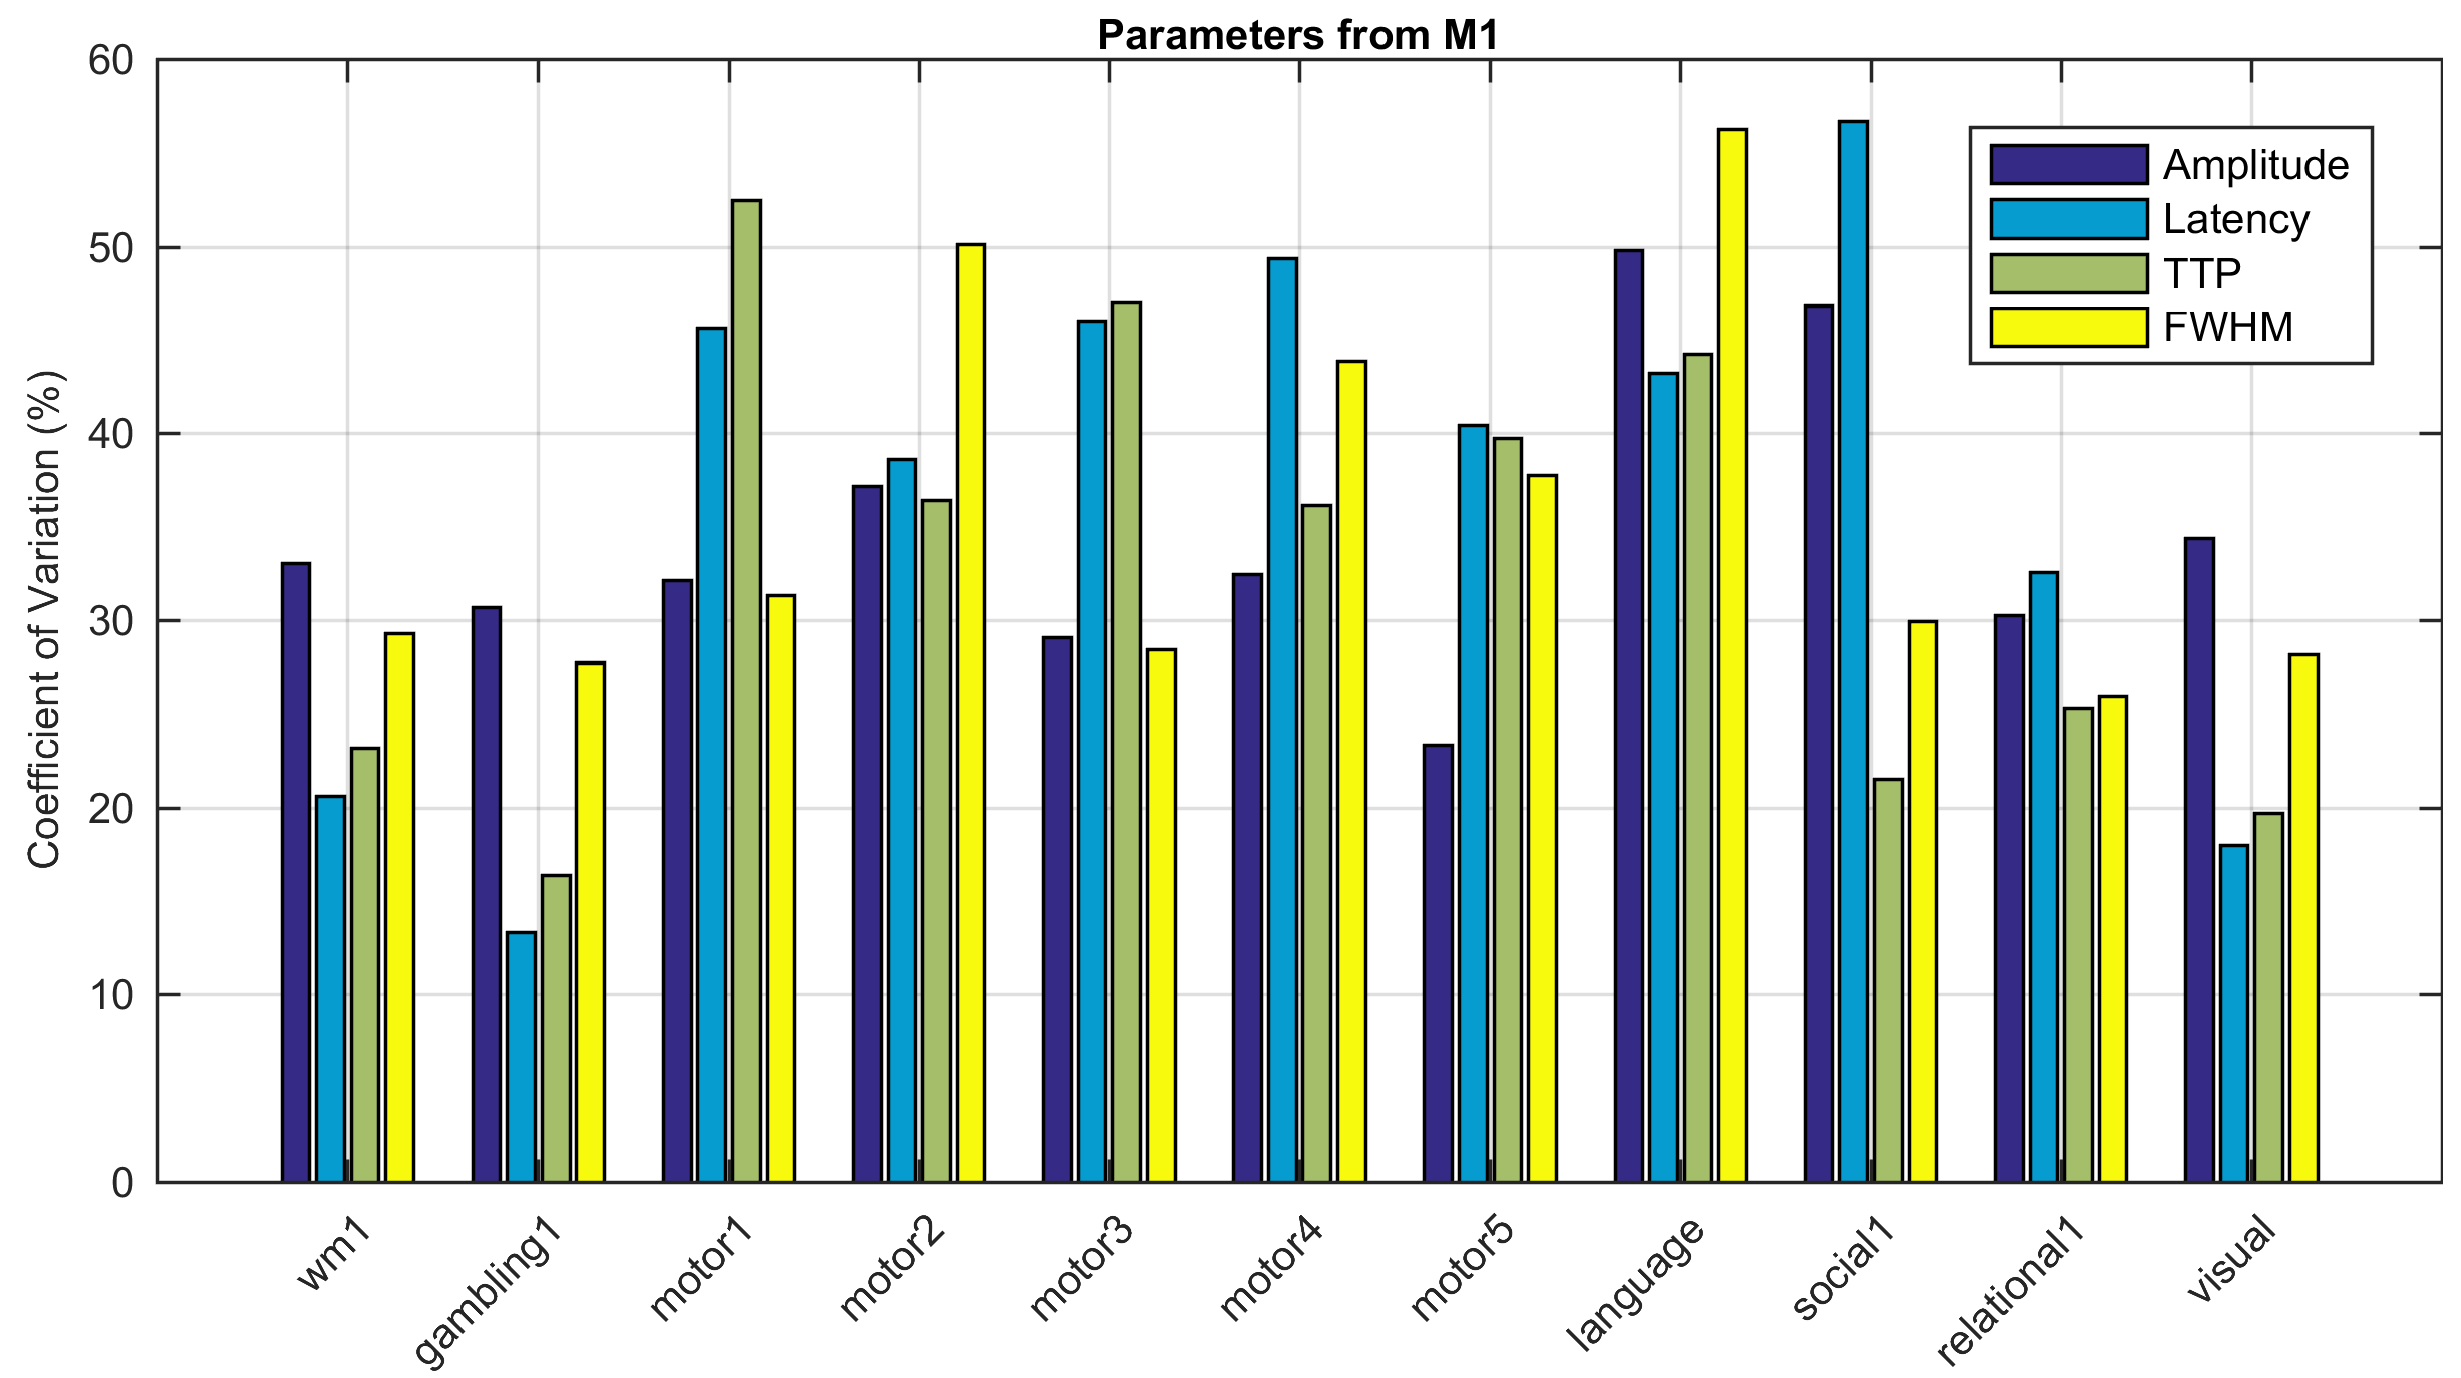
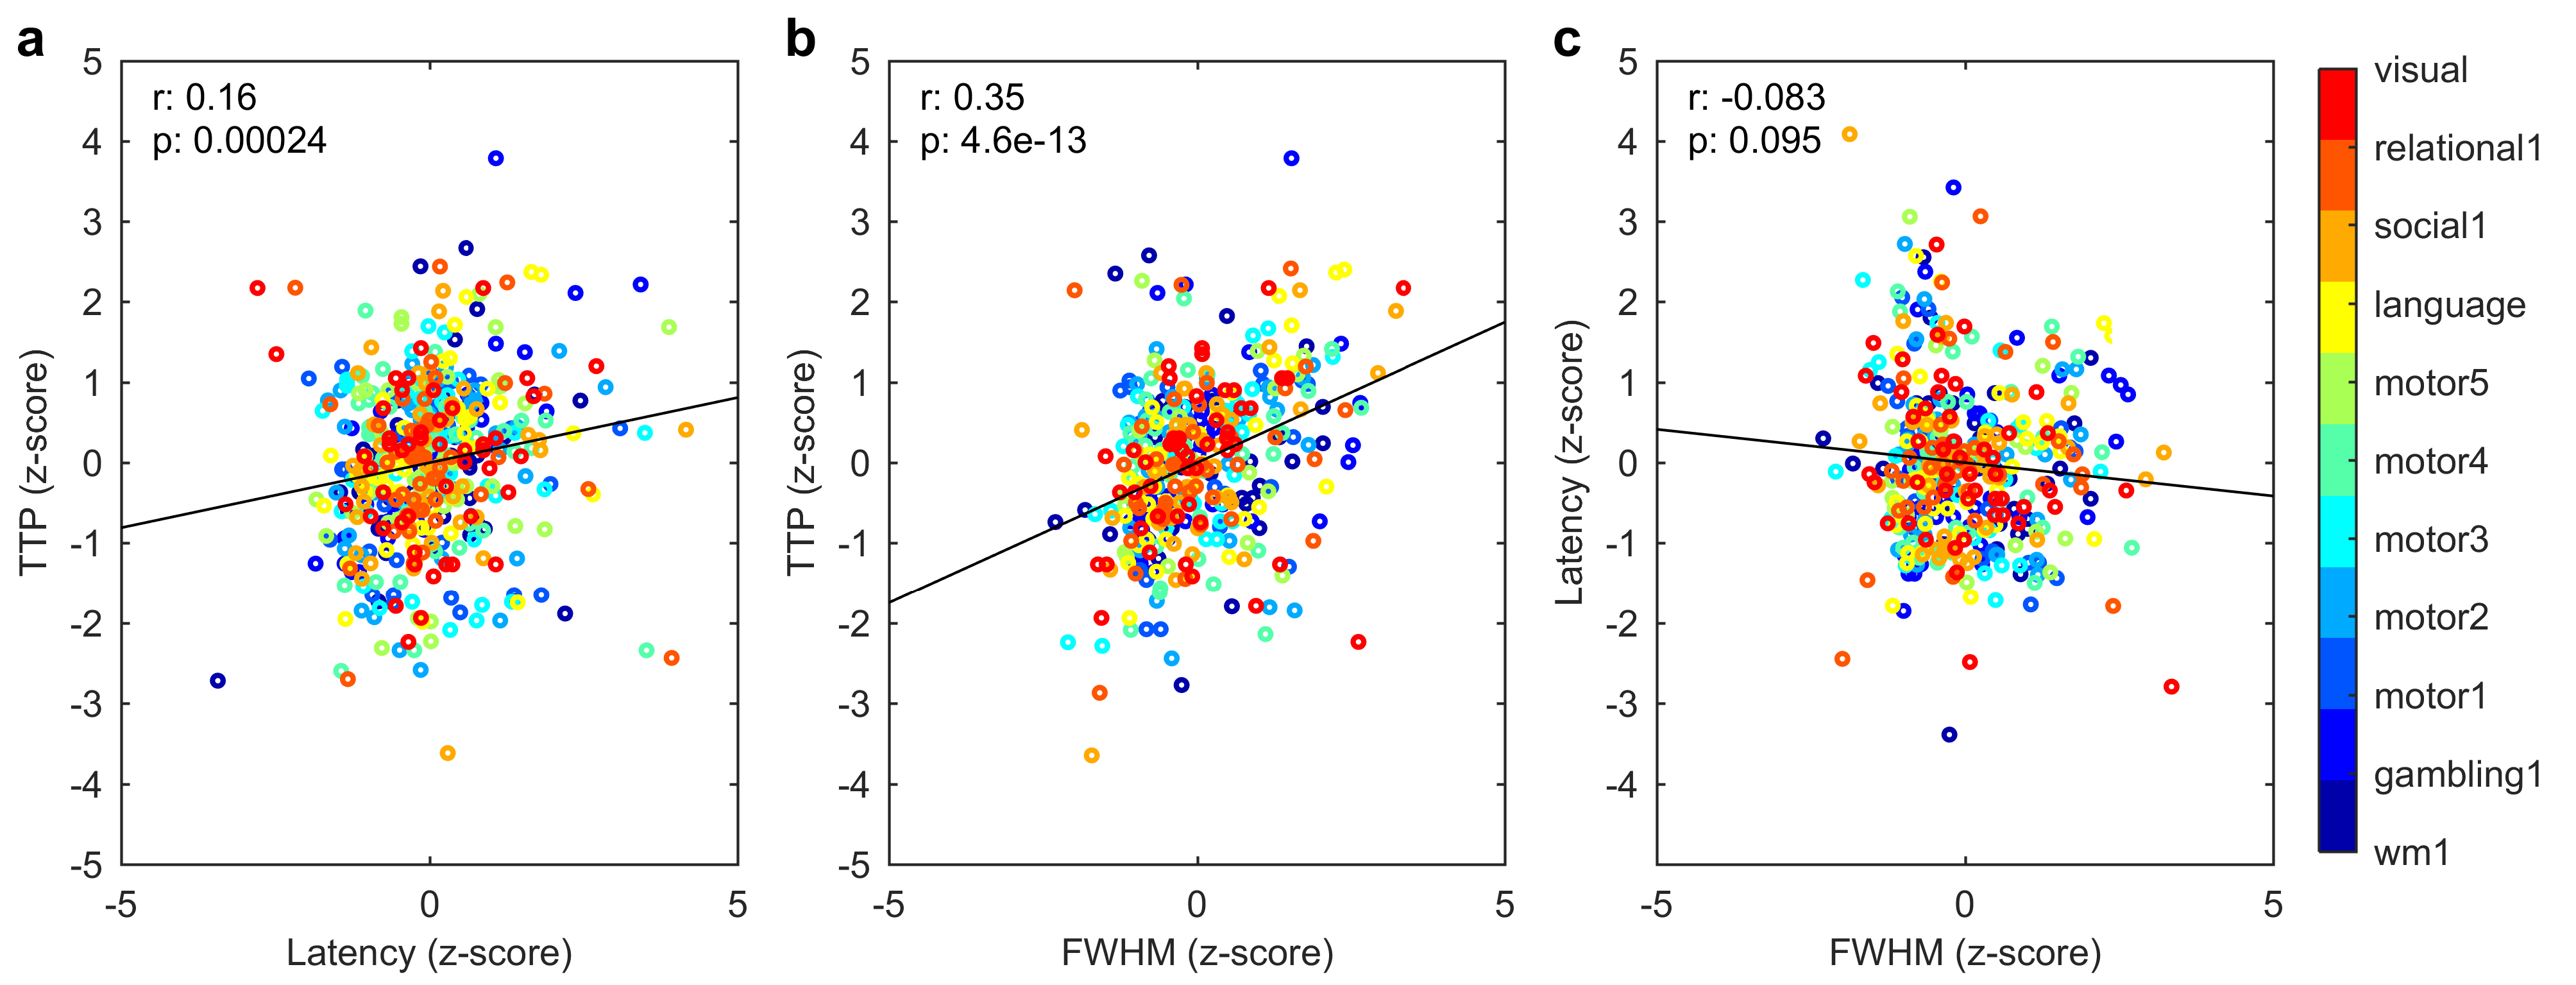
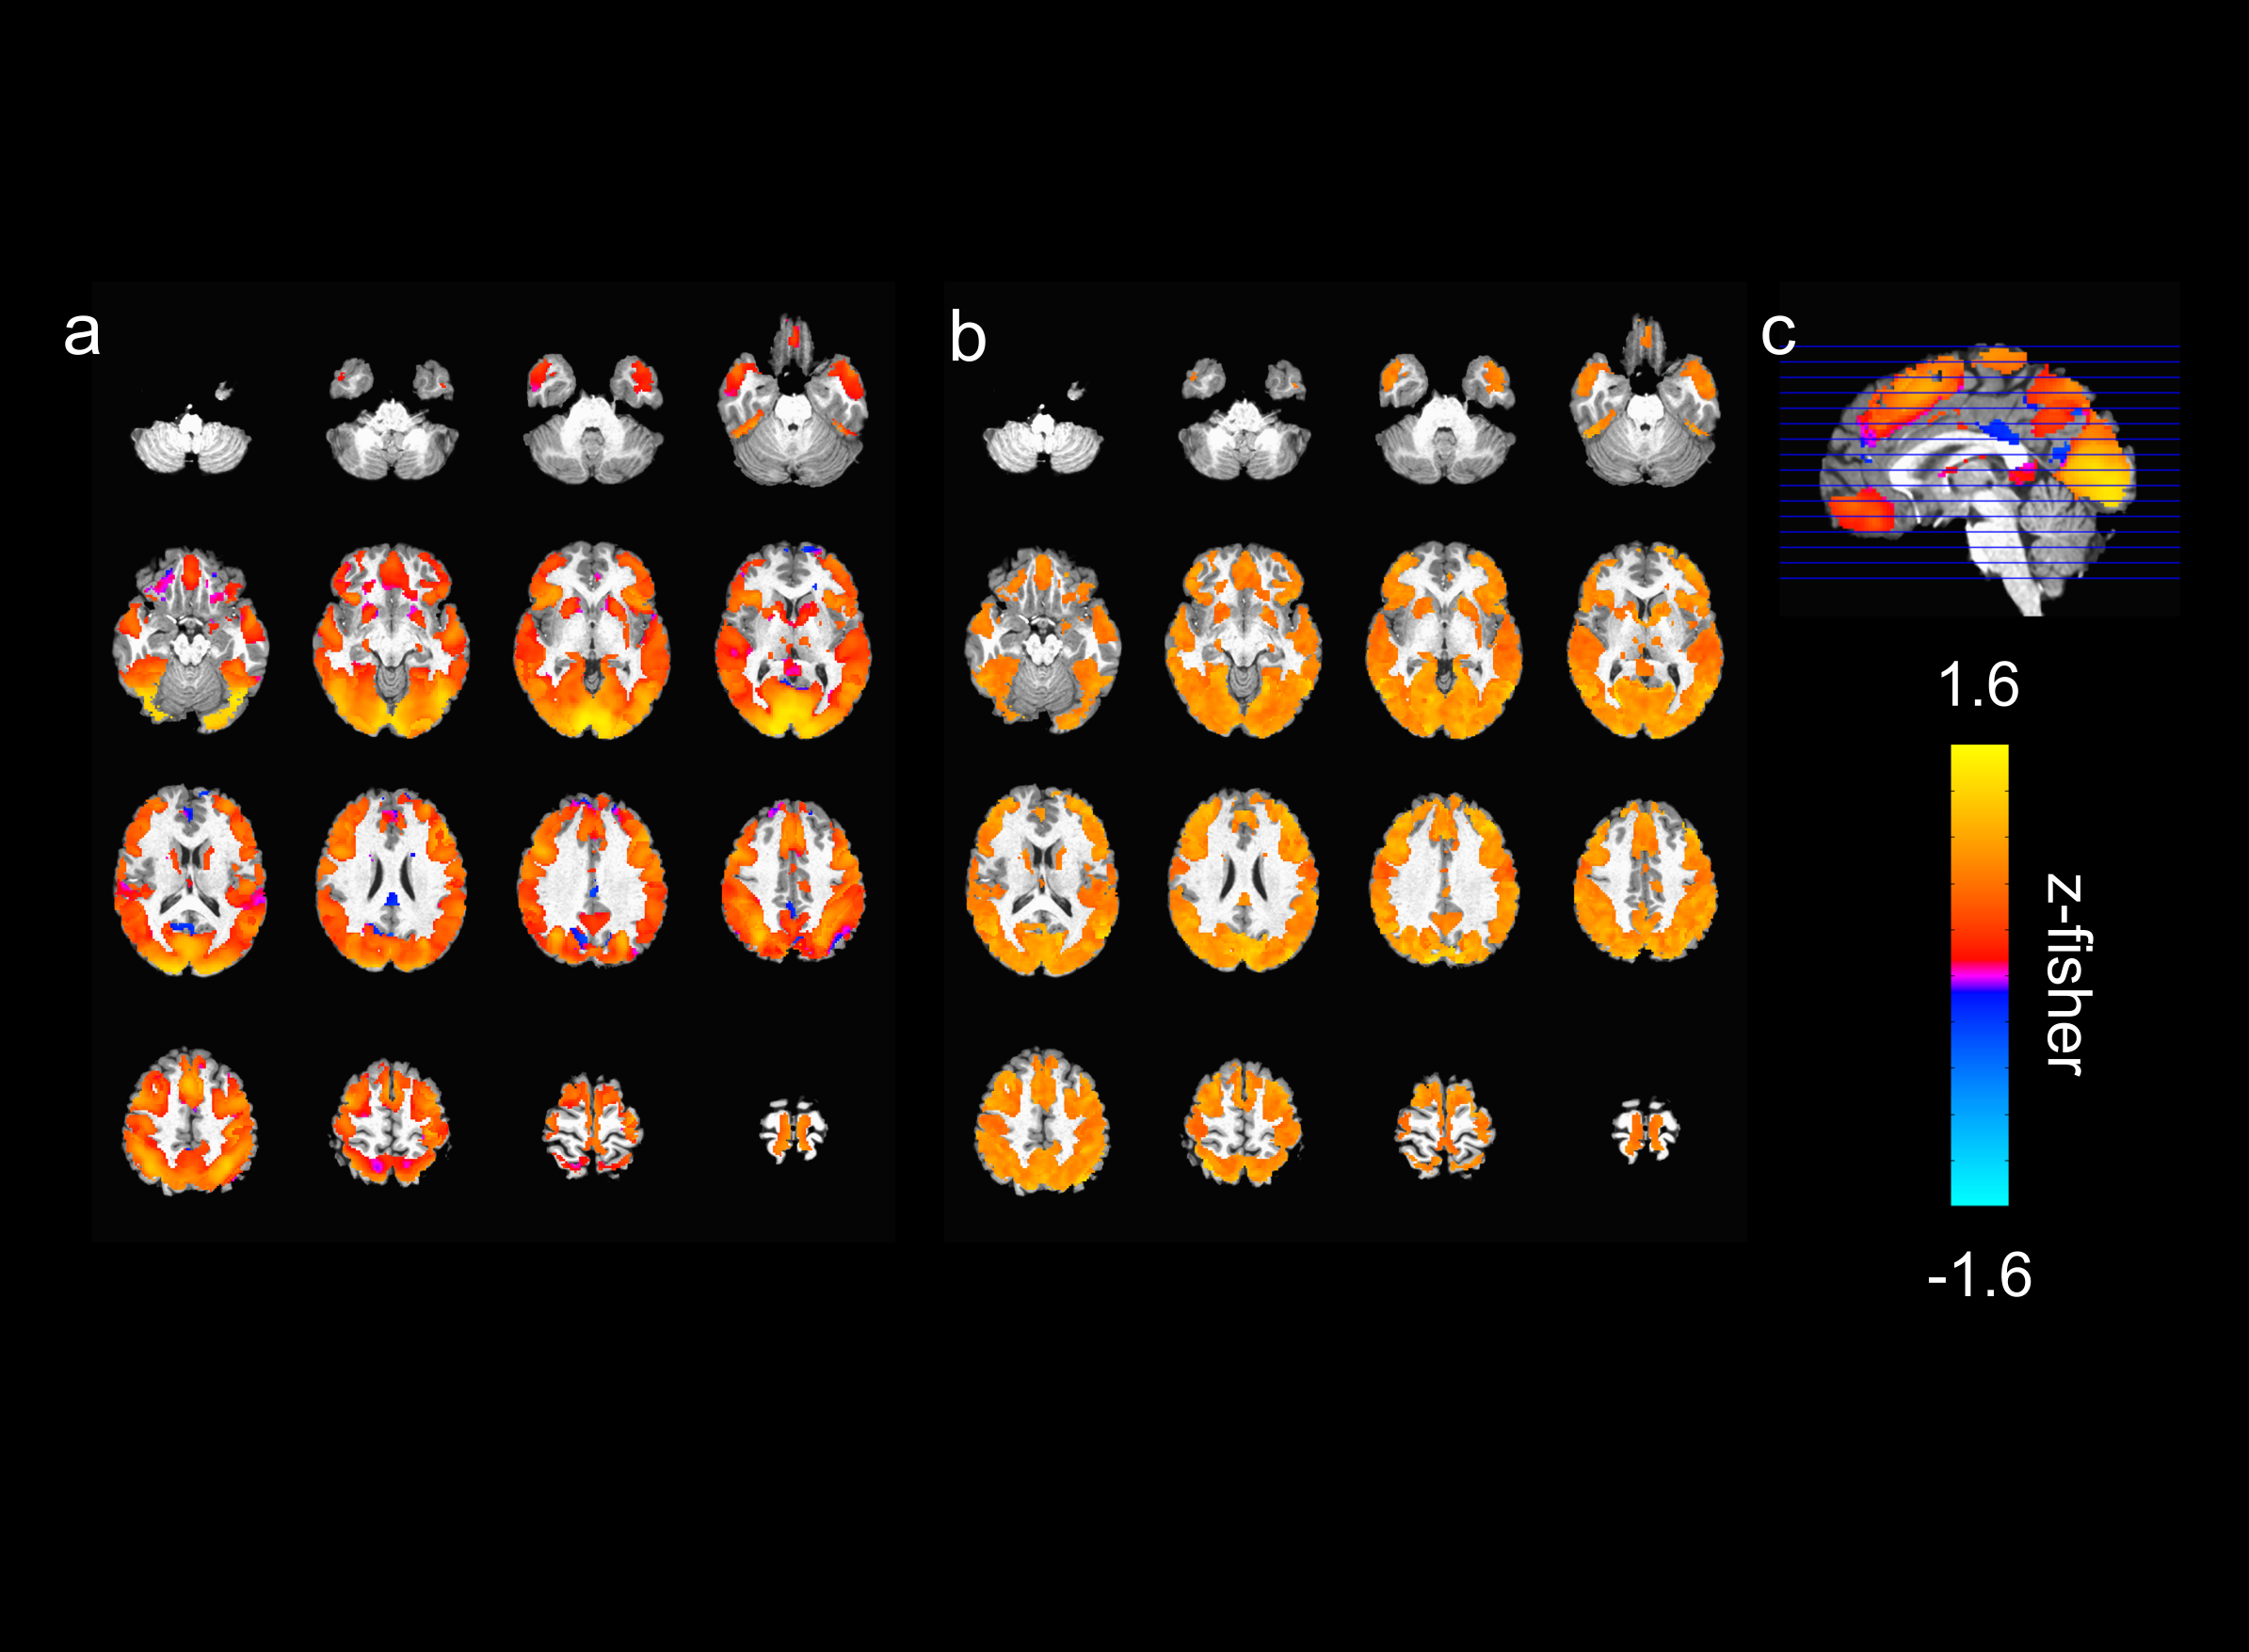
The activated areas covered approximately 68% of the cortex. The average time courses of the fitted responses and dHRFs for M1 are reported in Fig. 1. Quantitative parameters are shown in Fig. 2. The mean amplitude (Fig. 2a) and its SD across tasks was (0.93 ± 0.45)%. Timing parameters (Fig. 2b) showed distinct behaviours. Latency had a mean and SD across tasks of (5.27 ± 3.09) s. The mean TTP and its SD across tasks was (4.46 ± 0.45) s, and the mean FWHM and its SD across tasks was (4.59 ± 0.47) s. The coefficients of variation (CVs) across subjects for each parameter and task are shown in Fig. 3. The correlations between timing parameters are reported in Fig. 4. TTP was slightly, but significantly correlated to latency (R = 0.16, p < 0.0005) (Fig. 4a) and showed a significant and stronger correlation with FWHM (R = 0.35, p << 0.0001) (Fig. 4b), while latency and FWHM showed only a tendency of negative correlation (R = –0.08, p > 0.05) (Fig. 4c). The voxelwise similarity of the dHRF to the SPM12 canonical HRF is represented in Figure 5. Regions showing the maximal canonicity are localized in the occipital cortex. Spatial maps of amplitude and timing parameters (data not shown) exhibit different patterns of spatial variability.Discussion
In this study we explored the shape of a deconvolved HRF across tasks and brain regions in a relatively large cohort of subjects and across the majority of the cortex. We investigated the variability of the dHRF shape and its amplitude, latency, TTP and FWHM both across tasks and across subjects. Amplitude and latency showed the highest variability across tasks while, for all parameters, we observed that the variance across subjects was small compared to the variance across voxels. This suggests that a region-specific HRF would be preferable to a single subject-specific HRF. The spatial correlation between the proposed dHRF and the canonical HRF evidenced significant deviations from canonicity in large portions of the cortex, calling into question the suitability of the canonical HRF for connectivity and inference studies.Acknowledgements
No acknowledgement found.References
1. Lindquist, M.A., et al., Modeling the hemodynamic response function in fMRI: efficiency, bias and mis-modeling. Neuroimage, 2009. 45(1 Suppl): p. S187-98.
2. Logothetis, N.K., What we can do and what we cannot do with fMRI. Nature, 2008. 453(7197): p. 869-878.
3. Handwerker, D.A., J.M. Ollinger, and M. D'Esposito, Variation of BOLD hemodynamic responses across subjects and brain regions and their effects on statistical analyses. Neuroimage, 2004. 21(4): p. 1639-1651.
4. Handwerker, D.A., et al., The continuing challenge of understanding and modeling hemodynamic variation in fMRI. Neuroimage, 2012. 62(2): p. 1017-23.
5. Taylor, A.J., J.H. Kim, and D. Ress, Characterization of the hemodynamic response function across the majority of human cerebral cortex. Neuroimage, 2018. 173: p. 322-331.
6. Van Essen, D.C., et al., The WU-Minn Human Connectome Project: an overview. Neuroimage, 2013. 80(80): p. 62-79.
7. Glasser, M.F., et al., The minimal preprocessing pipelines for the Human Connectome Project. Neuroimage, 2013. 80: p. 105-24.
8. Tikhonov, A.N. and V.Y. Arsenin, Solution of Ill-Posed Problems. 1977, Washington, D.C: Wiston/Wiley.
9. Friston, K.J., Statistical parametric mapping, in Neuroscience databases. 2003, Springer. p. 237-250.
Figures