1173
DSC-derived perfusion map generation from DCE MRI using deep learning
Haoyang Pei1,2, Yixuan Lyu2,3, Sebastian Lambrecht4,5,6, Doris Lin5, Li Feng1, Fang Liu7, Paul Nyquist8, Peter van Zijl5,9, Linda Knutsson5,9,10, and Xiang Xu1,5
1Biomedical Engineering and Imaging Institute and Department of Radiology, Icahn School of Medicine at Mount Sinai, New York City, NY, United States, 2Department of Electrical and Computer Engineering, NYU Tandon School of Engineering, New York City, NY, United States, 3Image Processing Center, School of Astronautics, Beihang University, Beijing, China, 4Department of Neurology, Technical University of Munich, Munich, Germany, 5Department of Radiology, Johns Hopkins University, Baltimore, MD, United States, 6Institute of Neuroradiology, Ludwig-Maximilians-Universität, Munich, Germany, 7Athinoula A. Martinos Center for Biomedical Imaging, Massachusetts General Hospital and Harvard Medical School, Boston, MA, United States, 8Department of Neurology, Johns Hopkins University, Baltimore, MD, United States, 9F.M Kirby Research Center for Functional Brain Imaging, Kennedy Krieger Institute, Baltimore, MD, United States, 10Department of Medical Radiation Physics, Lund University, Lund, Sweden
1Biomedical Engineering and Imaging Institute and Department of Radiology, Icahn School of Medicine at Mount Sinai, New York City, NY, United States, 2Department of Electrical and Computer Engineering, NYU Tandon School of Engineering, New York City, NY, United States, 3Image Processing Center, School of Astronautics, Beihang University, Beijing, China, 4Department of Neurology, Technical University of Munich, Munich, Germany, 5Department of Radiology, Johns Hopkins University, Baltimore, MD, United States, 6Institute of Neuroradiology, Ludwig-Maximilians-Universität, Munich, Germany, 7Athinoula A. Martinos Center for Biomedical Imaging, Massachusetts General Hospital and Harvard Medical School, Boston, MA, United States, 8Department of Neurology, Johns Hopkins University, Baltimore, MD, United States, 9F.M Kirby Research Center for Functional Brain Imaging, Kennedy Krieger Institute, Baltimore, MD, United States, 10Department of Medical Radiation Physics, Lund University, Lund, Sweden
Synopsis
Keywords: Machine Learning/Artificial Intelligence, Perfusion
This study built a deep-learning-based method to directly extract DSC MRI perfusion and perfusion related parameters from DCE MRI. A conditional generative adversarial network was modified to solve the pixel-to-pixel perfusion map generation problem. We demonstrate that in both healthy and brain tumor patients, highly realistic perfusion and perfusion related parameter maps can be synthesized from the DCE MRI using this deep-learning method. In healthy controls, the synthesized parameters had distribution similar to the ground truth DSC MRI values. In tumor regions, the synthesized parameters correlated linearly with the ground truth values.Introduction
Dynamic susceptibility contrast (DSC) MRI and dynamic contrast-enhanced (DCE) MRI are two widely used contrast agent based perfusion MRI techniques. They provide different but complementary information to assist in clinical diagnosis. Relative cerebral blood volume (rCBV), relative cerebral blood flow (rCBF) and mean transit time (MTT) are useful parameters derived from DSC MRI, while volume transfer constant (Ktrans), plasma volume (Vp), and extravascular extracellular volume (Ve) can be obtained from DCE MRI1. However, measuring and calculating these parameters from DCE and DSC MRI are time-consuming and often expose patients to two doses of gadolinium contrast agent injections. Therefore, we explored the feasibility of directly extracting DSC-derived perfusion and perfusion related maps from DCE MRI images using a deep-learning-based method.Methods
Analysis was conducted on 64 participants scanned previously using a 3T Philips Achieva and two Elition scanners, each equipped with 32-channel head coil. Of the 64 participants, 23 were patients with brain tumors, 19 were individuals with high risks of cerebrovascular small vessel disease, and 22 were healthy participants. The dataset was randomly split into a training set, a validation set and a test set including 50, 4 and 10 samples separately (containing the 17, 2 and 4 cases with tumors), which contains 682, 52 and 78 imaging slices and 150 dynamic images in each set. Each participant had back-to-back DCE and DSC scans (see Fig. 1) using previously published protocols2. DSC images were processed using nordicICE (NordicNeuroLab, Norway) with semi-automatically selected arterial input function retrieved from the cerebral cortex. The output rCBV, rCBF and MTT maps were assumed to be “Ground truth” maps. Input DCE MRI images were normalized and downsampled to a standard resolution 128×128 to handle the different image size in the original data. Slices were aligned between the DCE MRI images and the corresponding DSC-MRI-derived maps.We modified conditional generative adversarial networks (cGAN)3 to investigate the possibility of deriving the DSC-derived maps from DCE MRI images. As shown in Figure 2A, rCBF and MTT generators use the DCE data as input and training was performed to generate synthetic rCBF and MTT images separately. rCBV maps were calculated by multiplying rCBF and MTT maps according to the central volume theorem. Generated maps are then concatenated with the input DCE images and transferred into their discriminator respectively, and the two discriminators were optimized separately to discriminate if the rCBF and MTT are synthetic or real. A four-layer U-net4 was implemented as the generator and several stacked convolution layers in an encoder form to realize the discrimination as shown in Figures 2B and 2C. LeakyReLU5 was used during the inner-layer convolution process and a Tanh6 activation function was utilized to generate the DSC maps. All experiments were conducted using a single RTX8000 GPU and the model was trained with learning rate = 2e-3, batch size=16, epochs=200, validation criterion = minimum mean absolute error (MAE), Adam7 optimizer with beta = [0.5,0.999].
Results
As shown in Figure 3A and B, synthetic maps have very similar patterns compared to the real ones as we expected. The model was able to generate indistinguishable value distributions of parameters as shown in the Figure 3C, D and E. Real and synthetic rCBV, rCBF and MTT maps for patients with brain tumors are shown in Figure 4. Prolonged MTT in the tumor regions can be clearly observed in the synthetic MTT maps, similar to the real MTT maps. In the tumors, a linear correlation was found between the synthetic values and the “true” values (Figure 5A, B and C), with synthetic MTT values always being smaller, which was then also transferred to rCBV through the central volume theorem. Bland-Altman plots in the Figure 5, E and F present reasonable consistency between the synthetic and the “true” values in the tumor regions.Discussion
Our results demonstrate that the cGANs are able to generate realistic rCBV, rCBF and MTT maps using few samples in terms of both qualitative and quantitative results. The value distribution of synthetic maps is highly correlated with that of the DSC-derived maps. Notably, for temporal regions that are affected by susceptibility artifacts in DSC imaging, the synthetic maps correctly delineated the tumor, while this contrast was lost in the DSC-derived maps due to susceptibility artifacts. (Figure 4C). High correlations between the median value of the tumor region in the synthetic maps and the real maps were obtained, although the predicted values of rCBV and MTT in the tumor region were slightly lower than the “real” values. This discrepancy is due to the limited sample size of images that contain tumors, and the quantitative results will likely improve with the accrual of more tumor cases for training.Conclusion
DCE and DSC MRIs are both important techniques in clinical evaluations, providing complementary perfusion and perfusion-related parameters. However, performing both scans is time-consuming and often requires a second dose of gadolinium contrast agent. Leveraging on cGANs, we exploited the possibility to synthesize the DSC-derived maps from DCE MRI images. We demonstrate that highly realistic rCBV, rCBF, and MTT maps can be synthesized from the DCE MRI both qualitatively and quantitatively. This approach should especially be relevant for regions with susceptibility distortions.Acknowledgements
This work was supported by the NIH grants R00EB026312, R21EB031185, R01AR079442 and R01AR081344.References
- Calamante, Fernando. "Perfusion MRI using dynamic-susceptibility contrast MRI: quantification issues in patient studies." Topics in magnetic resonance imaging 21.2 (2010): 75-85.
- Dewey, B. E., et al. "MTT and blood-brain barrier disruption within asymptomatic vascular WM lesions." American Journal of Neuroradiology 42.8 (2021): 1396-1402.
- Isola, Phillip, et al. "Image-to-image translation with conditional adversarial networks." Proceedings of the IEEE conference on computer vision and pattern recognition. 2017.
- Ronneberger, Olaf, Philipp Fischer, and Thomas Brox. "U-net: Convolutional networks for biomedical image segmentation." International Conference on Medical image computing and computer-assisted intervention. Springer, Cham, 2015.
- Lakshmi, MV Sowmya, et al. "A LeakyReLU based Effective Brain MRI Segmentation using U-NET." 2021 5th International Conference on Trends in Electronics and Informatics (ICOEI). IEEE, 2021.
- Fan, Engui. "Extended tanh-function method and its applications to nonlinear equations." Physics Letters A 277.4-5 (2000): 212-218.
- Zhang, Zijun. "Improved adam optimizer for deep neural networks." 2018 IEEE/ACM 26th International Symposium on Quality of Service (IWQoS). IEEE, 2018.
Figures
Figure 1: Experimental design. Six minutes after completing the DCE scans,
DSC imaging was performed using single shot EPI.
Figure 2: (A) The pipeline of the conditional GANs. Two conditional
GANs were trained to generate rCBF and MTT maps separately. rCBV maps are
computed from pixel-wise multiplication of rCBF and MTT maps. A smooth L1
penalty between the real and generated maps was combined with the GAN loss to
update the generator. (B) 150 dynamics from the DCE MRI were used as input to
the U-Net generator, and the synthetic maps (rCBF, MTT) were the outputs. (C)
The rCBF and MTT maps were concatenated with input DCE MRI before feeding into
the discriminator network.
Figure 3: (A)(B) Synthetic and real rCBV, rCBF and MTT maps for two
healthy controls. (C)(D)(E) The value distribution of the rCBV, rCBF and MTT
maps for 10 patients (138 slices in the test set). The horizontal axis shows
the values of the rCBV, rCBF and MTT. The vertical axis represents the voxel
numbers with certain values in the rCBV, rCBF and MTT maps.
Figure 4: Synthetic and “real” rCBV, rCBF and MTT maps for two
slices of tumor case 1 (A and B) and tumor case 2 (C and D).
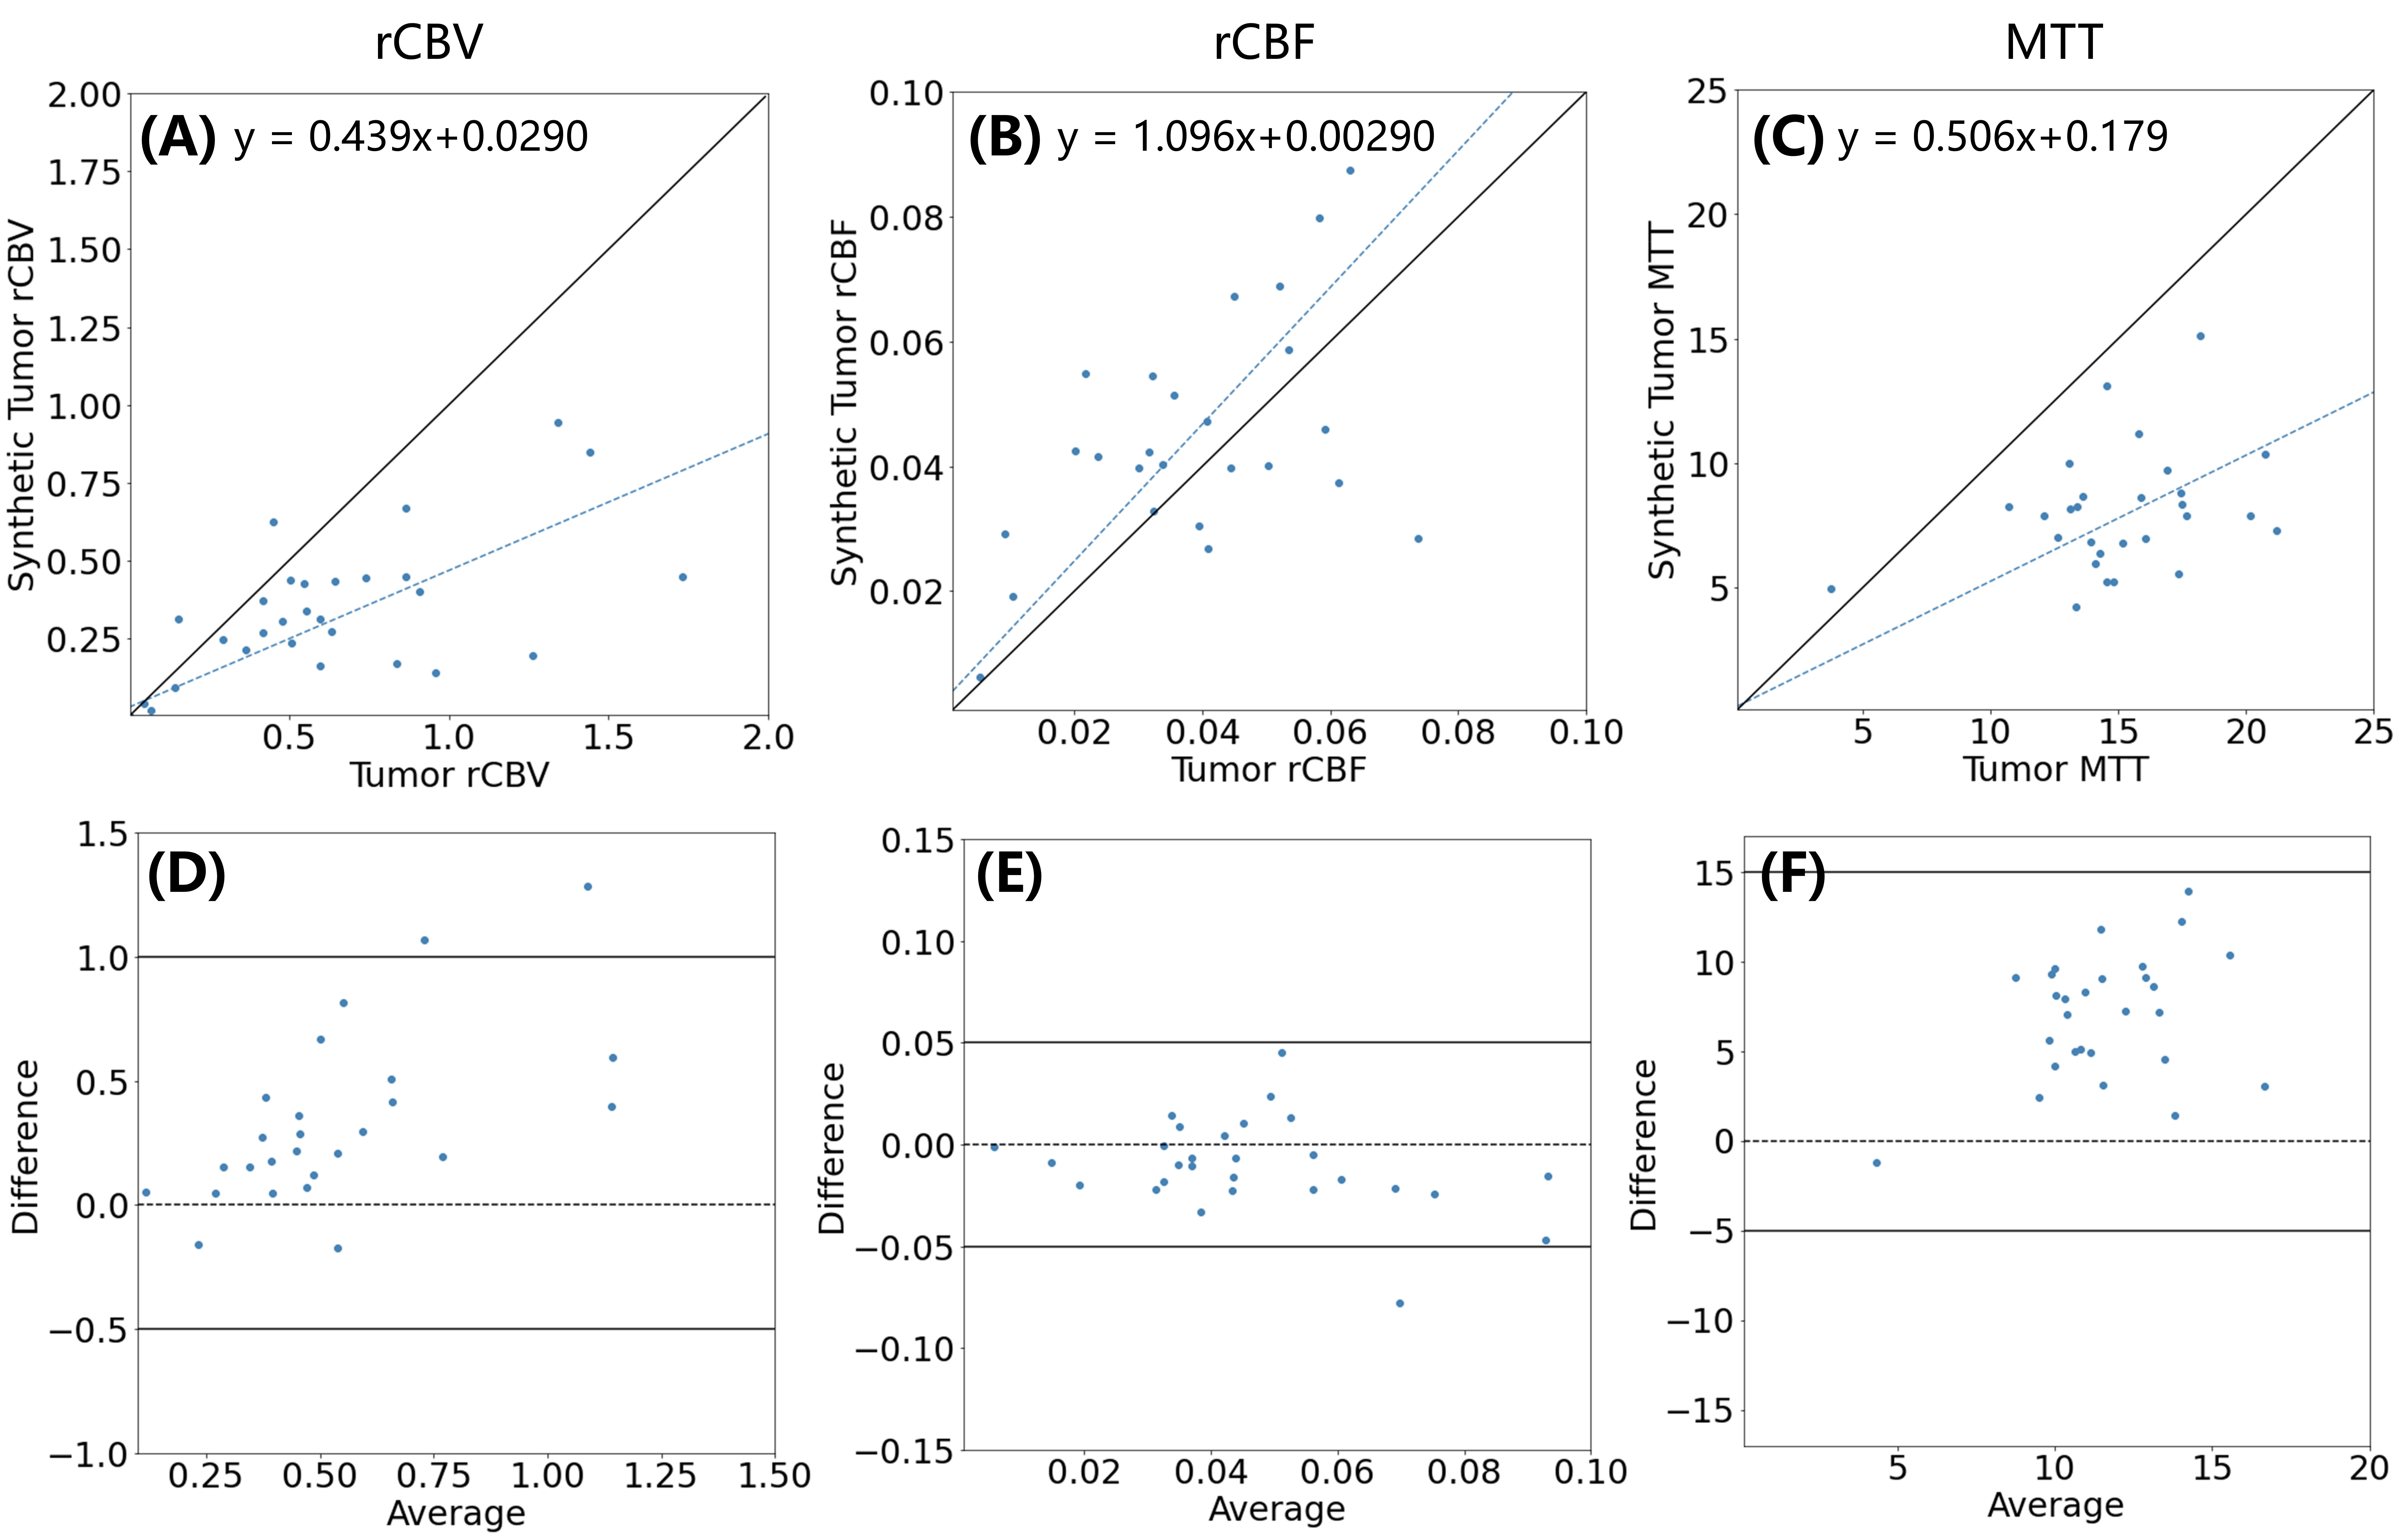
Figure 5: The median values of the tumor regions calculated in the
synthetic maps versus “real” maps derived from the DSC images (A, rCBV, B, rCBF,
and MTT). Corresponding Bland-Altman plots for median values of tumor regions
in three maps(D, rCBV, E, rCBF, and F, MTT).
DOI: https://doi.org/10.58530/2023/1173