1172
Temporal-Structural Graph Convolutional Network for Knee Osteoarthritis Progression Prediction Using MRI from the Osteoarthritis Initiative1Department of Medical Imaging, The Third Affiliated Hospital of Southern Medical University, GuangZhou, China, 2School of Biomedical Engineering and Guangdong Provincial Key Laboratory of Medical Image Processing, Southern Medical University, GuangZhou, China, 3Guangdong Province Engineering Laboratory for Medical Imaging and Diagnostic Technology, Southern Medical University, Guangzhou, China, 4Philips Healthcare, GuangZhou, China, 5Pazhou Lab, Guangzhou, China
Synopsis
Keywords: Osteoarthritis, Machine Learning/Artificial Intelligence
Identifying patients with knee osteoarthritis (OA) whom the disease will progress is critical in clinical practice. Currently, the time-series information and interactions between the structures and sub-regions of the whole knee are underused for predicting. Therefore, we propose a temporal-structural graph convolutional network (TSGCN) using time-series data of 194 cases and 406 OA comparators. Each sub-region was regarded as a vertex and represented by the extracted radiomics features, the edges between vertexs were established by the clinical prior knowledge. The multiple-modality TSGCN (integrating information of MRIs, clinical and image-based semi-quantitative score) performed best comparing to the radiomics and CNN model.abstract
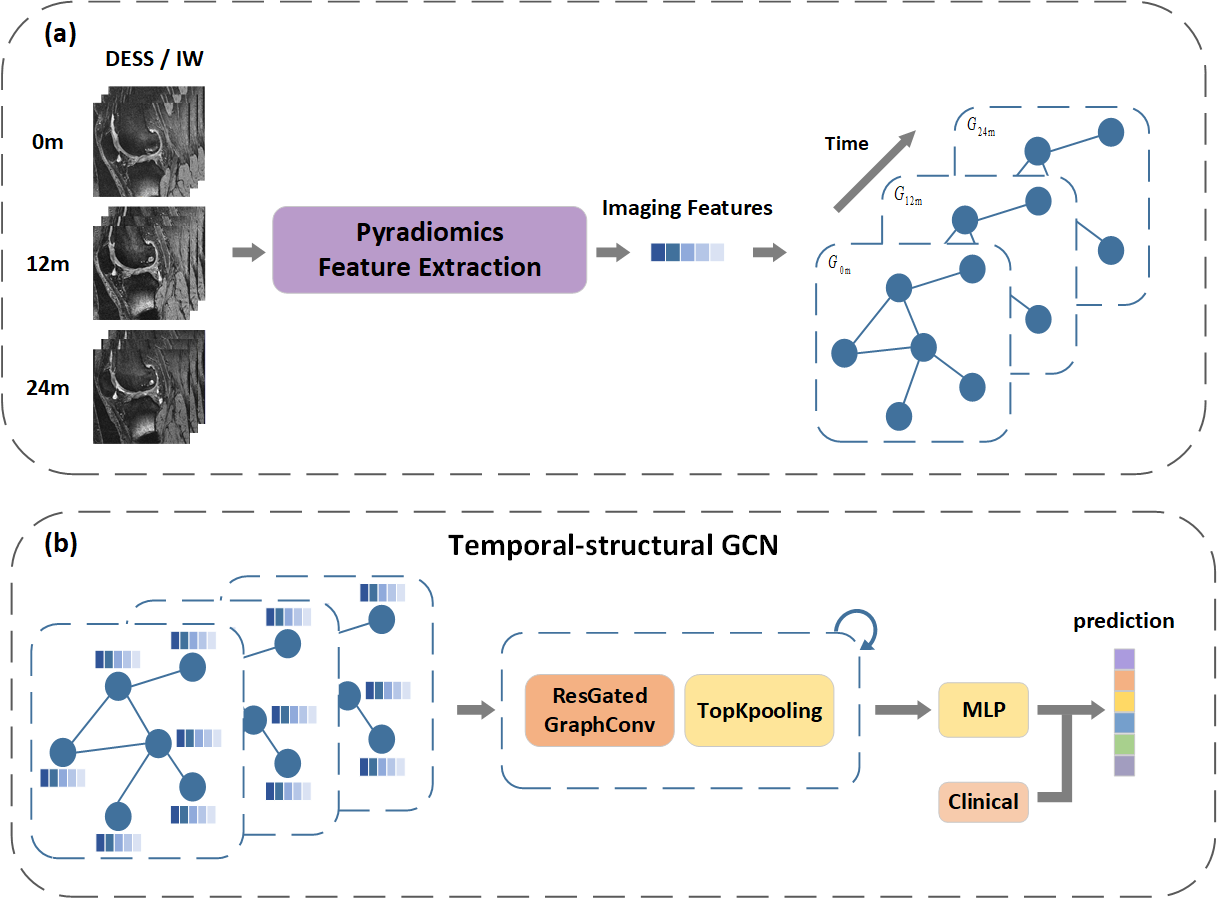
Purpose and Introduction Accurate discrimination of patients with knee OA who might progress is essential for medicine development as well as implementing physical therapy.[1] It is essential to predict knee OA progression from a spatio-temporal point of view. Magnetic resonance imaging (MRI) is suitable for analyzing whole-knee, compartmental morphological changes.[2, 3] However, it can be complex and heterogeneous for radiologists to evaluate these changes on MRI. Therefore, we propose a time structural-regions graph convolutional network (TSGCN) that could handle complex structures by generalizing the convolution operation from Euclidean space to non-Euclidean graph space to achieve accurate progression prediction of knee OA. We also built a multiple-modality TSGCN to explore the benefit of clinical variables and image-based semi-quantitative features to improve the predicting performance.Materials and Methods MRIs of 194 cases and 406 OA comparators were obtained from the FNIH cohort in the Osteoarthritis Initiative and retrospectively included in this study, with 194 knees progressing both in radiology and symptoms, and 406 knees lacking the combination of radiographic and pain progression. Additionally, publicly eligible records of MRI semi-quantitative imaging markers and clinical variables were collected, which were detailed elsewhere.[4] Segmentation was implemented by nnU-Net[5] to automatically segment the knee into 30 sub-regions according to the MOAKS based on two MRI sequences: sagittal intermediate-weighted turbo-spin echo sequences with fat-suppression (SAG-IW-TSE-FS) and sagittal 3D dual‑echo steady state water excitation (SAG-3D-DESS-WE). We used residual gated graph convolutional network [6], which leverages both the edge gating mechanism and residual networks (ResNets) to formulate a multi-layer gated graph ConvNet, to describe the relationship among different sub-regions and time-series of knee OA by aggregating the vertex information across the knee graph. For it has been proven to be efficient to adopt residual connection (jumping connection) in the GCN layers [7]. An overall workflow and the details about TSGCN were shown in figure 1 and 2 respectively. We also explored whether GNN scores combined with semi-quantitative imaging markers and clinical variables (called multi-modality TSGCN) would lead to better results through integration experiments. To further illustrate the spatiotemporal processing ability and the prediction capacity of our model, we also constructed the radiomics model and the CNN model for comparison. The deep learning model was trained using Dense169 [8]. The Radiomics model was established using the minimum redundancy maximum relevance (mRMR) algorithm and the least absolute shrinkage and selection operator (LASSO) algorithm. The area under the curve (AUC) was used as the model merit.
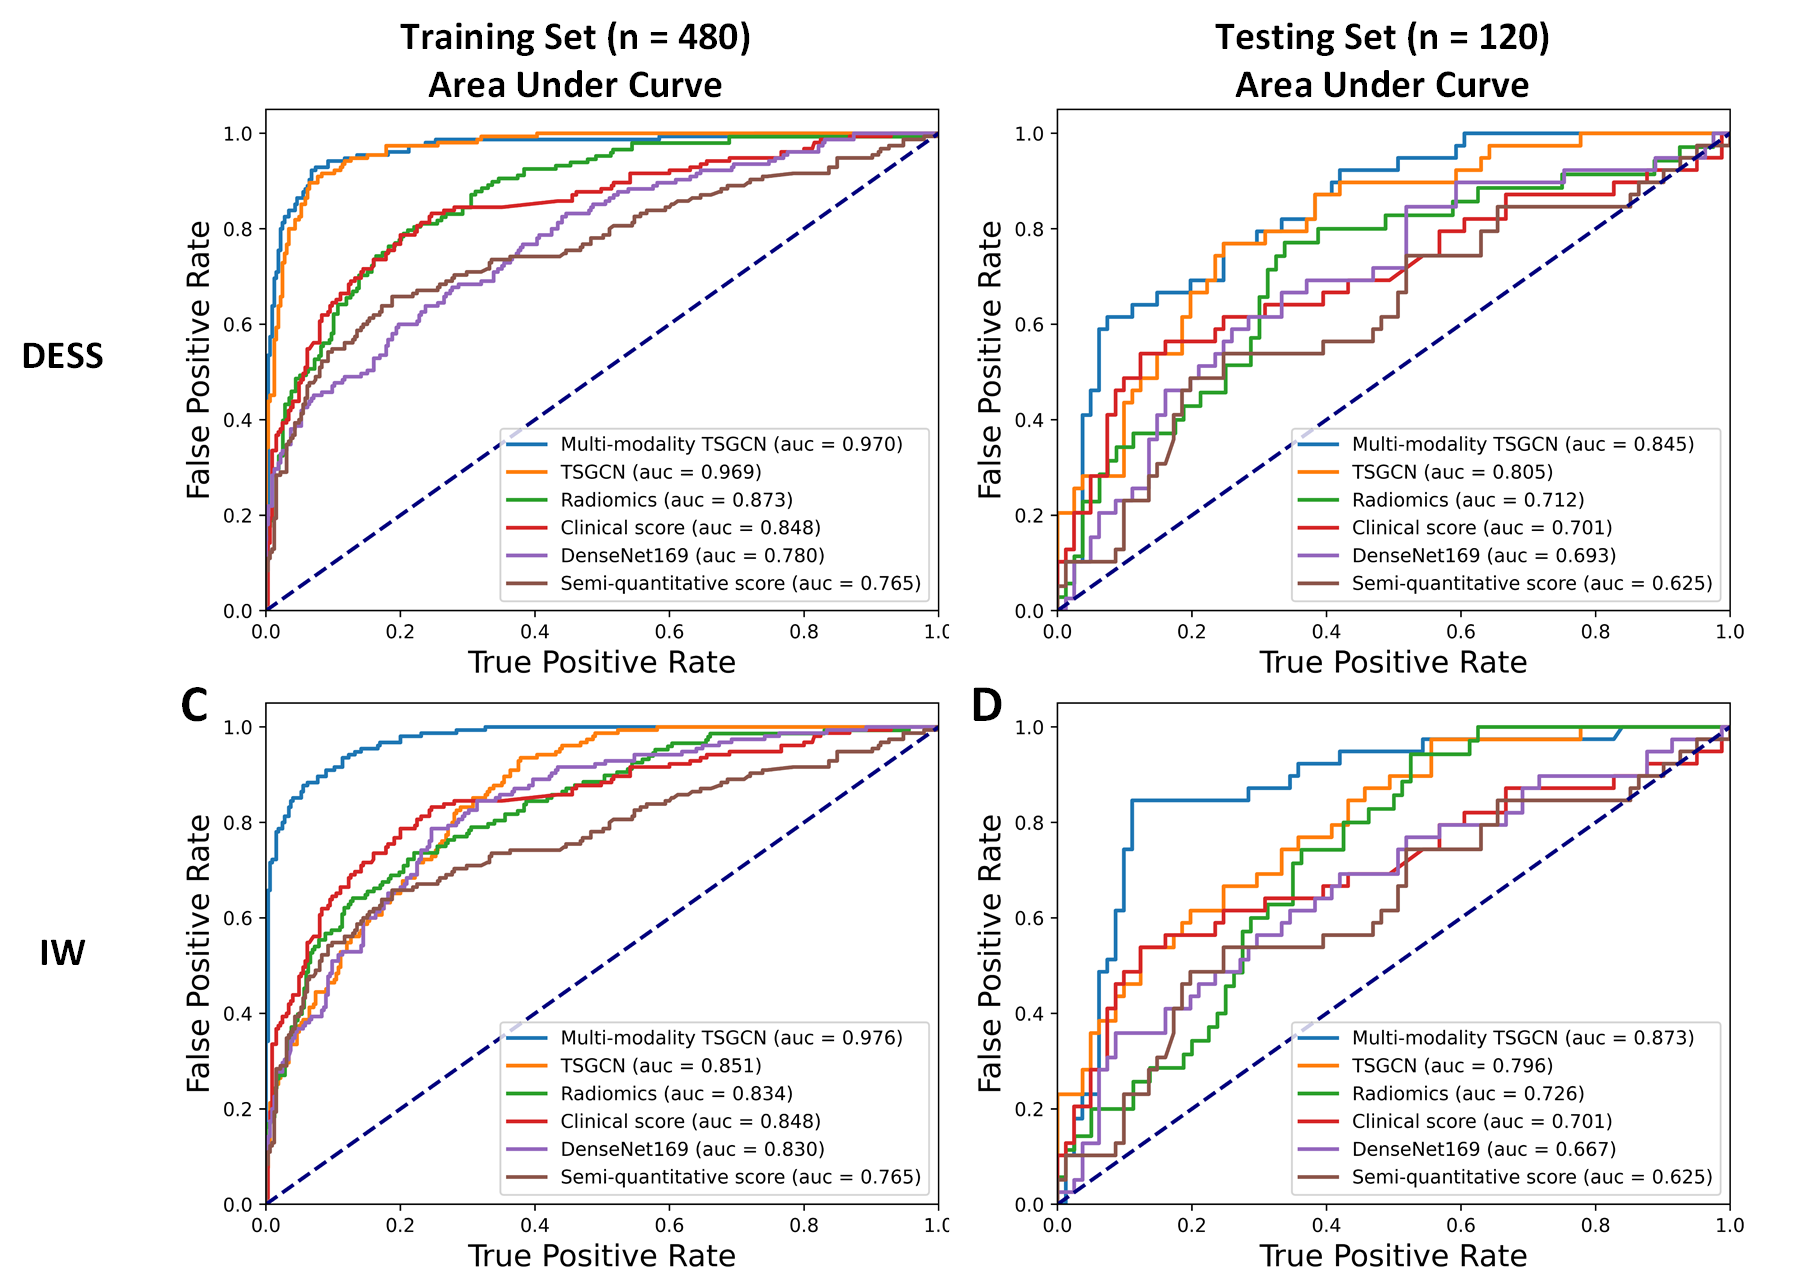
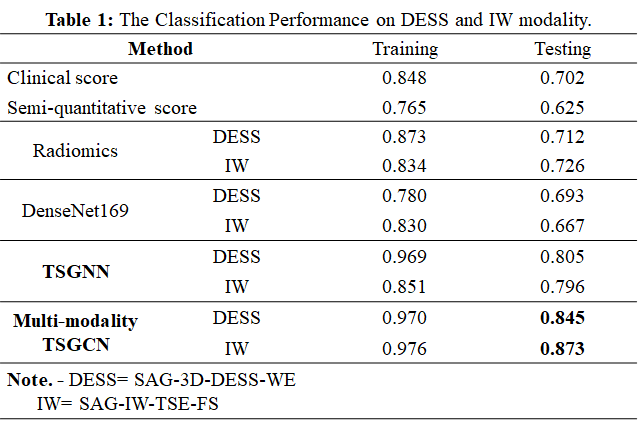
Results Details of classification performance on DESS and IW modalities based on different models are shown in table 1. The receiver operating characteristic (ROC) curves were shown in figure 3. The higher AUC of 0.805 (0.796) was achieved by the TSGCN on the SAG-3D-DESS-WE (SAG-IW-TSE-FS) modality compared to the radiomics model of 0.712 (0.716) or the CNN model of 0.693 (0.667). Unsurprisingly, the multi-modality TSGCN achieved the highest AUC of 0.845 on the SAG-3D-DESS-WE and 0.873 on the SAG-IW-TSE-FS, outperforming only utilizing image modality (AUC of 0.805 on the SAG-3D-DESS-WE and 0.796 on the SAG-IW-TSE-FS), semi-quantitative imaging markers (AUC of 0.632), or clinical variables (AUC of 0.701).
Conclusion This investigation indicated the better advantage of the learned specific regions and time-series by the time structural-regions graph convolutional network (TSGCN) compared to the radiomics model and the CNN model. Additional semi-quantitative imaging and clinical features improved the prediction performance of knee OA progression. However, we inferred that the image modality accounted for the main contribution of the proposed multi-modality method.
Acknowledgements
Not applicable.References
1. Guan B, Liu F, Haj-Mirzaian A, Demehri S, Samsonov A, Neogi T, et al. Deep learning risk assessment models for predicting progression of radiographic medial joint space loss over a 48-MONTH follow-up period. Osteoarthritis Cartilage 2020, 28(4): 428-437.
2. Eckstein F, Burstein D, Link TM. Quantitative MRI of cartilage and bone: degenerative changes in osteoarthritis. NMR Biomed 2006, 19(7): 822-854.
3. Conaghan PG, Felson D, Gold G, Lohmander S, Totterman S, Altman R. MRI and non-cartilaginous structures in knee osteoarthritis. Osteoarthritis Cartilage 2006, 14 Suppl A: A87-94.
4. Hunter DJ, Guermazi A, Lo GH, Grainger AJ, Conaghan PG, Boudreau RM, et al. Evolution of semi-quantitative whole joint assessment of knee OA: MOAKS (MRI Osteoarthritis Knee Score). Osteoarthritis Cartilage 2011, 19(8): 990-1002.
5. Isensee F, Jaeger PF, Kohl SA, Petersen J, Maier-Hein KH. nnU-Net: a self-configuring method for deep learning-based biomedical image segmentation. Nature methods 2021, 18(2): 203-211.
6. Bresson X, Laurent T. Residual Gated Graph ConvNets. CoRR 2017, abs/1711.07553.
7. Xu K, Li C, Tian Y, Sonobe T, Kawarabayashi KI, Jegelka S. Representation Learning on Graphs with Jumping Knowledge Networks. arXiv; 2018; 2018.
8. Huang G, Liu Z, Van Der Maaten L, Weinberger KQ. Densely connected convolutional networks. Proceedings of the IEEE conference on computer vision and pattern recognition; 2017; 2017. p. 4700-4708.
Figures