1169
Attention please: deep learning can reproduce fractional anisotropy microstructure maps with reduced input data but loses clinical sensitivity1Department of Brain and Behavioural Sciences, University of Pavia, Pavia, Italy, 2NMR Research Unit, Department of Neuroinflammation, Queen Square Multiple Sclerosis Centre, UCL Queen Square Institute of Neurology, University College London (UCL), London, United Kingdom, 3Department of Radiology, IRCCS Policlinico San Donato, Milan, Italy, 4Department of Biomedical Sciences for Health, Università degli Studi di Milano, Milan, Italy, 5Department of Medical Physics and Biomedical Engineering, Centre for Medical Image Computing (CMIC), University College London, London, United Kingdom, 6Universitat Oberta de Catalunya, E-Health Center, Barcelona, Spain, 7Brain Connectivity Centre, IRCCS Mondino Foundation, Pavia, Italy
Synopsis
Keywords: Image Reconstruction, Machine Learning/Artificial Intelligence, fractional anisotropy
Quantitative maps obtained with diffusion weighted (DW) imaging such as fractional anisotropy (FA) are useful in pathologies. Often, to speed up acquisition time, the number of DW volumes acquired is reduced. We investigated the performance and clinical sensitivity of deep learning (DL) networks to calculate FA starting from different numbers of DW volumes. Using 4 or 7 volumes, clinical sensitivity was affected because no consistent differences between groups were found, contrary to our “one-minute FA” that uses 10 DW volumes. When developing DL for reduced acquisition data, the ability to generalize and biomarker sensitivity must be assessed.Introduction
Diffusion weighted (DW) imaging has the major benefit of providing data that can be used to derive quantitative maps. From the simplest diffusion model, i.e. the diffusion tensor (DT), it is possible to calculate fractional anisotropy (FA), an index that is highly sensitive to microstructural damage of brain tissue due to pathological processes1. Mathematically, 7 DW volumes must be acquired to fully characterise the DT: 6 DW measurements along noncollinear directions and 1 with no DW, i.e. b-value=0. It has been noted that limiting the number of diffusion directions to 6 can introduce directional biases in DT metrics. Many studies have shown that to avoid this problem, i.e. directional dependency, it is necessary to increase the number of DW directions that also contribute to improving the signal-to-noise ratio2,3. However, increasing the number of acquired DW images inevitably increases acquisition times. Some studies, therefore, have investigated the possibility of reducing the number of DWs to obtain FA through deep learning (DL) methods4,5. We previously optimised a “one-minute FA” DL network that required 10 DW input volumes, retaining the quality of the high-resolution human connectome data (which has 288 DW volumes) used for model training and the sensitivity to pathology demonstrated in independent Temporal Lobe Epilepsy (TLE) and Multiple Sclerosis (MS) datasets, acquired with different protocols on different scanners, without the need for retraining6. Here we investigated how reducing the number of input DW volumes even further and retraining the DL network affects the properties of the estimated FA and its sensitivity to pathology.Methods
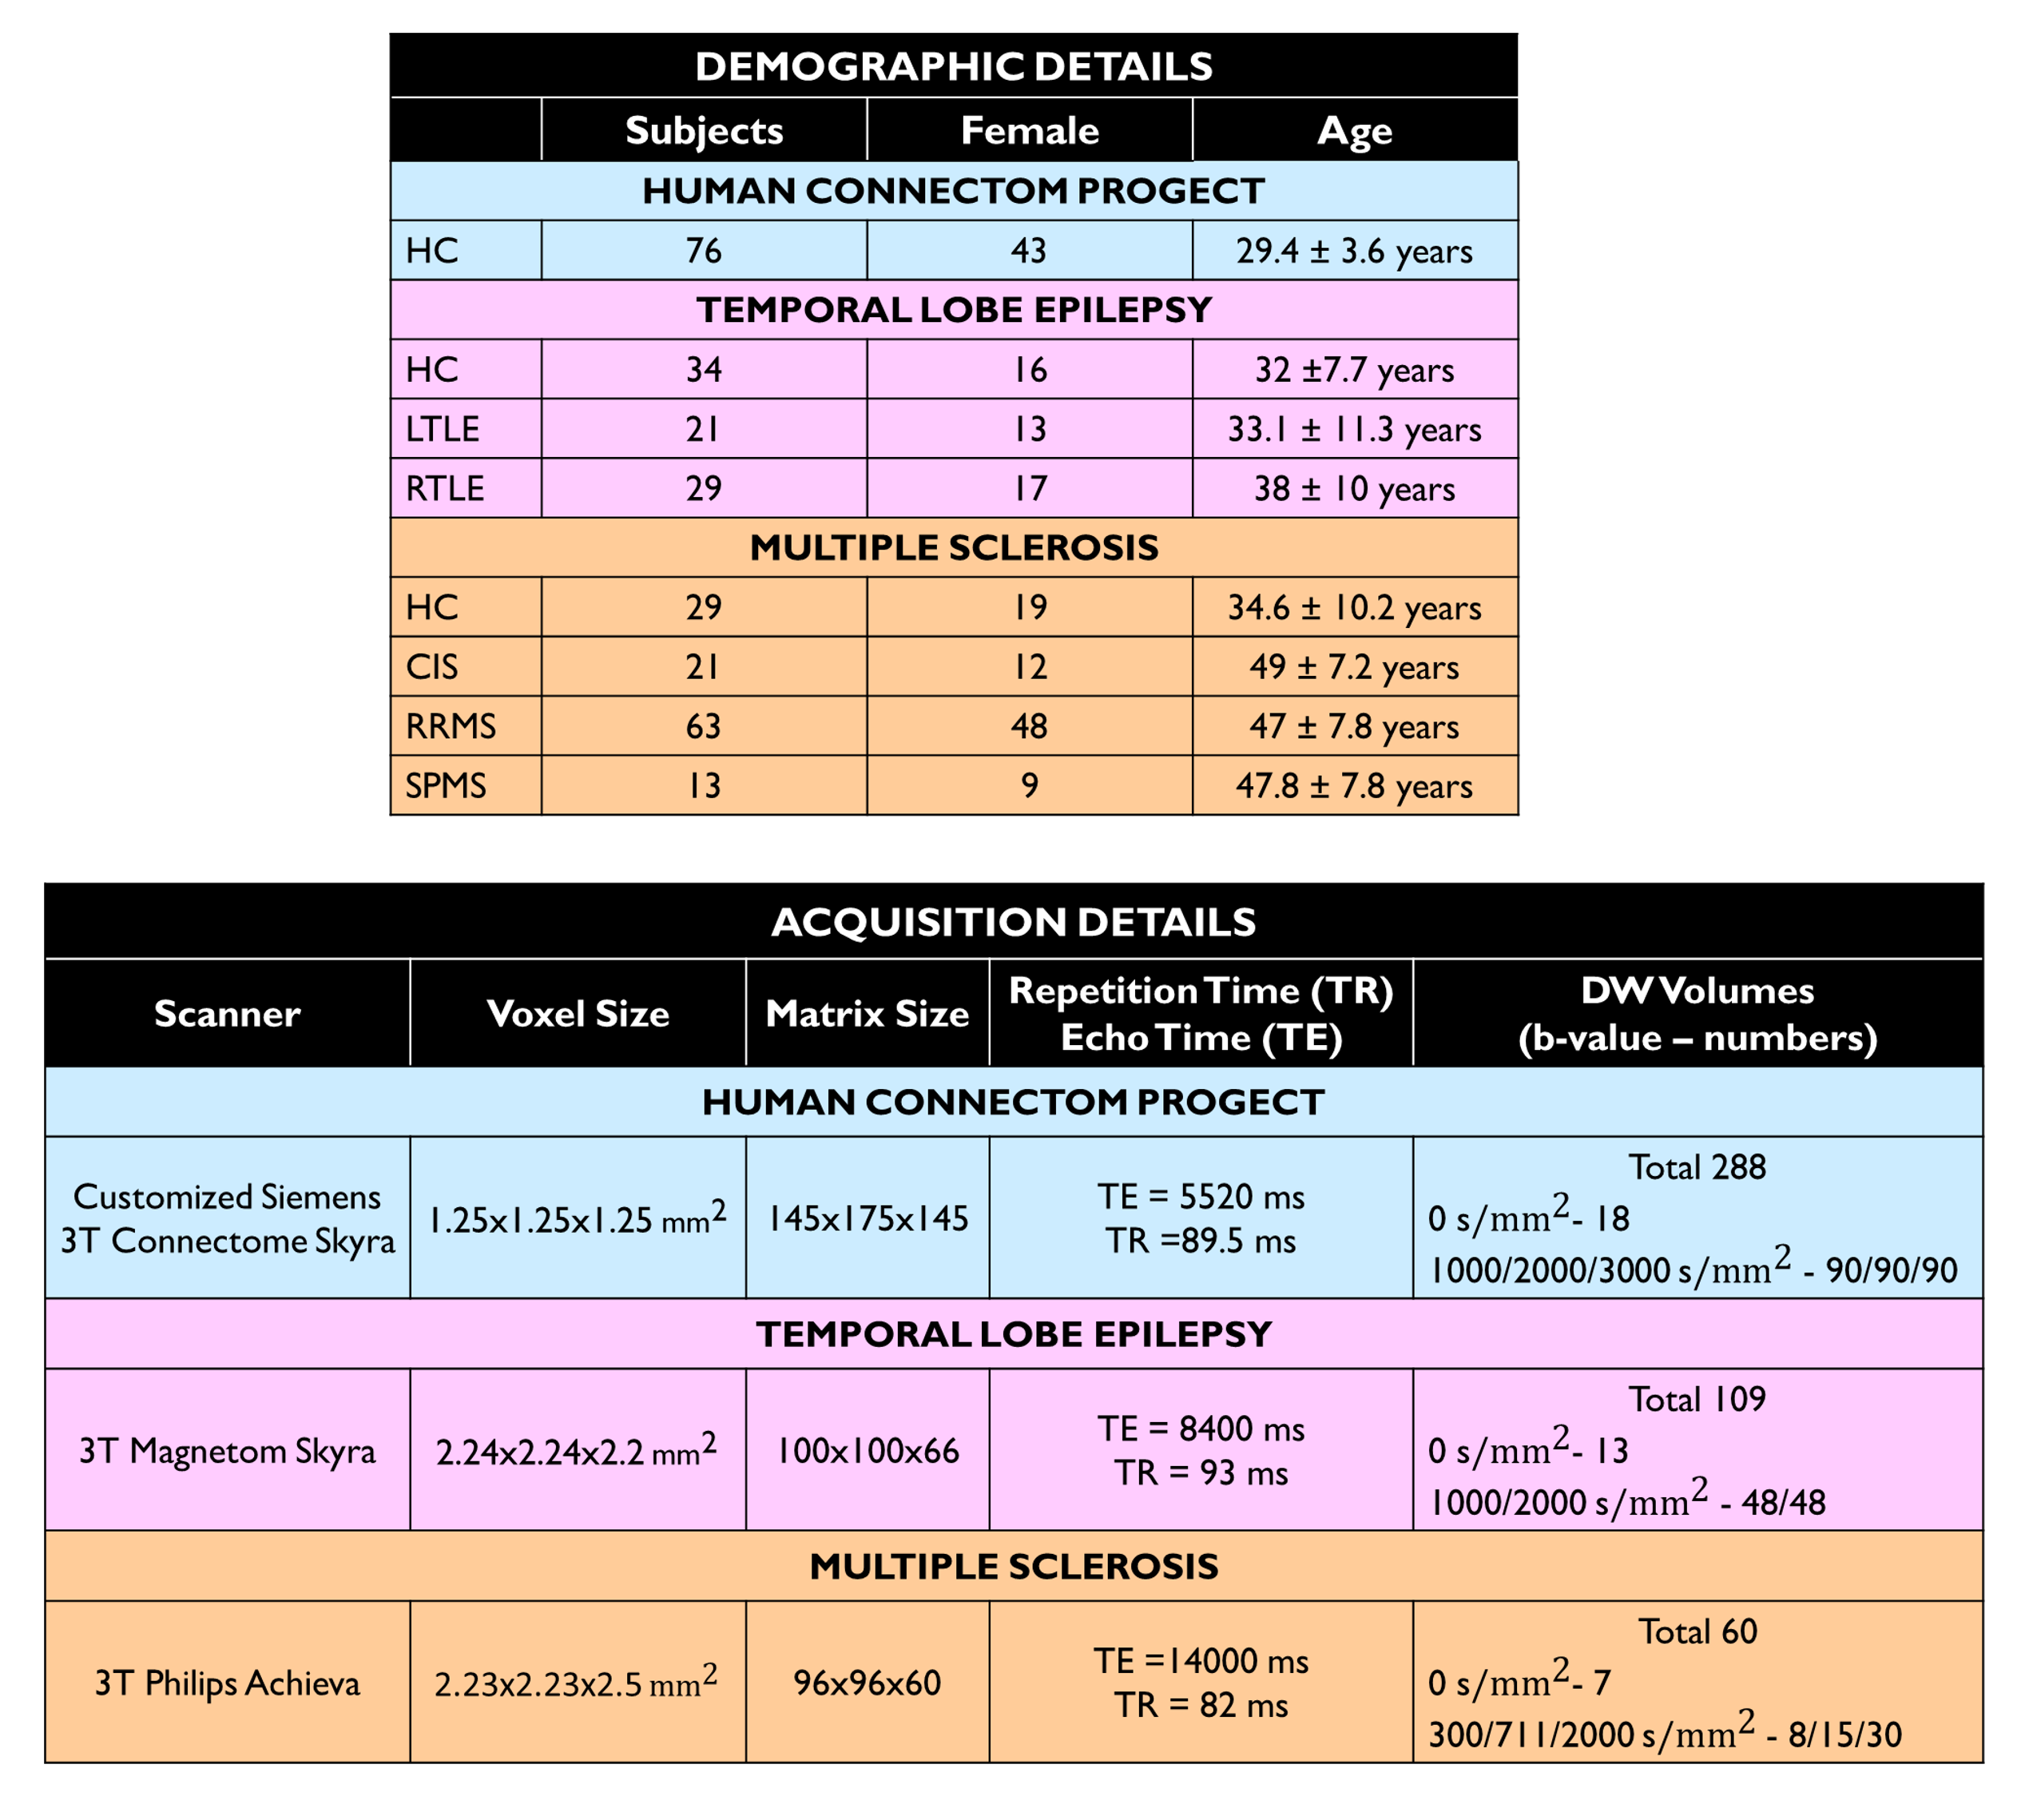
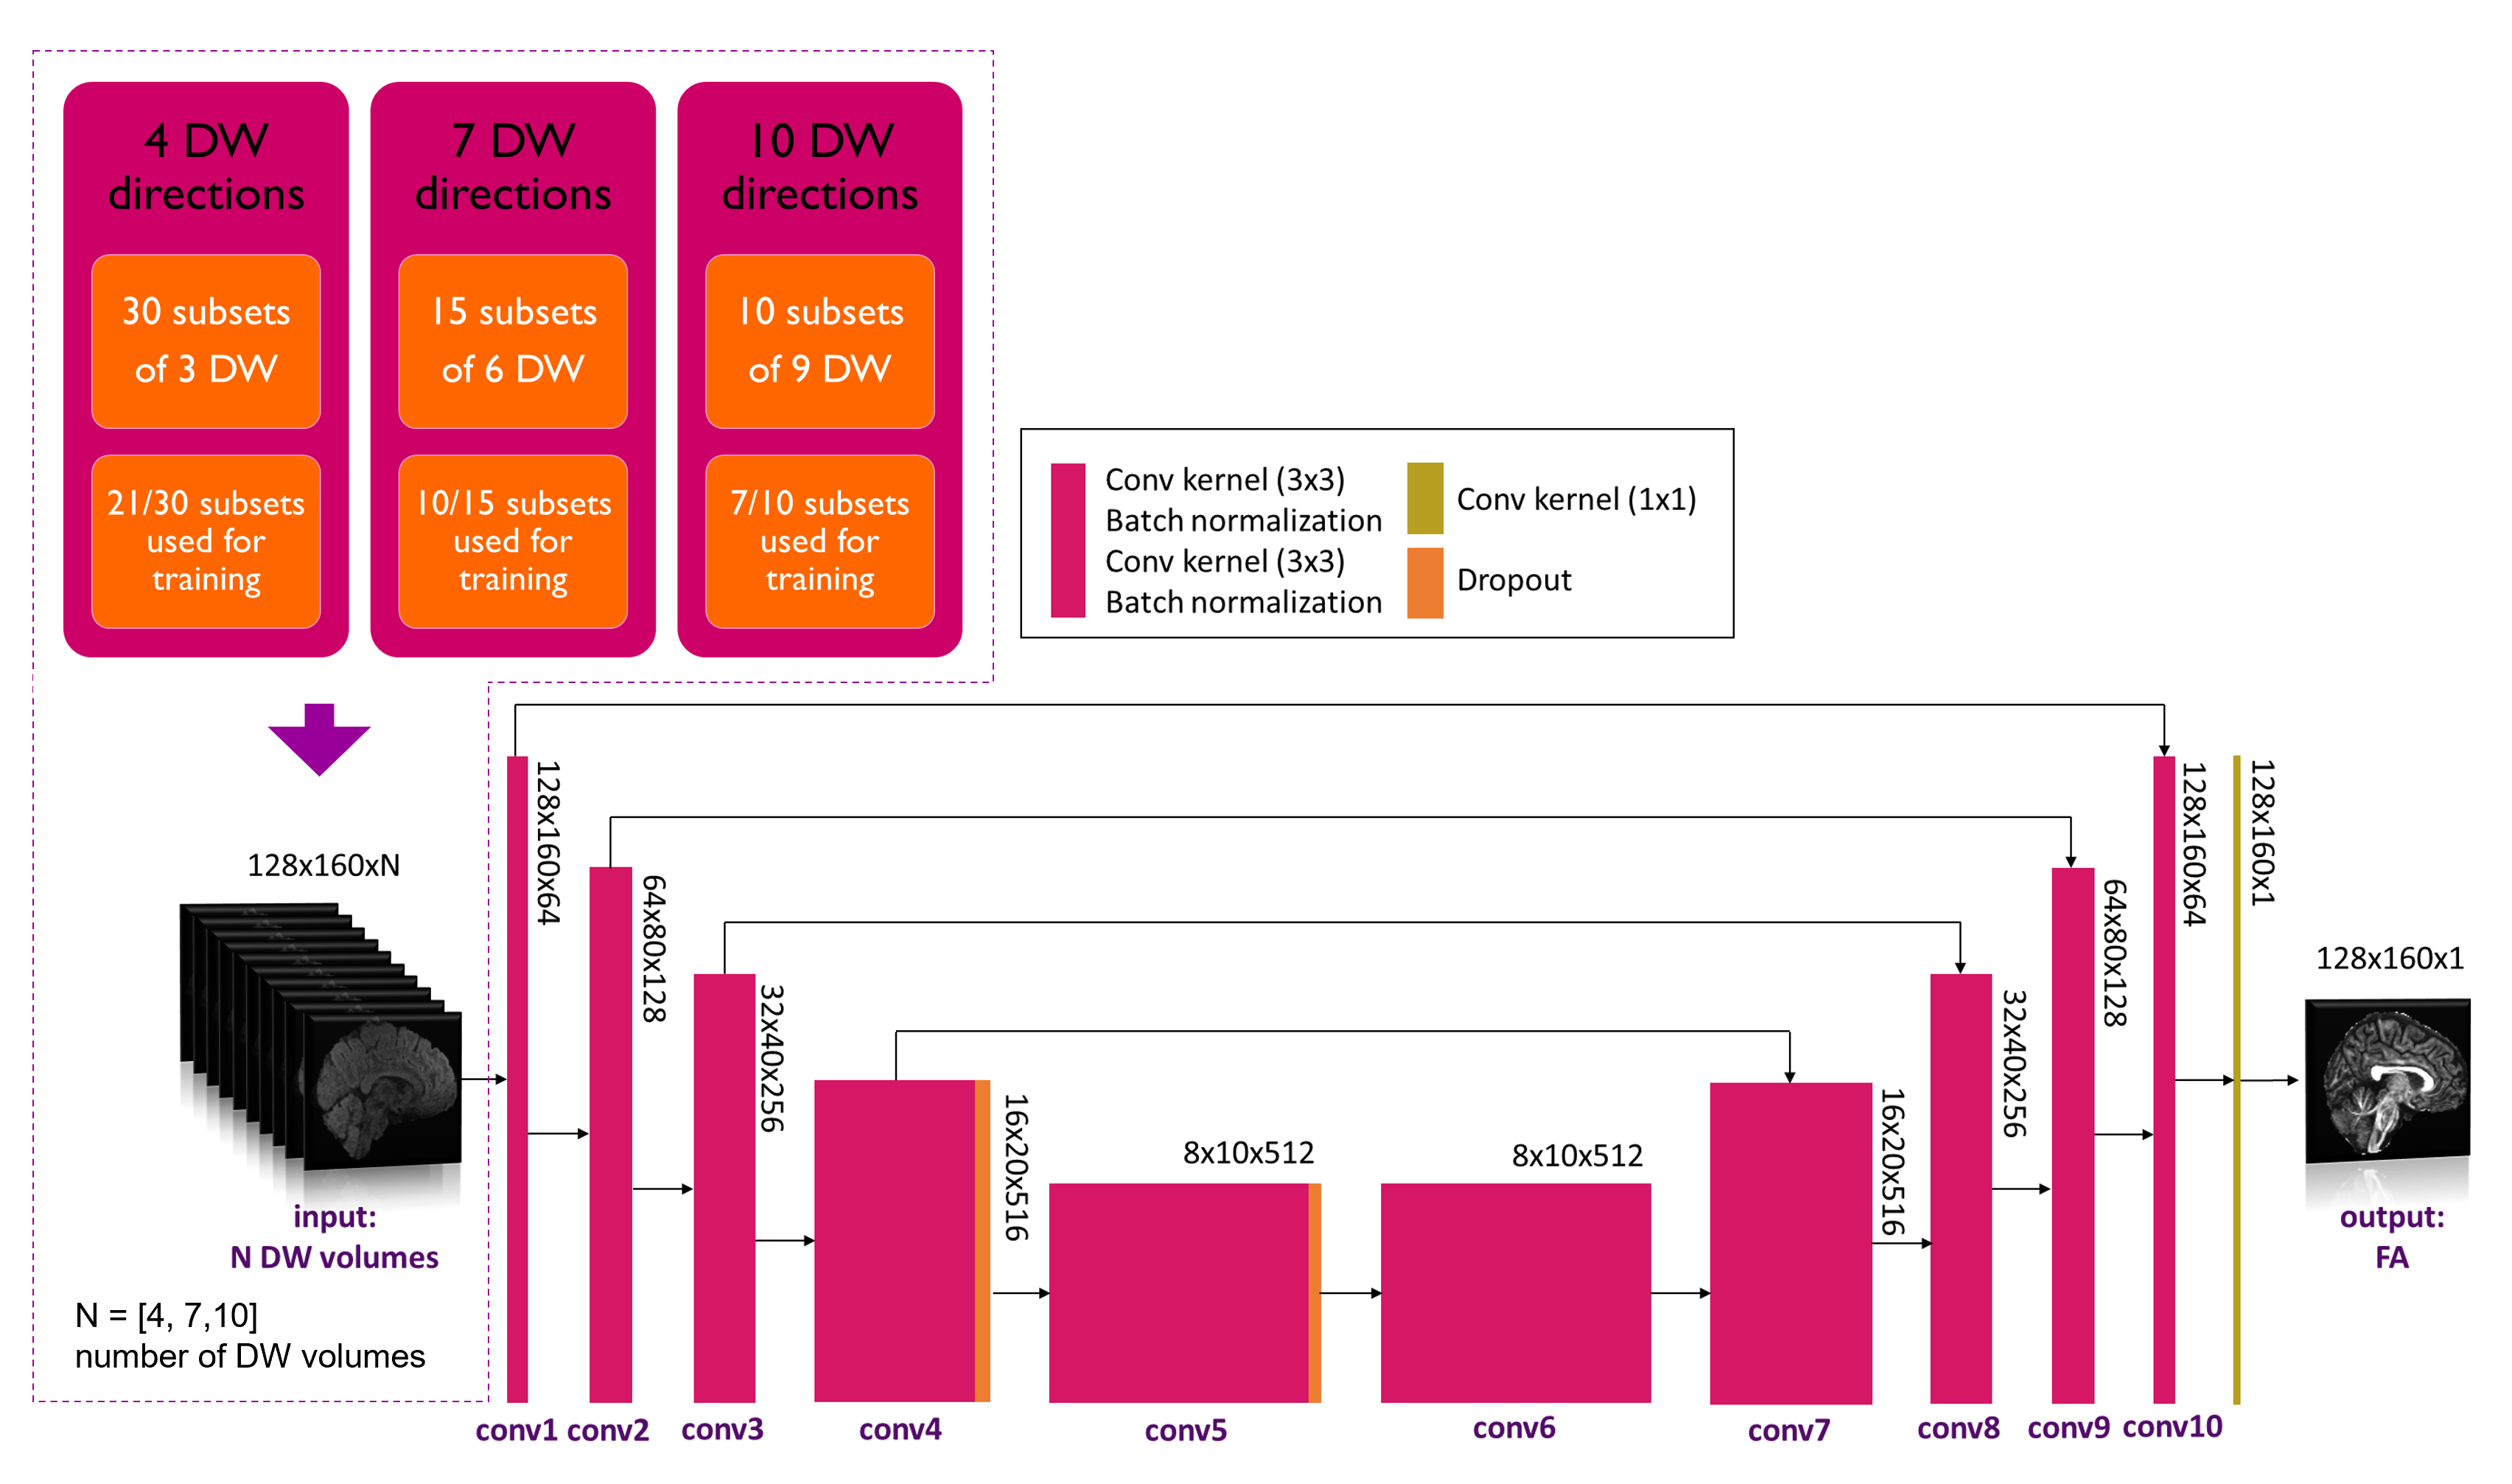
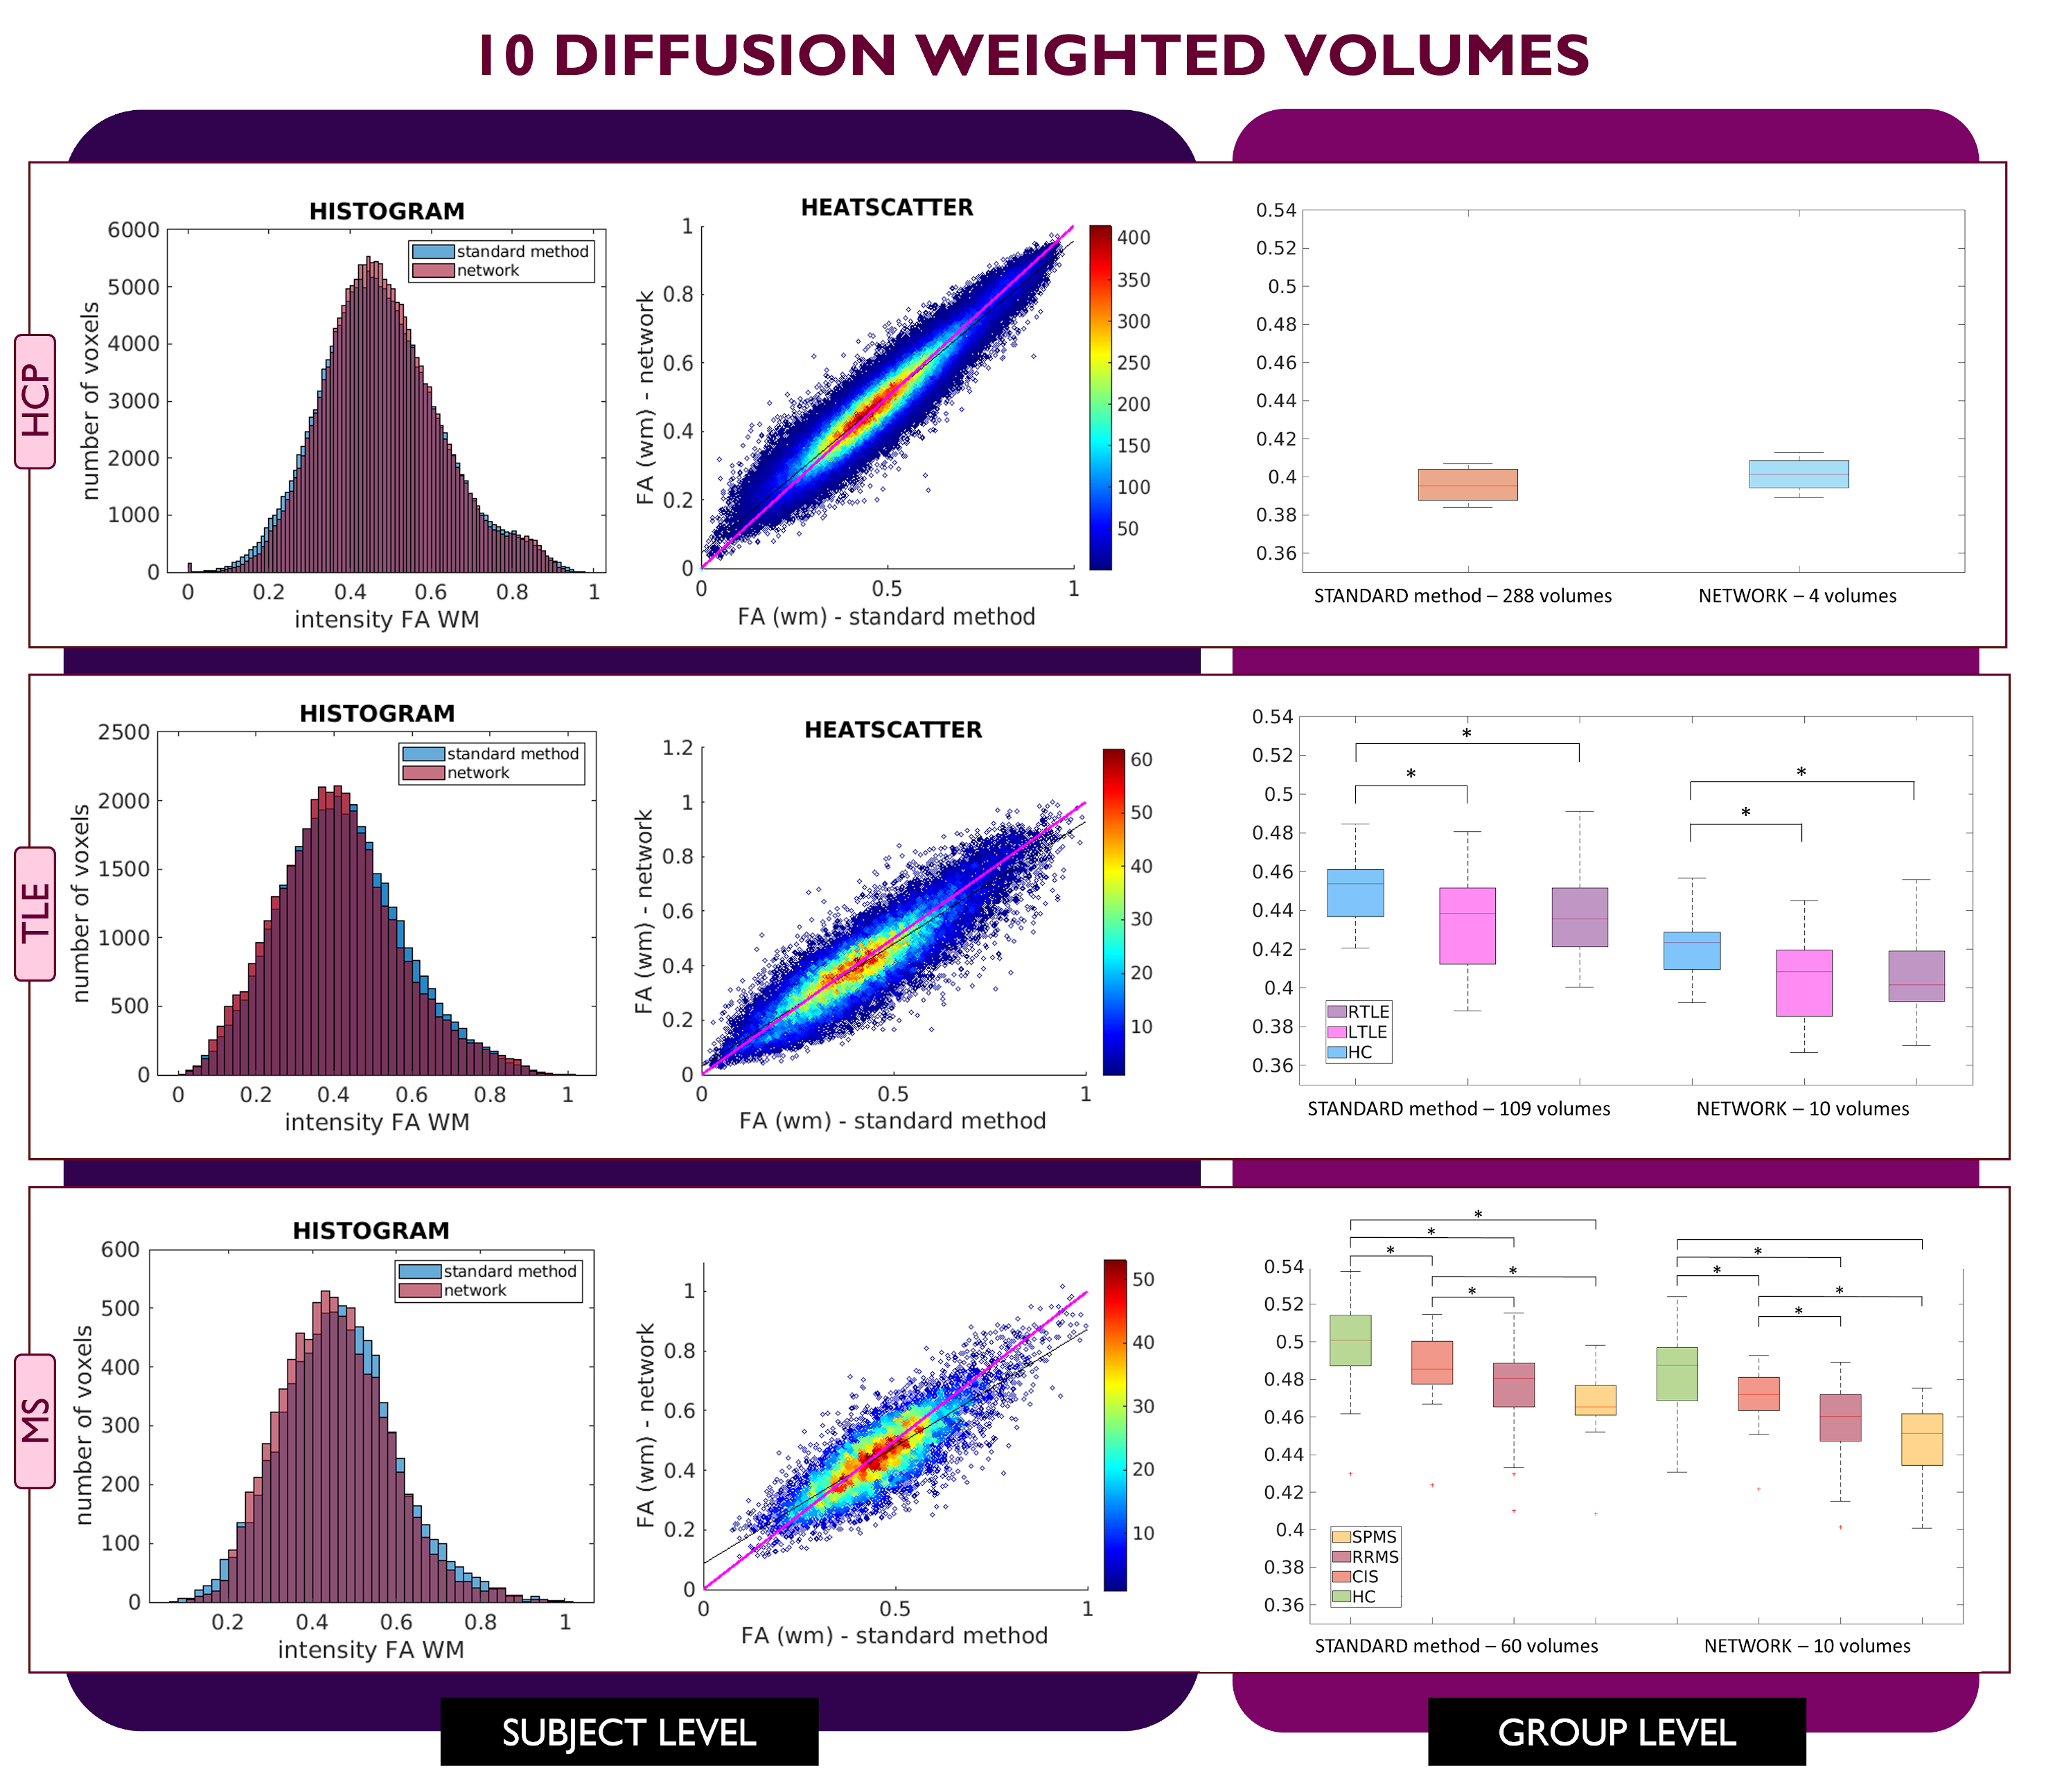
Datasets: Figure 1 shows demographic and acquisition details for each of the three datasets used here: the Human Connectome Project (HCP) for network training and TLE and MS datasets for clinical assessment. For each dataset the FA used as ground truth (GT) was calculated with DT fitting using all DW volumes (STANDARD method).Architecture: U-net architecture7 was adapted as shown in Figure 2 and hyperparameters were chosen as in the “one-minute FA” work6. We used as loss function the sum of the root mean square error and the structural dissimilarity index8. Adam optimizer was used9.
Data preparation and training: We explored several combinations of input, namely 4, 7 and 10 DW volumes. A network was trained on each of these input data sets. Each network was trained on the HCP data and the number of subsets used for training was set to 70% of the total number of subsets for all combinations, so that the training and validation sets had a similar amount of data (Figure 2). The remaining 30% of the data was used for testing. Once the network parameters were set, the network was applied to the HCP test subjects and to the clinical datasets, i.e. TLE and MS.
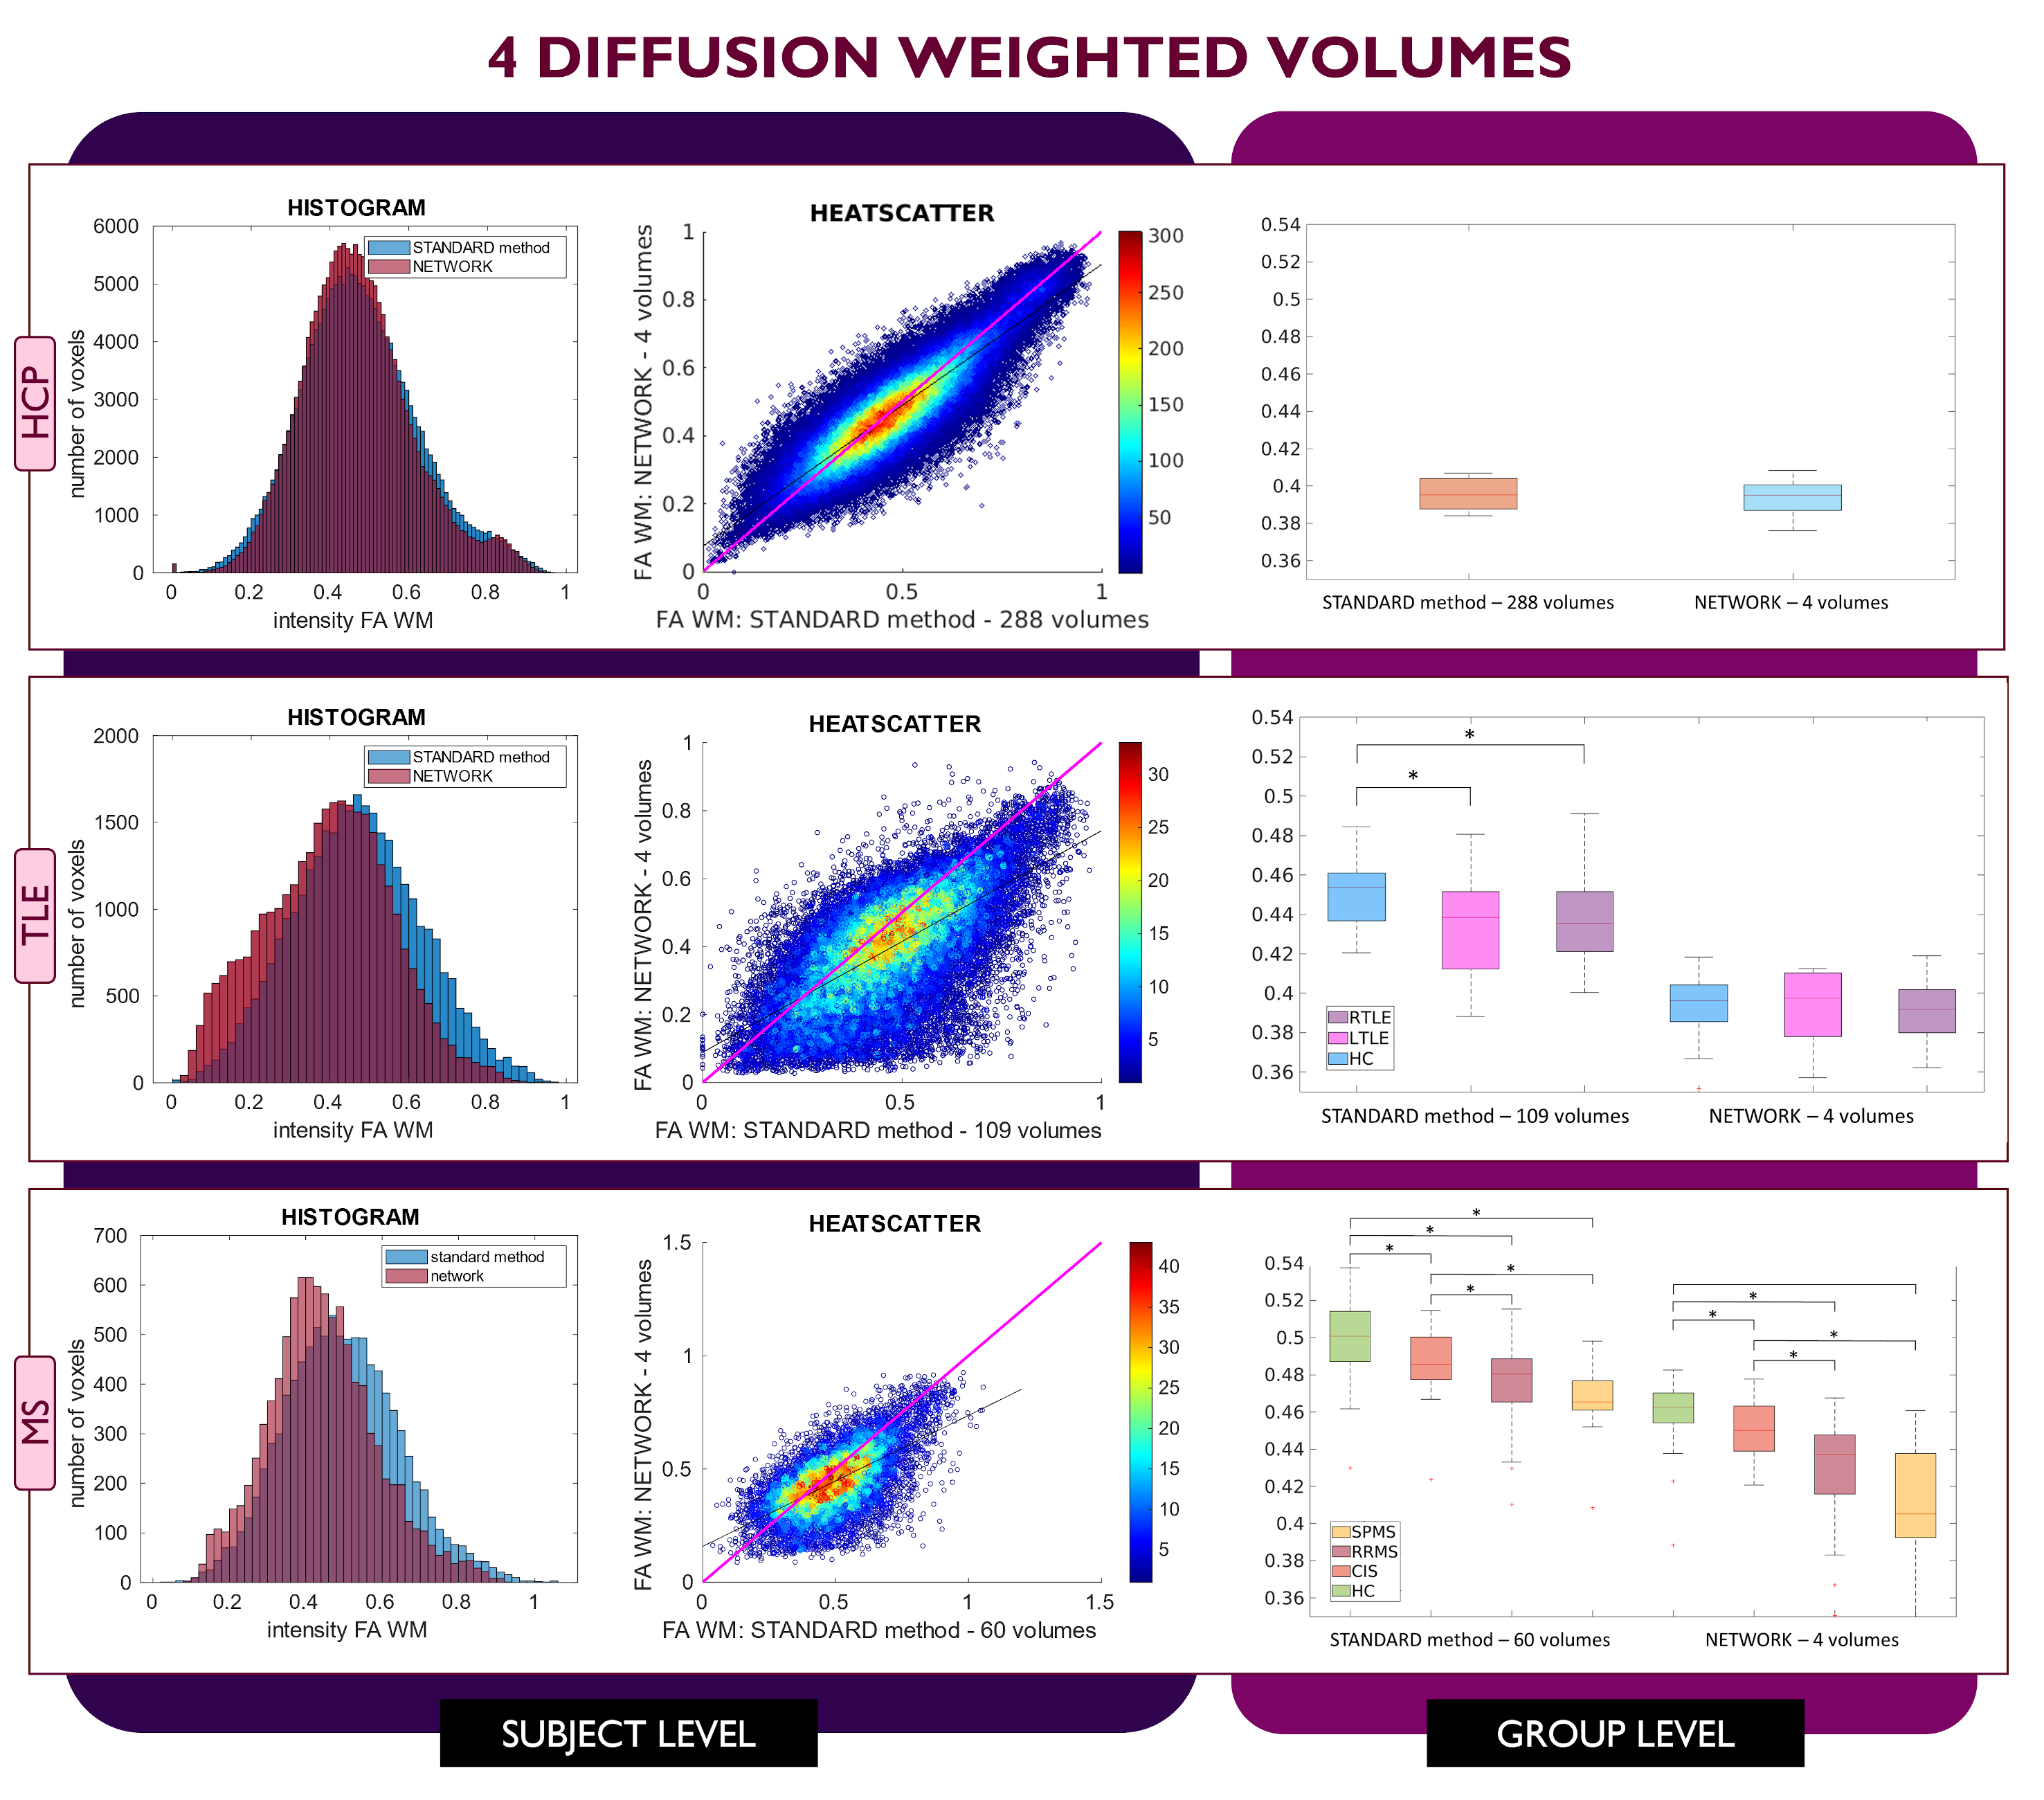
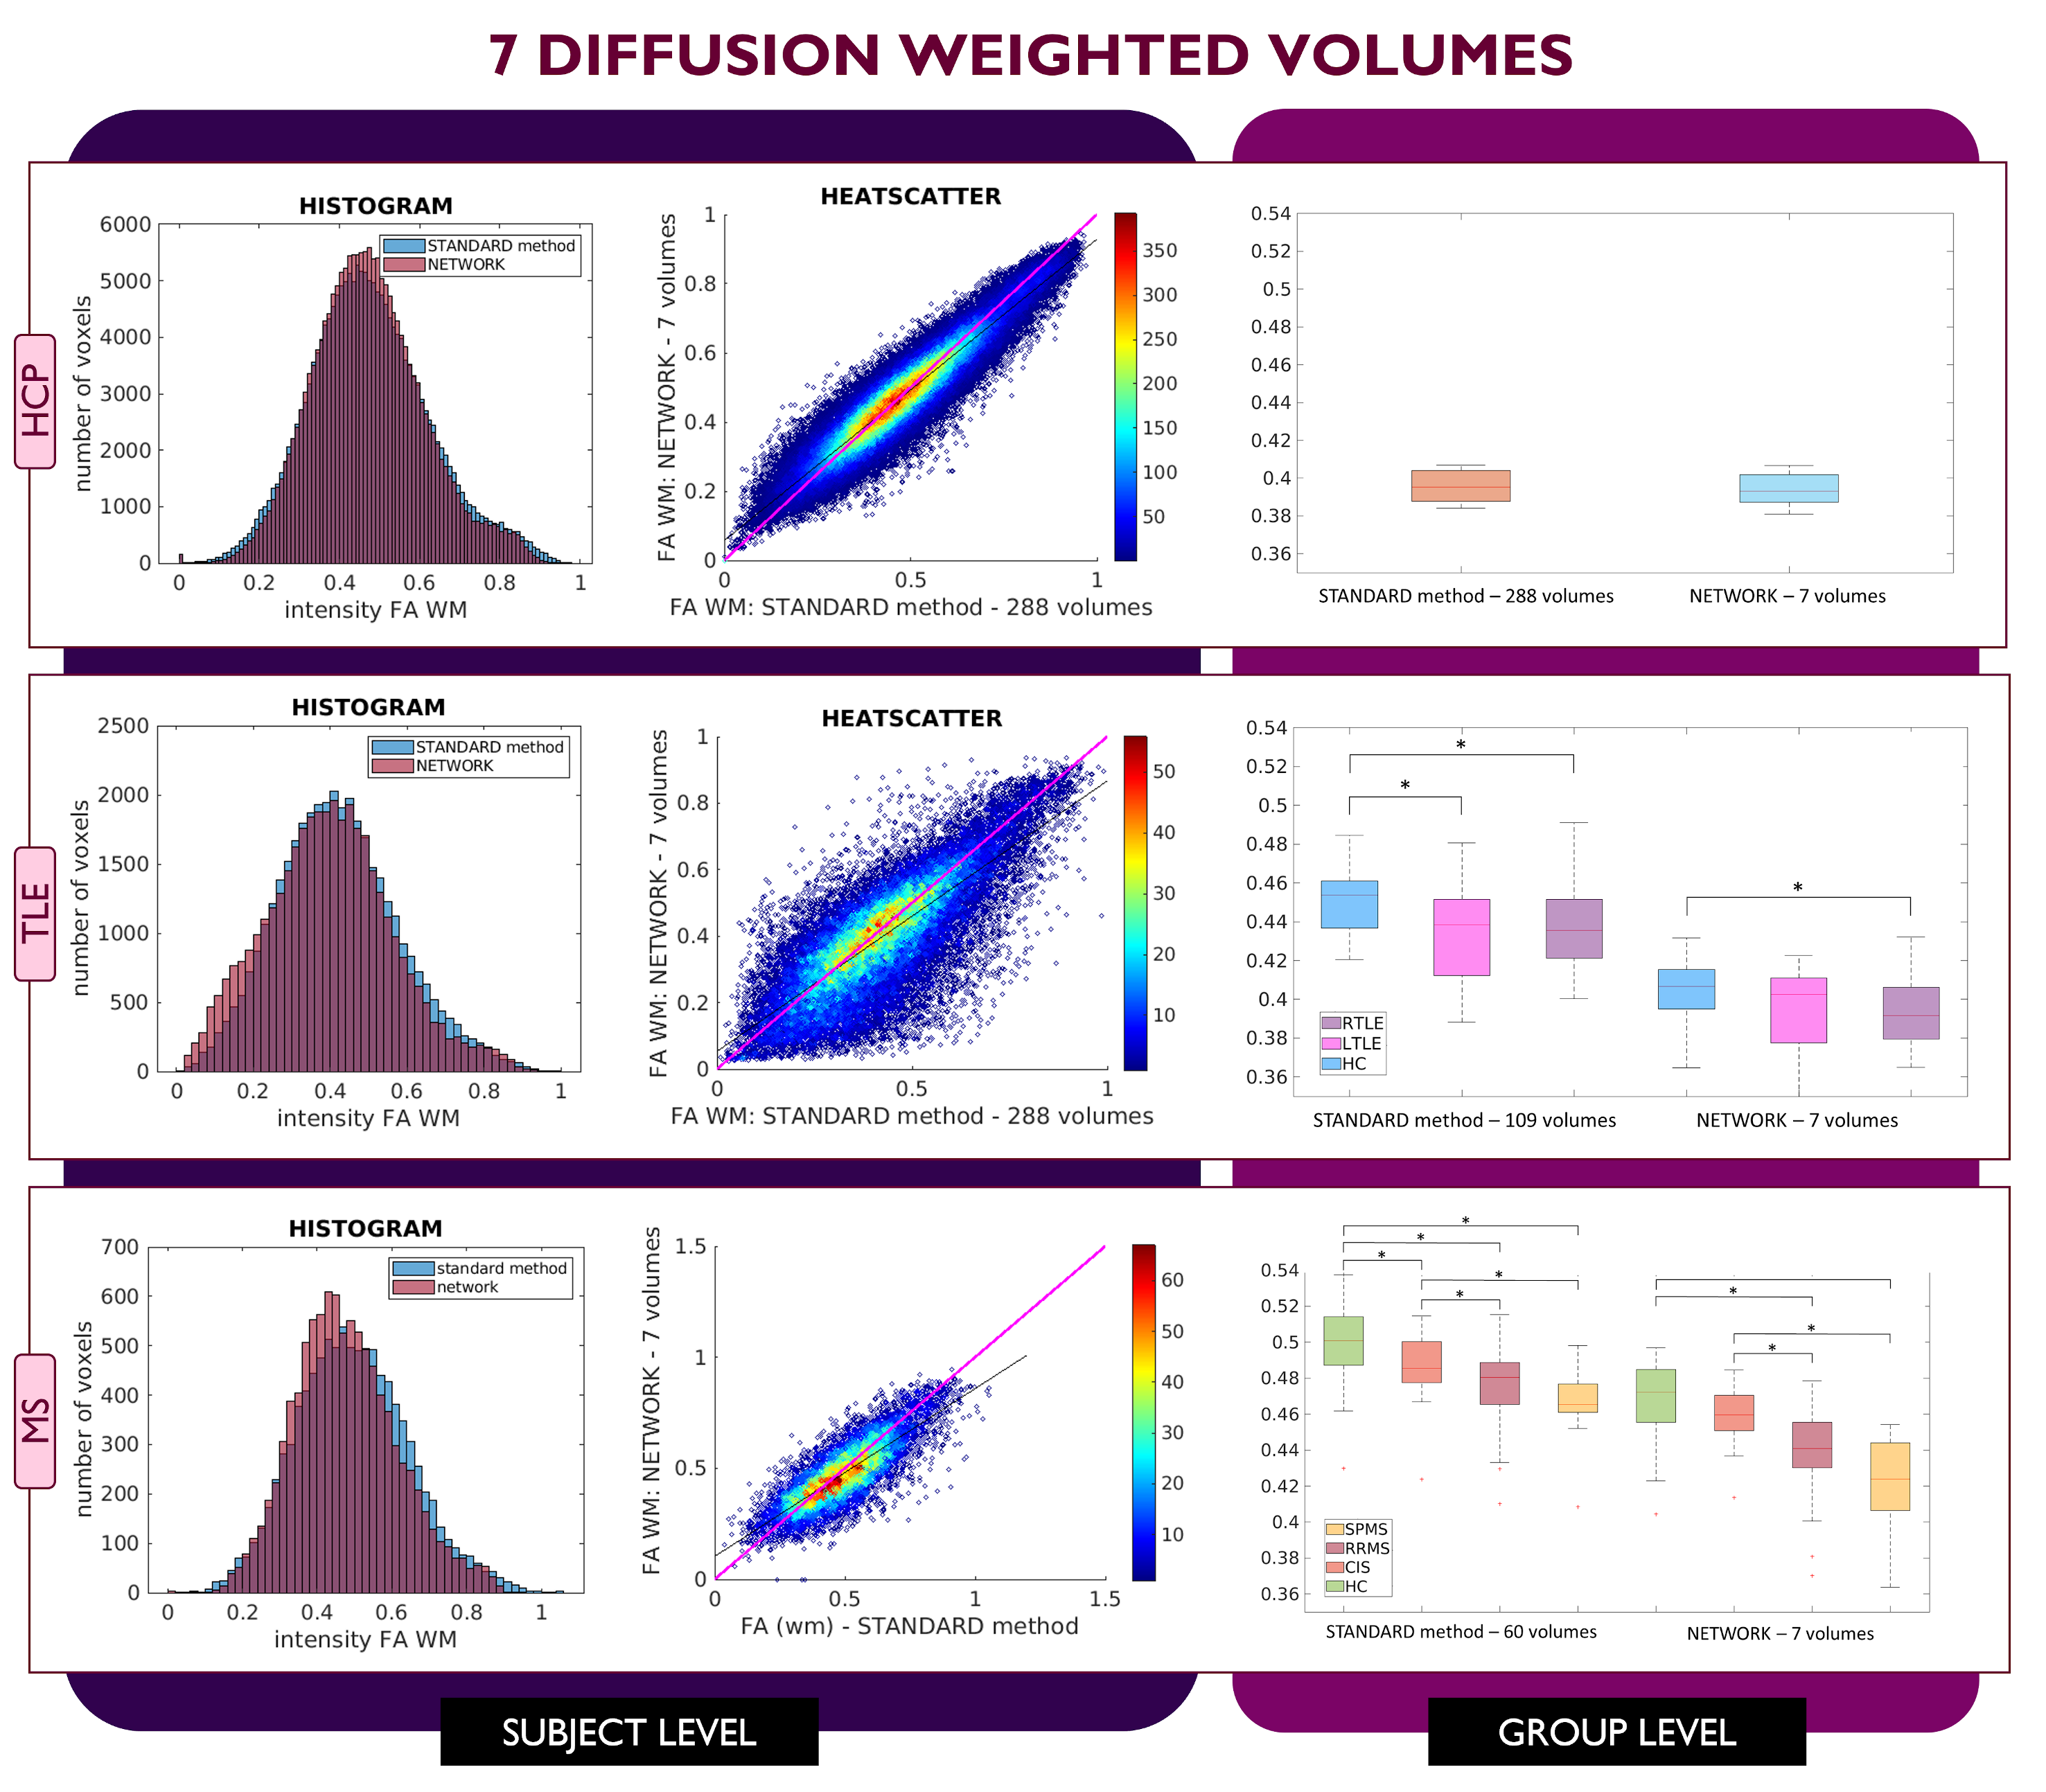
Performance assessment: For each subject, white matter (WM) FA was calculated twice: with the STANDARD method using all volumes and with the network. For MS subjects, normal appearing WM (NAWM) was considered, i.e., the WM excluding lesions. We visualised single-subject WM FA using histograms and heatscatter plots while group values were represented using boxplots. Mann-Whitney U-tests were performed to compare group differences between GT and the network.
Results
For each number of DW inputs, FA was successfully obtained for each dataset: HCP test subjects, TLE and MS.Figures 3, 4, and 5 show the plots for each experiment. Each row refers to a different dataset and shows the histogram, heatscatter plot and boxplot for WM FA obtained using each method. The significant group differences are reported as asterisks (p<0.05).
Discussion
All networks (4 DW, 7 DW and 10 DW) performed well on the test HCP data. Conversely, for clinical datasets, the sensitivity to pathology was partially lost with both reduced input networks, i.e., 4 and 7 DW volumes.Indeed, when using the 4 DW network FA no statistical differences were detected between HC and TLE patients. While significant differences between HC and MS patients survived, NAWM FA values were lower than those calculated with the STANDARD method. Interestingly, the standard deviation of FA in SPMS was increased compared to the STANDARD one, possibly due to a greater level of tissue heterogeneity not fully captured by training the network on limited input volumes on HC, given the greater extent of tissue damage. When using 7 DW network in the TLE dataset, network FA did not identify differences between HC and Left TLE, and in the MS dataset, differences were not found between HC and clinical isolated syndrome (CIS) patients.
On the other hand, we verified that clinical sensitivity can be maintained using the 10 DW network (one minute FA network).
Conclusion
We investigated the dependency of DL network FA on the number of DW volumes used as input. With 4 or 7 DW volume clinical sensitivity of the network FA decreased compared to STANDARD. Reducing the input data is an appealing proposal in term of scan time and cost/benefit evaluations but reducing input data has a detrimental effect on obtaining a network capable of generalization. When developing DL methods for clinical adoption it is important to reach a good compromise between data acquisition time and clinical sensitivity of network output.Acknowledgements
Data were provided [in part] by the Human Connectome Project, WU-Minn Consortium (Principal Investigators: David Van Essen and Kamil Ugurbil; 1U54MH091657) funded by the 16 NIH Institutes and Centers that support the NIH Blueprint for Neuroscience Research; and by the McDonnell Center for Systems Neuroscience at Washington University. 3TLE is a multicentric research project granted by Italian Health Ministry (NET2013-02355313): Magnetic resonance imaging in drug-refractory temporal lobe epilepsy: standardization of advanced structural and functional protocols at 3T, to identify hippocampal and extra-hippocampal abnormalities.CGWK received funding Horizon2020 (Human Brain Project SGA3, Specific Grant Agreement No. 945539 ), BRC (#BRC704/CAP/CGW), MRC (#MR/S026088/1), Ataxia UK, MS Society (#77), Wings for Life (#169111). CGWK is a shareholder in Queen Square Analytics Ltd. FP receive funding from H2020 Research and Innovation Action Grants Human Brain Project (#785907, SGA2 and #945539, SGA3).References
1. Alexander, A. L., Lee, J. E., Lazar, M. & Field, A. S. Diffusion Tensor Imaging of the Brain. Neurotherapeutics 4, 316–329 (2007).
2. Lebel, C., Benner, T. & Beaulieu, C. Six is enough? Comparison of diffusion parameters measured using six or more diffusion-encoding gradient directions with deterministic tractography. Magn. Reson. Med. 68, 474–483 (2012).
3. Giannelli, M. et al. Dependence of brain DTI maps of fractional anisotropy and mean diffusivity on the number of diffusion weighting directions. J. Appl. Clin. Med. Phys. 11, 176–190 (2010).
4. Aliotta, E., Nourzadeh, H. & Patel, S. H. Extracting diffusion tensor fractional anisotropy and mean diffusivity from 3-direction DWI scans using deep learning. 845–854 (2021). doi:10.1002/mrm.28470
5. Li, C., Sun, Y. I., Yu, F. & Zhong, J. Fast and Robust Diffusion Kurtosis Parametric Mapping Using a Three-Dimensional Convolutional Neural Network. IEEE Access 7, 71398–71411 (2019).
6. Gaviraghi, M. et al. A generalized deep learning network for fractional anisotropy reconstruction : Application to epilepsy and multiple sclerosis. Front. Neuroinform. (2022). doi:10.3389/fninf.2022.891234
7. Ronneberger, O., Fischer, P. & Brox, T. U-Net: Convolutional Networks for Biomedical Image Segmentation. in Medical Image Computing and Computer-Assisted Intervention -- MICCAI 2015 (eds. Navab, N., Hornegger, J., Wells, W. M. & Frangi, A. F.) 234–241 (Springer International Publishing, 2015).
8. Hou, R. et al. Anomaly Detection of Calcifications in Mammography Based on 11,000 Negative Cases. IEEE Trans. Biomed. Eng. XX, 1–1 (2021).
9. Kingma, D. P. & Ba, J. L. Adam: A Method for Stochastic Optimization. arXivpreprint arXiv:1412.6980 (2017).
Figures