1155
Dynamic field correction for improved susceptibility weighted imaging with FID-navigated 3D EPI1Radiology, Harvard Medical School, Boston, MA, United States, 2Computational Radiology Laboratory, Boston Children's Hospital, Boston, MA, United States, 3Advanced Clinical Imaging Technology Group, Siemens Healthcare International AG, Lausanne, Switzerland, 4Radiology, Lausanne University Hospital and University of Lausanne, Lausanne, Switzerland, 5LTS5, Ecole Polytechnique Fédérale de Lausanne, Lausanne, Switzerland
Synopsis
Keywords: Artifacts, Susceptibility
3D EPI is a clinically promising alternative for susceptibility weighted imaging due to multi-shot acceleration. However, achieving submillimeter resolution with 3D EPI is challenging as shot-to-shot B0 variations result in artifactual images that limit detection of small veins which can be decisive for detection of the central vein sign in multiple sclerosis. FID navigators have been shown to estimate phase drifts in EPI sequences. We demonstrate that FID-navigated 3D EPI acquisitions enable correction for phase-induced distortions and achieve high-quality submillimeter-resolution susceptibility weighted images.Introduction
Susceptibility weighted imaging (SWI) is a powerful technique to visualize blood vessels for applications such as traumatic brain injury and multiple sclerosis (MS) [1,2]. Multi-shot 3D echo-planar imaging (EPI) provides faster acquisition times, the possibility to acquire higher resolution images, and reduced motion artifacts compared to conventional gradient-echo sequences for slice thicknesses higher than 2 mm [3]. However, patient movement and B0 fluctuations are still problematic for acquiring submillimeter resolution images. This is especially critical for detecting the central vein sign in MS patients as it can lead to misdiagnosis in artifactual images [4]. Free induction decay navigators (FIDnavs) have previously been proposed to measure and correct spatially-varying field changes [5]. In this work, we implement an FID-navigated 3D EPI sequence and demonstrate improved SWI image quality with submillimeter resolution in the presence of spatiotemporal B0 fluctuations using FIDnav-based field monitoring.Methods
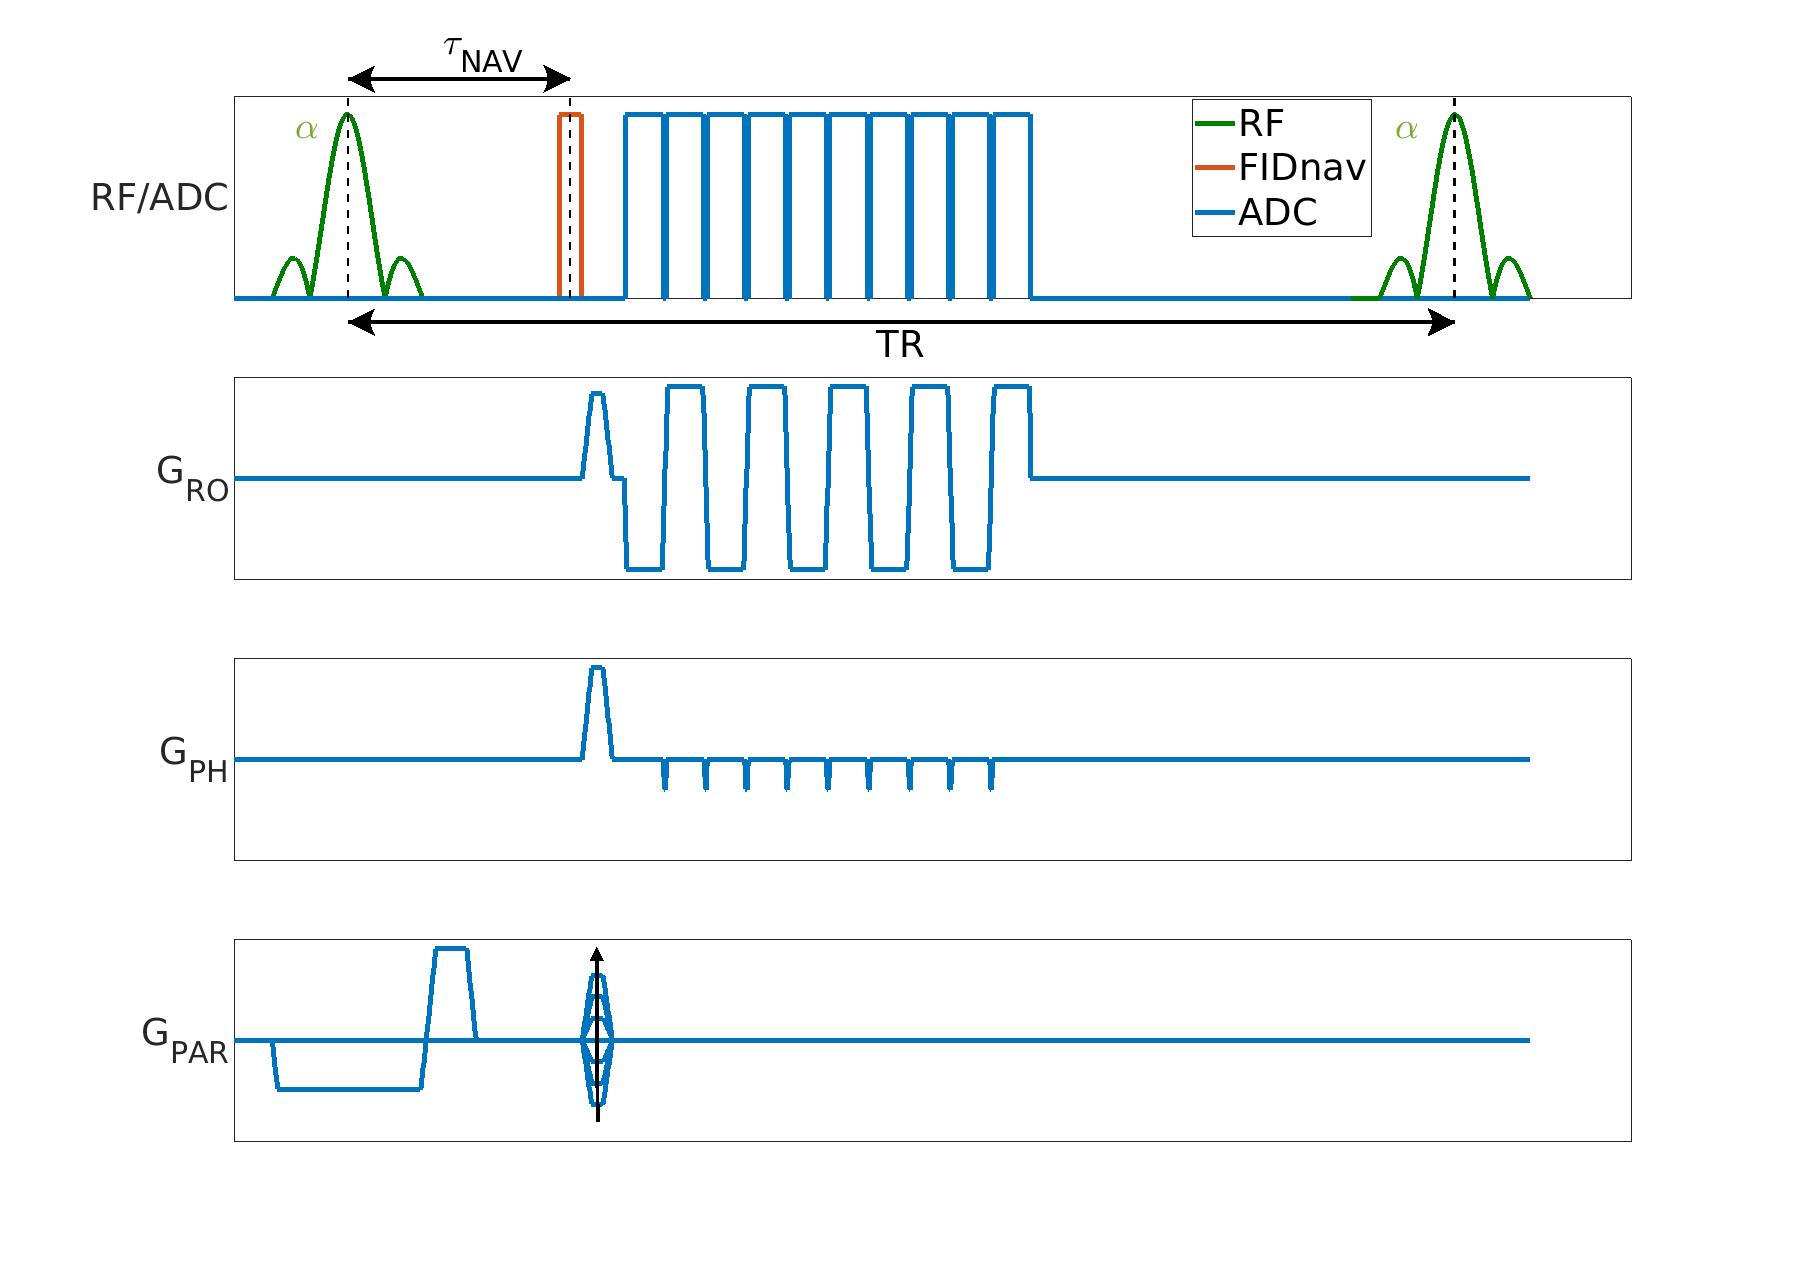
TheoryAn FIDnav module with a duration of 0.4 ms was inserted after each slab-selective excitation pulse of a multi-shot 3D EPI sequence as shown in Figure 1. Two low-resolution calibration scans with reversed gradient polarities were used to create a forward model of FIDnav signal changes. This model used a B0 field map that was approximated using zeroth- and first-order 3D spherical harmonic functions with four coefficients. For image reconstruction, the corrected k-space positions were reconstructed with an iterative nonuniform FFT (NUFFT) algorithm [6,7].
Phantom Study
An ADNI phantom was scanned at 3T (MAGNETOM Prisma, Siemens Healthcare, Erlangen) using a 20-channel head coil. The imaging protocol consisted of two low-resolution calibration scans (with 3.5 mm isotropic resolution, TA=0:48 min, TE=5 ms, TR=60 ms, FA=20°, matrix size=64x64x36) followed by two high-resolution scans (with 0.9 mm isotropic resolution, TA=2:35 min, TE=30 ms, TR=60 ms, FA=20°, matrix size=256x256x144, ETL=15). The high-resolution scans were acquired with (i) no disturbance and (ii) a water bottle rolling in and out at ~10 seconds intervals to induce a motion artifact. To compare the correction results with the reference images, normalized root mean square error (NRMSE) and structural similarity (SSIM) metrics were used.
Volunteer Study
Following written informed consent, three subjects were scanned at 3T (same as above) using a 64-channel head coil following the same protocol as in the phantom scans. Two high-resolution scans were acquired. In the first scan, volunteers had a regular breathing pattern, which was used as a no-motion reference image. In the second scan, volunteers were instructed to take deep breaths during the acquisition to create dynamic field changes. For the SWI reconstruction, a phase mask was generated by high-pass filtering the phase images. This filter was obtained by taking the central 64x64 region of the original data and zero-filling the rest to match the image size. To differentiate the tissue types, the number of phase mask multiplications was chosen as four to adjust the contrast-to-noise ratio. The minimum intensity projection (minIP) images were then displayed over four images [8,9].
Results
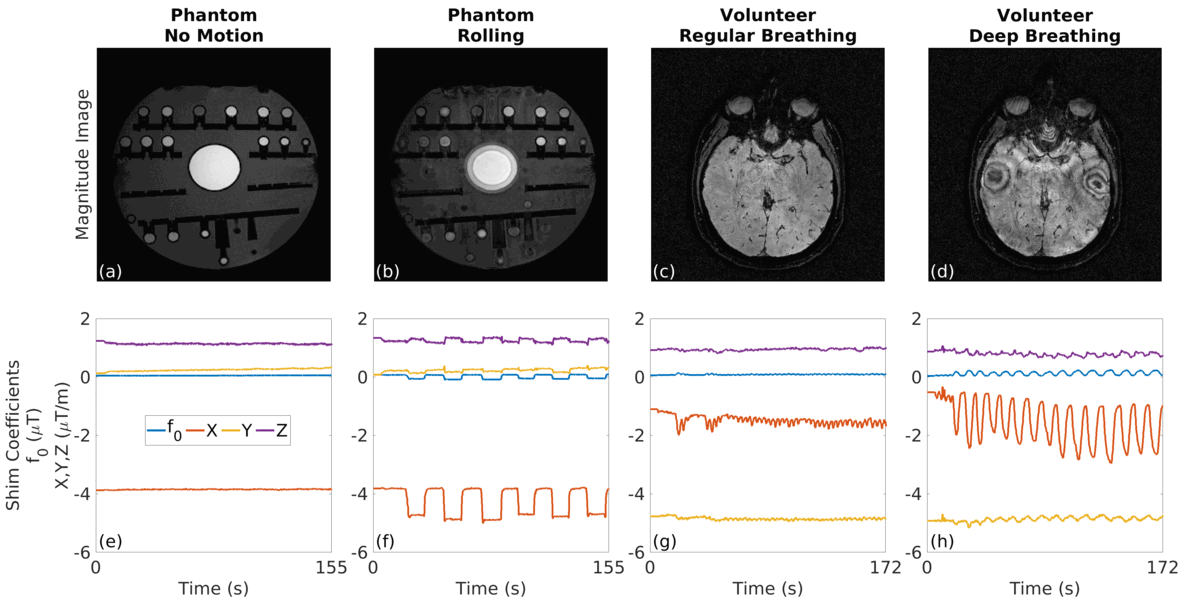
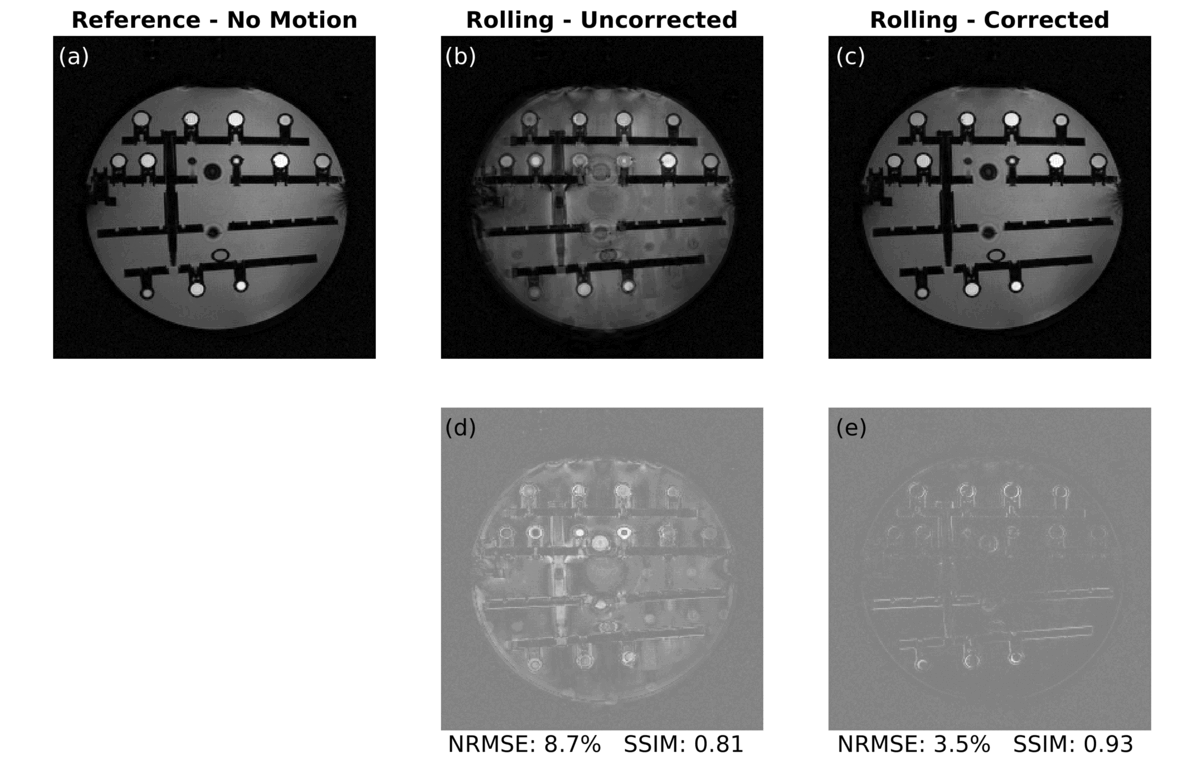
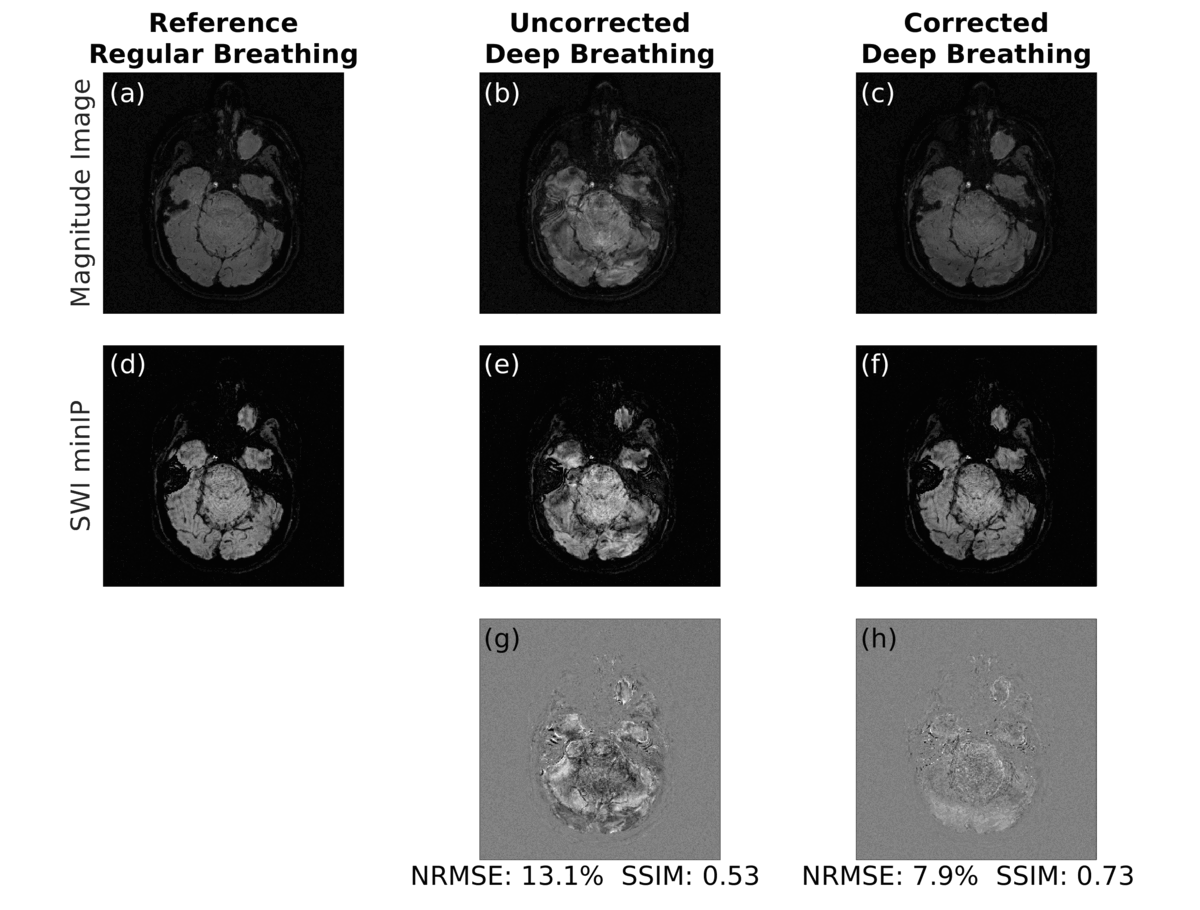
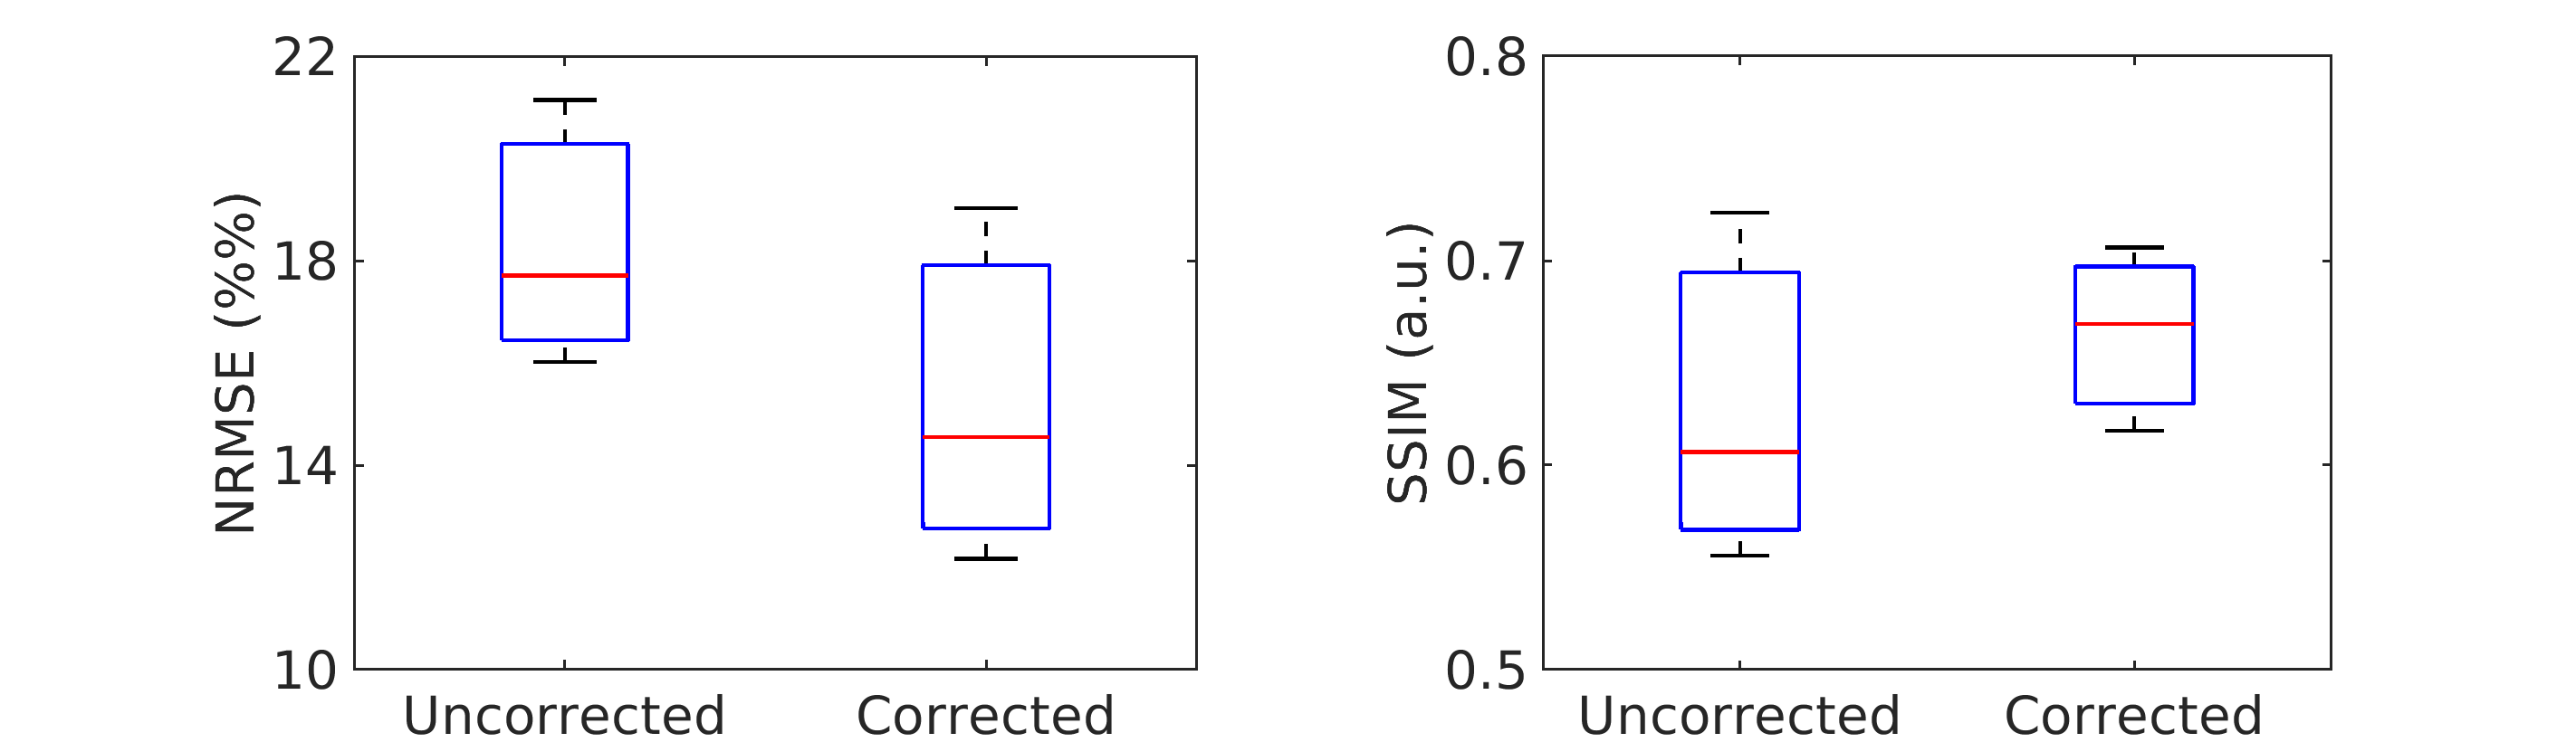
The estimated zeroth- and first-order shim coefficients are shown in Figure 2 for both phantom and volunteer scans. The distortion in the B0 field induced by rolling a water bottle in the phantom study as well as performing deep breathing in the volunteer studies is clearly visible in these artifactual images. The proposed FID-navigated technique accurately estimated and corrected for the field changes as shown in Figure 3 for the phantom data (NRMSE of 9.0% vs. 3.2%, SSIM of 0.78 vs. 0.94) and in all three volunteer datasets, of which an illustrative example is shown in Figure 4 (NRMSE of 21.1% vs. 12.2%, SSIM of 0.56 vs. 0.71). The comparison across all three volunteers is displayed in Figure 5.Discussion and Conclusion
In this work, the proposed FID-navigated 3D EPI sequence achieved submillimeter-resolution SWI. The addition of a short duration FIDnav module enabled estimation and correction of spatiotemporal field changes. This approach may also be used for T2* imaging or quantitative susceptibility mapping as it does not substantially increase TE [10]. Hence, FID-navigated 3D EPI provides a promising diagnostic tool for detecting the central vein sign for multiple sclerosis.Acknowledgements
Mustafa Utkur and Tess E Wallace contributed equally to this work. This work was supported in part by NIH grants R01 EB019483, R01 NS121657, R01 DK125561, R21 DK123569, R21 EB02962, S10 OD025111, and a pilot grant (PP-1905-34002) from the National Multiple Sclerosis Society.References
1. Haacke, E.M., Makki, M., Ge, Y., Maheshwari, M., Sehgal, V., Hu, J., Selvan, M., Wu, Z., Latif, Z., Xuan, Y., Khan, O., Garbern, J. and Grossman, R.I. (2009), Characterizing iron deposition in multiple sclerosis lesions using susceptibility weighted imaging. J. Magn. Reson. Imaging, 29: 537-544.
2. Liu, C., Li, W., Tong, K.A., Yeom, K.W. and Kuzminski, S. (2015), Susceptibility-weighted imaging and quantitative susceptibility mapping in the brain. J. Magn. Reson. Imaging, 42: 23-41.
3. Sati, P., Patil, S., Inati, S., Wang, W.T., Derbyshire, J.A., Krueger, G., Reich, D.S. and Butman, J.A., 2017. Rapid MR susceptibility imaging of the brain using segmented 3D echo-planar imaging (3D EPI) and its clinical applications. Magnetom Flash, 68, pp.26-32.
4. Solomon, A.J. and Weinshenker, B.G., 2013. Misdiagnosis of multiple sclerosis: frequency, causes, effects, and prevention. Current neurology and neuroscience reports, 13(12), pp.1-7.
5. Wallace, T.E., Afacan, O., Kober, T. and Warfield, S.K., 2020. Rapid measurement and correction of spatiotemporal B0 field changes using FID navigators and a multi‐channel reference image. Magnetic resonance in medicine, 83(2), pp.575-589.
6. Wallace, T.E., Kober T., Warfield S.K., and Afacan O., 2021. FID-navigated phase correction for multi-shot 3D EPI acquisitions. 29th ISMRM, Abstract No:3526.
7. Fessler, J., 2007. On NUFFT-based gridding for non-Cartesian MRI. J. Magn. Reson. Imaging, 188:191-195.
8. Haacke, E.M., Mittal, S., Wu, Z., Neelavalli, J. and Cheng, Y.C., 2009. Susceptibility-weighted imaging: technical aspects and clinical applications, part 1. American Journal of Neuroradiology, 30(1), pp.19-30.
9. Perandini, S., Faccioli, N., Zaccarella, A., Re, T., & Mucelli, R. P. (2010). The diagnostic contribution of CT volumetric rendering techniques in routine practice. The Indian journal of radiology & imaging, 20(2), 92–97.
10. Langkammer, C., Schweser, F., Krebs, N., Deistung, A., Goessler, W., Scheurer, E., Sommer, K., Reishofer, G., Yen, K., Fazekas, F., Ropele, S., & Reichenbach, J. R. (2012). Quantitative susceptibility mapping (QSM) as a means to measure brain iron? A post mortem validation study. NeuroImage, 62(3), 1593–1599.
Figures