1147
Noninvasive diagnosis of clinically significant portal hypertension with MR elastography, T1, and T1ρ mapping of the liver and spleen1Department of Diagnostic, Molecular and Interventional Radiology, Icahn School of Medicine at Mount Sinai, New York, NY, United States, 2BioMedical Engineering and Imaging Institute, Icahn School of Medicine at Mount Sinai, New York, NY, United States, 3Department of Pathology, Icahn School of Medicine at Mount Sinai, New York, NY, United States
Synopsis
Keywords: Liver, Quantitative Imaging, Portal Hypertension, Clinically Significant Portal Hypertension
In this prospective study, we explored the diagnostic value of MR elastography (MRE) as well as T1-pre and post-gadoxetate contrast at the hepatobiliary phase and T1ρ mapping of the liver and spleen for noninvasive diagnosis of clinically significant portal hypertension (CSPH) in patients with liver disease. 2D MRE liver (r=0.457, p<0.001) and spleen stiffness (r=0.438, p<0.001) showed a strong significant correlation with portal pressure measurement based on hepatic venous pressure gradient (HVPG). 2D MRE spleen stiffness outperformed other imaging parameters for prediction of CSPH [AUC = 0.867 (0.764-0.970)].
Introduction
Portal hypertension (PH) is defined as an elevated portal venous pressure gradient across the liver due to increased intra-hepatic vascular resistance and is a common complication of liver cirrhosis [1]. PH can vary in severity and is diagnosed via invasive hepatic venous pressure gradient (HVPG) measurement [2,3]. PH is defined by HVPG > 5 mmHg, and CSPH by HVPG ≥ 10 mmHg. Early detection of CSPH is particularly important as these patients are at higher risk for developing complications such as ascites, gastrointestinal bleeding, encephalopathy, hepatorenal syndrome, and death [4-6]. The goal of this study is to evaluate the diagnostic value of elastography, T1, and T1ρ mapping in patients with chronic liver disease.Methods
This prospective IRB approved study included 67 patients (M/F 35/32, mean age 52.5 y, range 19-79 y) with liver disease and suspicion of PH. All patients underwent abdominal MRI at 1.5T (Aera, Siemens) including MRE, T1ρ, and T1 mapping pre and post gadoxetate at the hepatobiliary phase (HBP) of the liver and spleen. Invasive HVPG measurements and transjugular liver biopsy were performed within 1 month of MRI. 2D MRE was performed using a SE-EPI sequence at 60 Hz with 10 axial slices, dual passive drivers enabling simultaneous liver and spleen acquisition [7] and an inline reconstruction [8]. 3D MRE was performed in 49/67 patients using a SE-EPI sequence over 32 axial slices. For T1 mapping, an IR Look-Locker protocol prospectively gated to the ECG waveform simulator on the scanner, with the simulator R-R interval set to 2000 msec, was used before and 20 minutes after injection of gadoxetate disodium (Eovist/Primovist, Bayer) using 10 ml. T1 maps were generated in MATLAB 2021 by fitting the signal to modified Look-Locker equation [9]. T1ρ maps were obtained by monoexponential fit of four images acquired mid-liver and mid-spleen, at 4 different spin lock times [10]. Association between liver/spleen stiffness for 2D/3D MRE, T1ρ, and T1 values with HVPG were assessed using Spearman correlation. The diagnostic performance of the assessed parameters for prediction of CSPH was determined by ROC analysis.Results
Mean HVPG measurement was 6.3±5.1 mmHg, and 13 patients were diagnosed with CSPH (19%). 2D MRE of the liver (r=0.457, p<0.001), 2D MRE of the spleen (r=0.438, p<0.001), and 3D MRE of the liver (r=0.441, p=0.001) showed the strongest correlations with HVPG compared to other parameters (Table 1). Except for spleen T1-pre, all imaging parameters were significantly elevated in patients with CSPH compared to those without CSPH (Table 2). For prediction of CSPH, the strongest diagnostic performance was observed with 2D MRE spleen stiffness (AUC = 0.867; Table 2, p<0.001; Figure 2). Representative T1 and T1ρ maps of patients with no PH, PH, and CSPH are shown in Figure 1. In a similar manner, in Figure 3, 2D and 3D MRE stiffness maps/elastograms are given for patients with no PH, PH, and CSPH.Discussion
In our study, we found that hemodynamic related changes in the liver and spleen affect their mechanical composition and can be diagnosed with MRE in a noninvasive manner. Even tough liver T1-HBP did not correlate with HVPG as well as the MRE parameters, its diagnostic performance was higher than the 3D MRE parameters (AUC 0.806; Table 2). This high AUC value can be an indication of the uptake related capability of the liver after 20 minutes from the intake of contrast agent. Wagner et al reported a correlation between 2D MRE liver stiffness and HVPG, which is a result replicated in this study too. Furthermore, Kennedy et al reported that 3D MRE spleen stiffness has excellent diagnostic performance for the diagnosis of CSPH. It should be pointed out that in the current study among all the imaging parameters, 3D MRE liver stiffness, 3D MRE spleen stiffness and liver T1-HBP (no CSPH=36, CSPH=9) had a smaller sample size which may have impacted results. Future work would investigate the diagnostic performance of these MRI parameters in combination with laboratory tests and clinical data for identifying CSPH, presence of esophageal varices and prediction of adverse outcomes in PH.Conclusion
2D MRE spleen stiffness is a promising biomarker of CSPH. Our results show that hemodynamic changes associated with PH can be diagnosed noninvasively through splenic stiffness measurement.Acknowledgements
This work was supported by funding from NIH grant R01DK113272.References
1. De Franchis, Roberto. "Expanding consensus in portal hypertension: Report of the Baveno VI Consensus Workshop: Stratifying risk and individualizing care for portal hypertension." Journal of hepatology 63.3 (2015): 743-752.
2. Escorsell, Angels, Joan Carles García-Pagán, and Jaume Bosch. "Assessment of portal hypertension in humans." Clinics in liver disease 5.3 (2001): 575-589.
3. Ripoll, Cristina, et al. "Hepatic venous pressure gradient predicts clinical decompensation in patients with compensated cirrhosis." Gastroenterology 133.2 (2007): 481-488.
4. Altinmakas, Emre, et al. "Performance of native and gadoxetate-enhanced liver and spleen T1 mapping for noninvasive diagnosis of clinically significant portal hypertension: preliminary results." Abdominal Radiology (2022): 1-12.
5. Kennedy, Paul, et al. "MR elastography outperforms shear wave elastography for the diagnosis of clinically significant portal hypertension." European Radiology (2022): 1-11.
6. Kennedy, Paul, et al. "Noninvasive imaging assessment of portal hypertension." Abdominal Radiology 45.11 (2020): 3473-3495.
7. Dyvorne, Hadrien A., et al. "Simultaneous measurement of hepatic and splenic stiffness using MR elastography: preliminary experience." Abdominal imaging 40.4 (2015): 803-809.
8. Dzyubak, Bogdan, et al. "Automated liver stiffness measurements with magnetic resonance elastography." Journal of Magnetic Resonance Imaging 38.2 (2013): 371-379.
9. Altinmakas, Emre, et al. "Performance of native and gadoxetate-enhanced liver and spleen T1 mapping for noninvasive diagnosis of clinically significant portal hypertension: preliminary results." Abdominal Radiology (2022): 1-12.
10. Hectors, Stefanie J., et al. "Splenic T1ρ as a noninvasive biomarker for portal hypertension." Journal of Magnetic Resonance Imaging 52.3 (2020): 787-794.
Figures
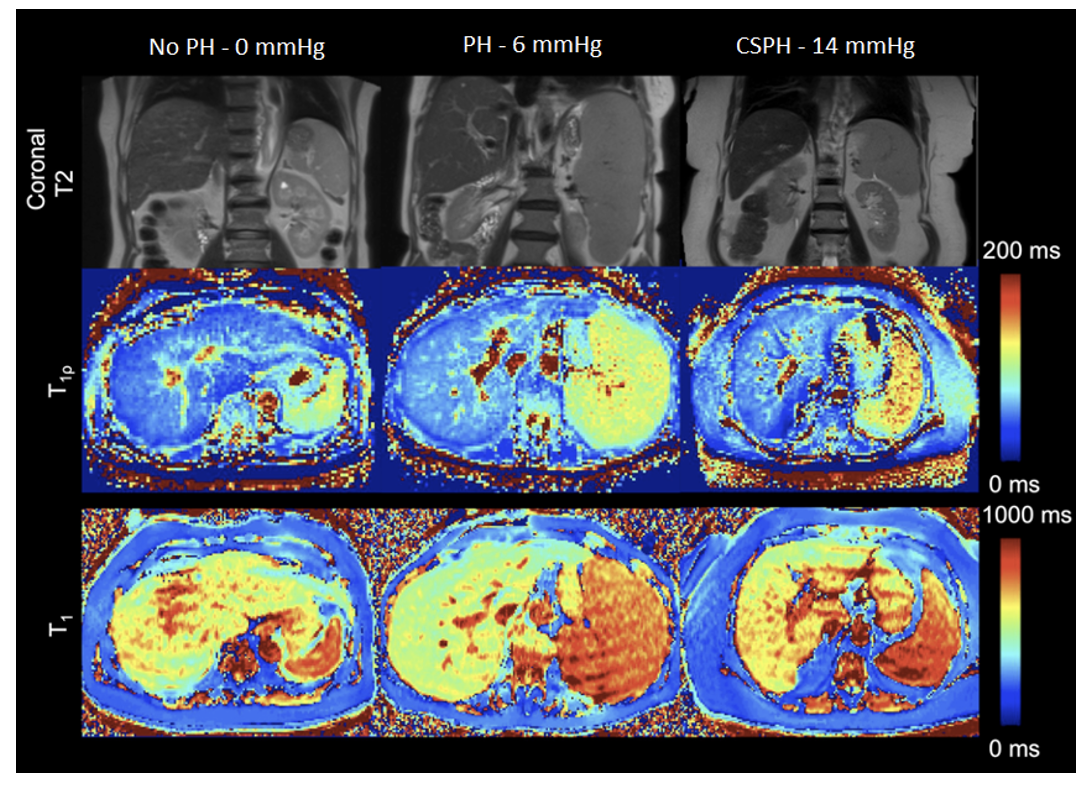
Figure 1: Coronal T2-weighted anatomical images (top row), T1ρ maps (middle row), and T1 maps (bottom row) of a 59-year-old male with no PH (left), a 78-year-old female with PH (middle), and 63-year-old male with CSPH (right). From left to right, measured values for liver T1 were 594.4, 540.9, 638.9 msec, for spleen T1 values were 774.2, 777.1, 833.3 msec. Spleen showed a clear T1ρ elevation with increased PH severity (from left to right: 99.0, 109.6, and 131,4 msec), while liver T1ρ values measured were 7.9, 55.7, 53.1 msec.
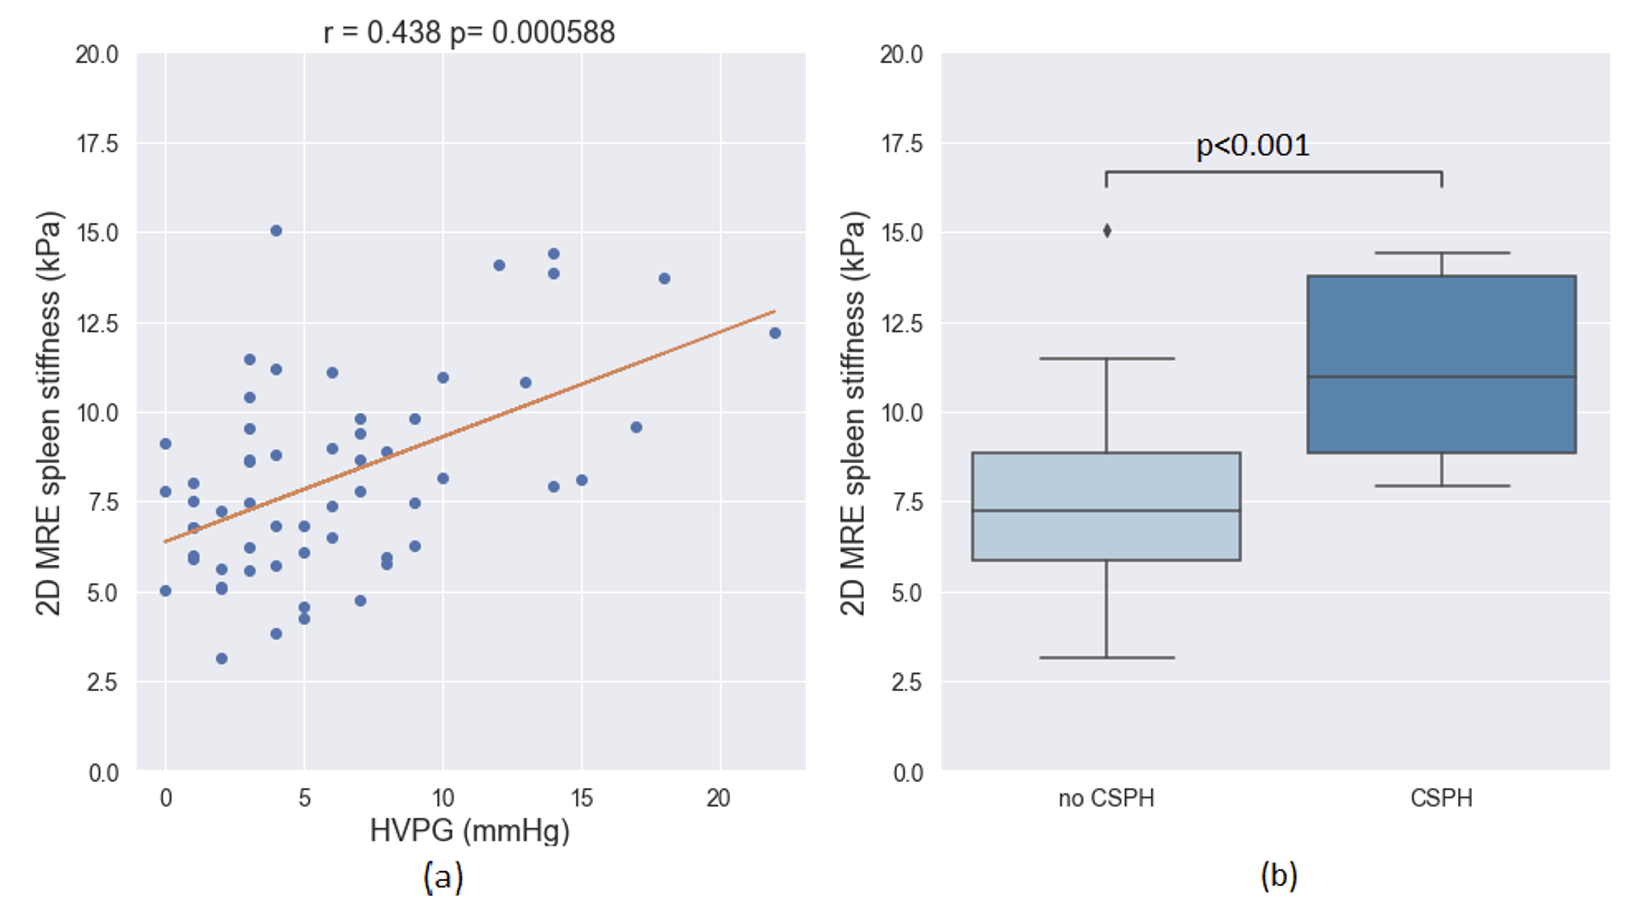
Figure 2: (a) Scatter plot showing the relationship between HVPG measurement and 2D MRE spleen stiffness. Solid line represents linear fit of the data. (b) Boxplot showing the ability of 2D MRE spleen stiffness to differentiate patients with no CSPH from those with CSPH (clinically significant portal hypertension, HVPG ≥ 10 mmHg).
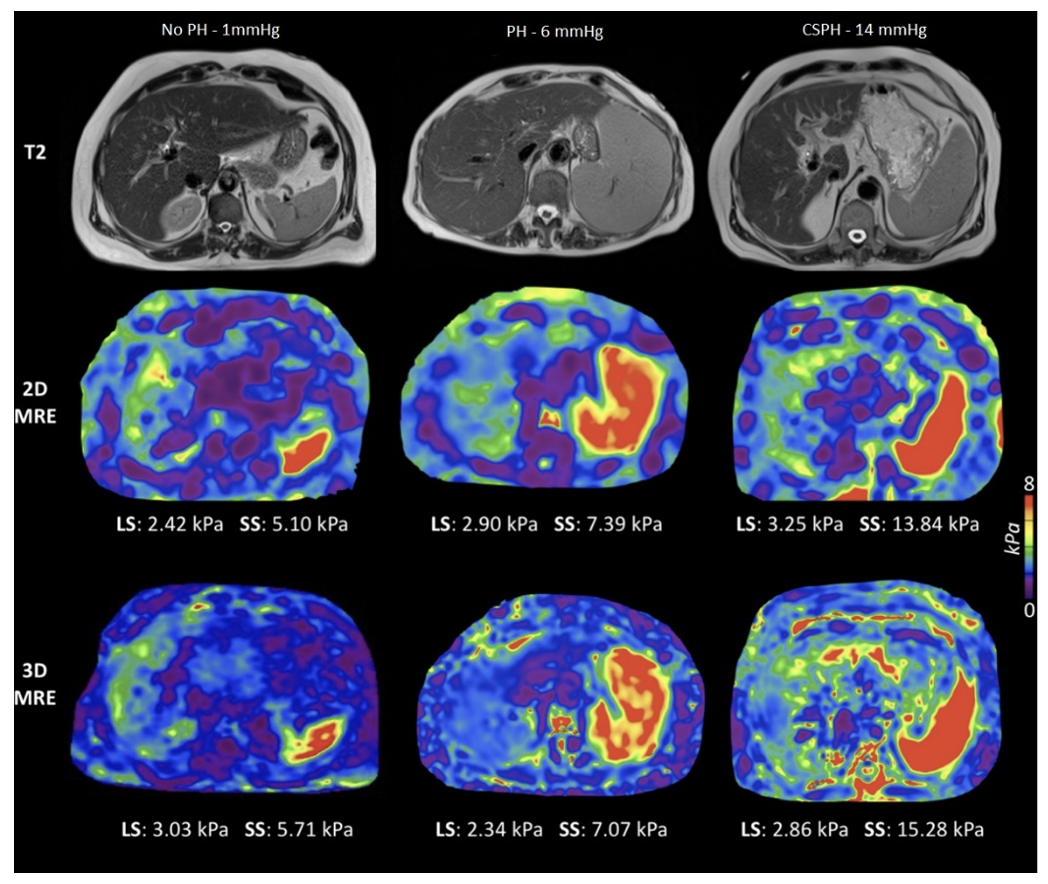
Figure 3: Axial T2-weighted anatomical images (top row), 2D MRE elastograms (middle row), and 3D MRE elastograms (bottom row) of a 60-year-old male with no PH (left), a 78-year-old female with PH (middle), and 65-year-old male with CSPH (right). HVPG, liver stiffness (LS), and spleen stiffness (SS) are also shown.
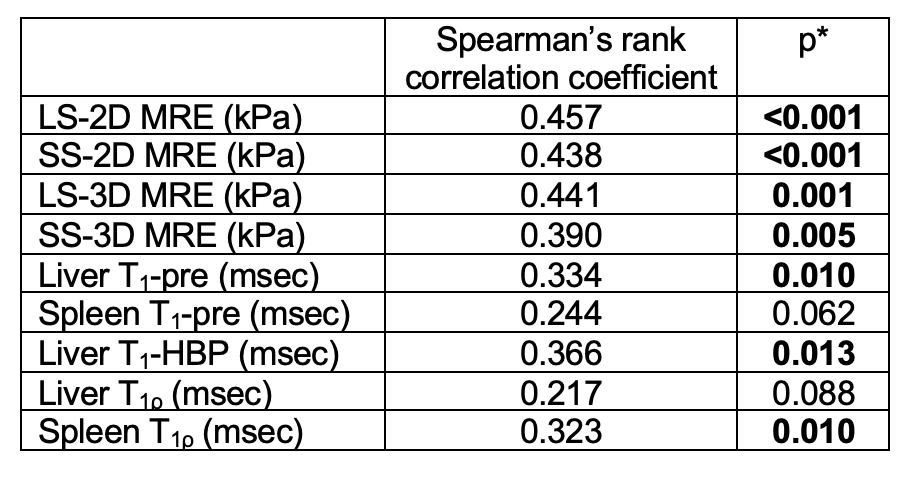
Table 1: Correlation between imaging parameters and hepatic venous pressure gradient (HVPG). LS, liver stiffness; SS, spleen stiffness; MRE, magnetic resonance elastography. *p values in boldface indicate significance.
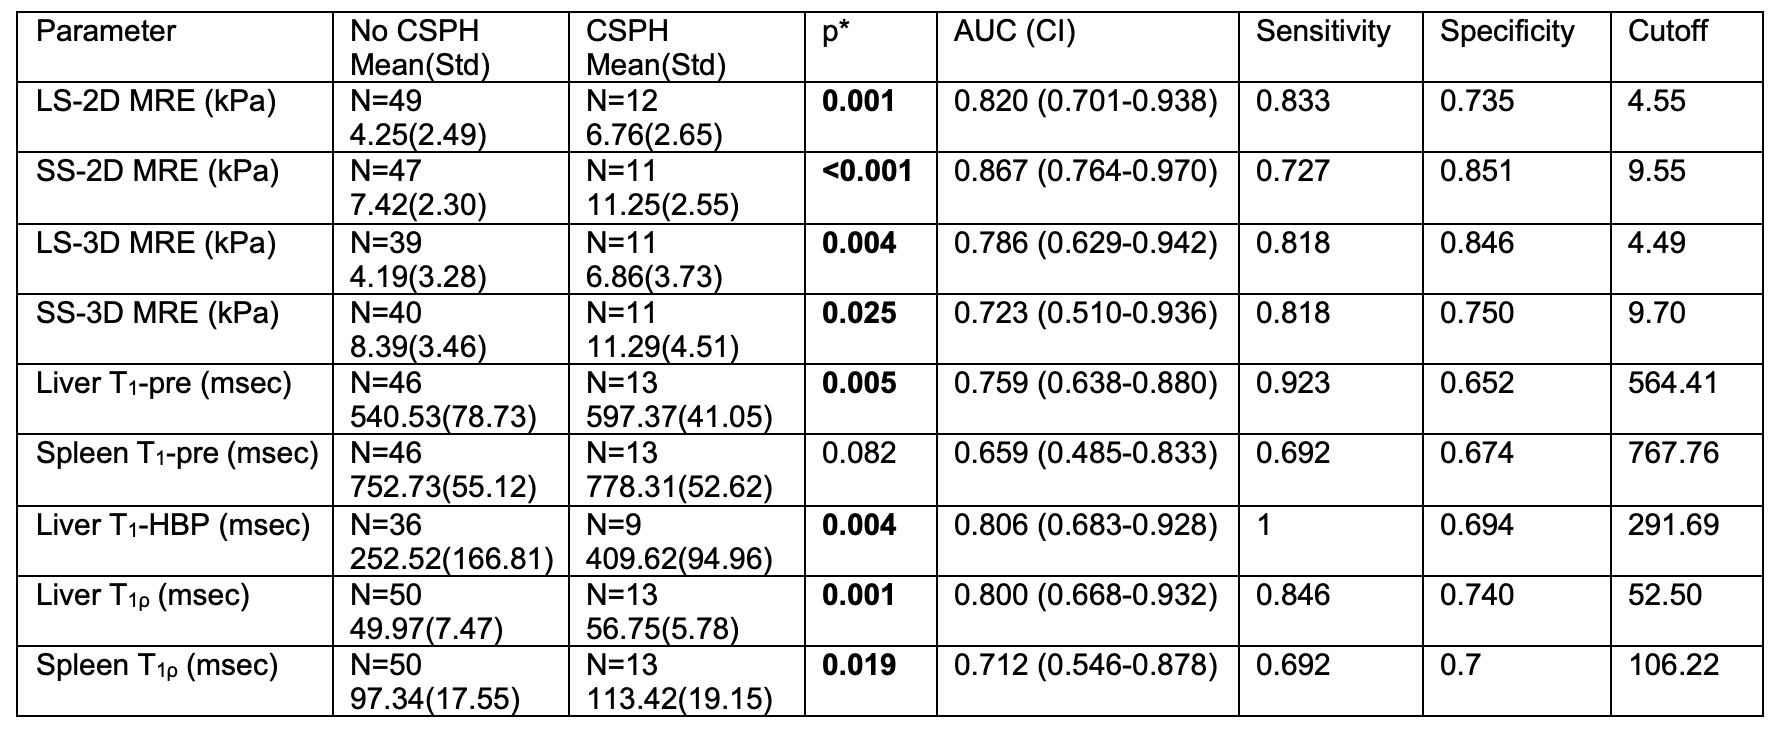
Table 2: ROC analysis of imaging parameters for the diagnosis of CSPH (clinically significant portal hypertension, HVPG ≥ 10 mmHg). AUC, are under the curve; CI, confidence interval; LS, liver stiffness; SS, spleen stiffness; MRE, magnetic resonance elastography. *p values derived from Mann-Whitney U-test in boldface indicate significance.