1143
Bilateral asymmetry of parenchymal kinetics from ultrafast DCE-MRI predicts HER2+ breast cancer response to neoadjuvant chemotherapy1Department of Radiology, The University of Chicago, Chicago, IL, United States, 2Department of Radiology, University of Pittsburgh, Pittsburgh, PA, United States, 3Department of Medicine - Section of Hematology/Oncology, The University of Chicago, Chicago, IL, United States, 4Department of Surgery, The University of Chicago, Chicago, IL, United States
Synopsis
Keywords: Breast, Cancer, HER2-positive breast cancer
We retrospectively reviewed data from 28 patients with HER2-positive breast cancer treated with neoadjuvant chemotherapy (NAC) who underwent a protocol that included ultrafast DCE-MRI (temporal resolution = 3 – 9 seconds) for the first minute after contrast administration prior to NAC. We measured quantitative kinetic background parenchymal enhancement parameters (kBPEs) from ipsi- and contra-lateral normal parenchyma separately to quantify bilateral parenchymal enhancement asymmetry. The results show that HER2-positive patients with similar pre-NAC $$$K^{trans}$$$ in ipsi-and contralateral normal parenchyma were more likely to achieve pathologic complete response post NAC.Introduction
Achieving a pathologic complete response (pCR) following neoadjuvant chemotherapy (NAC) is an important maker for improved long-term disease-free and overall survival1. Although HER2-positive breast cancers are considered good responders to NAC, the pCR rate is only 36%2. Accurate prediction of NAC treatment response may help doctors determine optimal treatment, lower the overall cost, and spare exposure to toxicity from unnecessary chemotherapy treatment. Many studies reported that perfusion parameters from ultrafast DCE-MRI, such as initial slope of enhancement in lesions and bolus arrival time in arteries and lesions, are strongly associated with breast cancer malignancy3,4. However, few studies investigated the role of ultrafast DCE-MRI predicting response to NAC5. In a pilot study6, we found that the bilateral difference between kinetic background normal parenchymal enhancement parameters (kBPEs) from semi-quantitative analysis of ultrafast DCE-MRI were significantly associated with pCR. In this study, we conducted with quantitative analysis to assess whether the bilateral asymmetry of kBPEs from the pre-NAC ultrafast DCE-MRI scan were associated with pCR in patients with HER2-positive breast cancer.Methods
Our IRB approved this retrospective study and waived written informed consent. Twenty-eight female patients (median age = 53 (25 – 71)) with histologically confirmed HER2-positive breast cancer who underwent ultrafast DCE-MRI (temporal resolution = 3 – 9 seconds) prior to NAC were enrolled. After completion of NAC, 12 patients achieved pCR and 16 had residual disease. In addition to the patients with HER2-positive cancer, we included 11 screening patients who underwent ultrafast DCE-MRI (temporal resolution =3.5 seconds) as the control cases. Data analysis was performed with an in-house MATLAB platform and 3D Slicer7 (http://www.slicer.org). Ultrafast images were motion corrected by a non-rigid registration method8. Semi-automatic volumetric segmentation was performed with 3D Slicer using the first pre-contrast ultrafast image. The segmentation process was detailed by Ren et.al6. A digital filter was applied to select top 10% most enhancing voxels in each of the ipsi- and contralateral normal parenchyma.The concentration of contrast media of each parenchymal voxel was calculated from the change of signal intensity based on the spoiled gradient-echo signal model.
$$C(t) = \frac{1}{r_1}\cdot(\frac{-1}{TR}\cdot\ln(\frac{1-A}{1-\cos(FA)\cdot A})-\frac{1}{T_{10}})\quad (1) $$
where $$$A=\frac{1-e^{-\frac{TR}{T_{10}}}}{1-\cos(FA)\cdot e^{-\frac{TR}{T_{10}}}}\cdot\frac{S(t)}{S(0)}$$$, $$$S(t)$$$ and $$$S(0)$$$ are the signal intensity across time t and pre-contrast signal intensity, respectively; $$$r_1=4.5 $$$ mMol-1s-1 is the relaxivity9; $$$T_{10}(lesion)=1.445$$$ s10 and $$$T_{10}(blood)=1.544$$$ s11; $$$FA=10^{\circ}$$$, $$$TR=2.8$$$ ms.
Changes of $$$C(t)$$$ following contrast injection can be described by standard Tofts model12.
$$C(t)=K^{trans}\int_{0}^{t}C_p(\tau)e^{-\frac{K^{trans}}{v_e}\cdot(t-\tau)}d\tau \quad (2)$$
where $$$K^{trans}$$$ refers to the transfer constant and is the extravascular extracellular space fractional volume, $$$C_p(t)=\frac{C_b(t)}{1-Hct}$$$ is the arterial input function, $$$C_b(t)$$$ is contrast concentration in blood, and $$$Hct=0.42$$$ is the hematocrit.
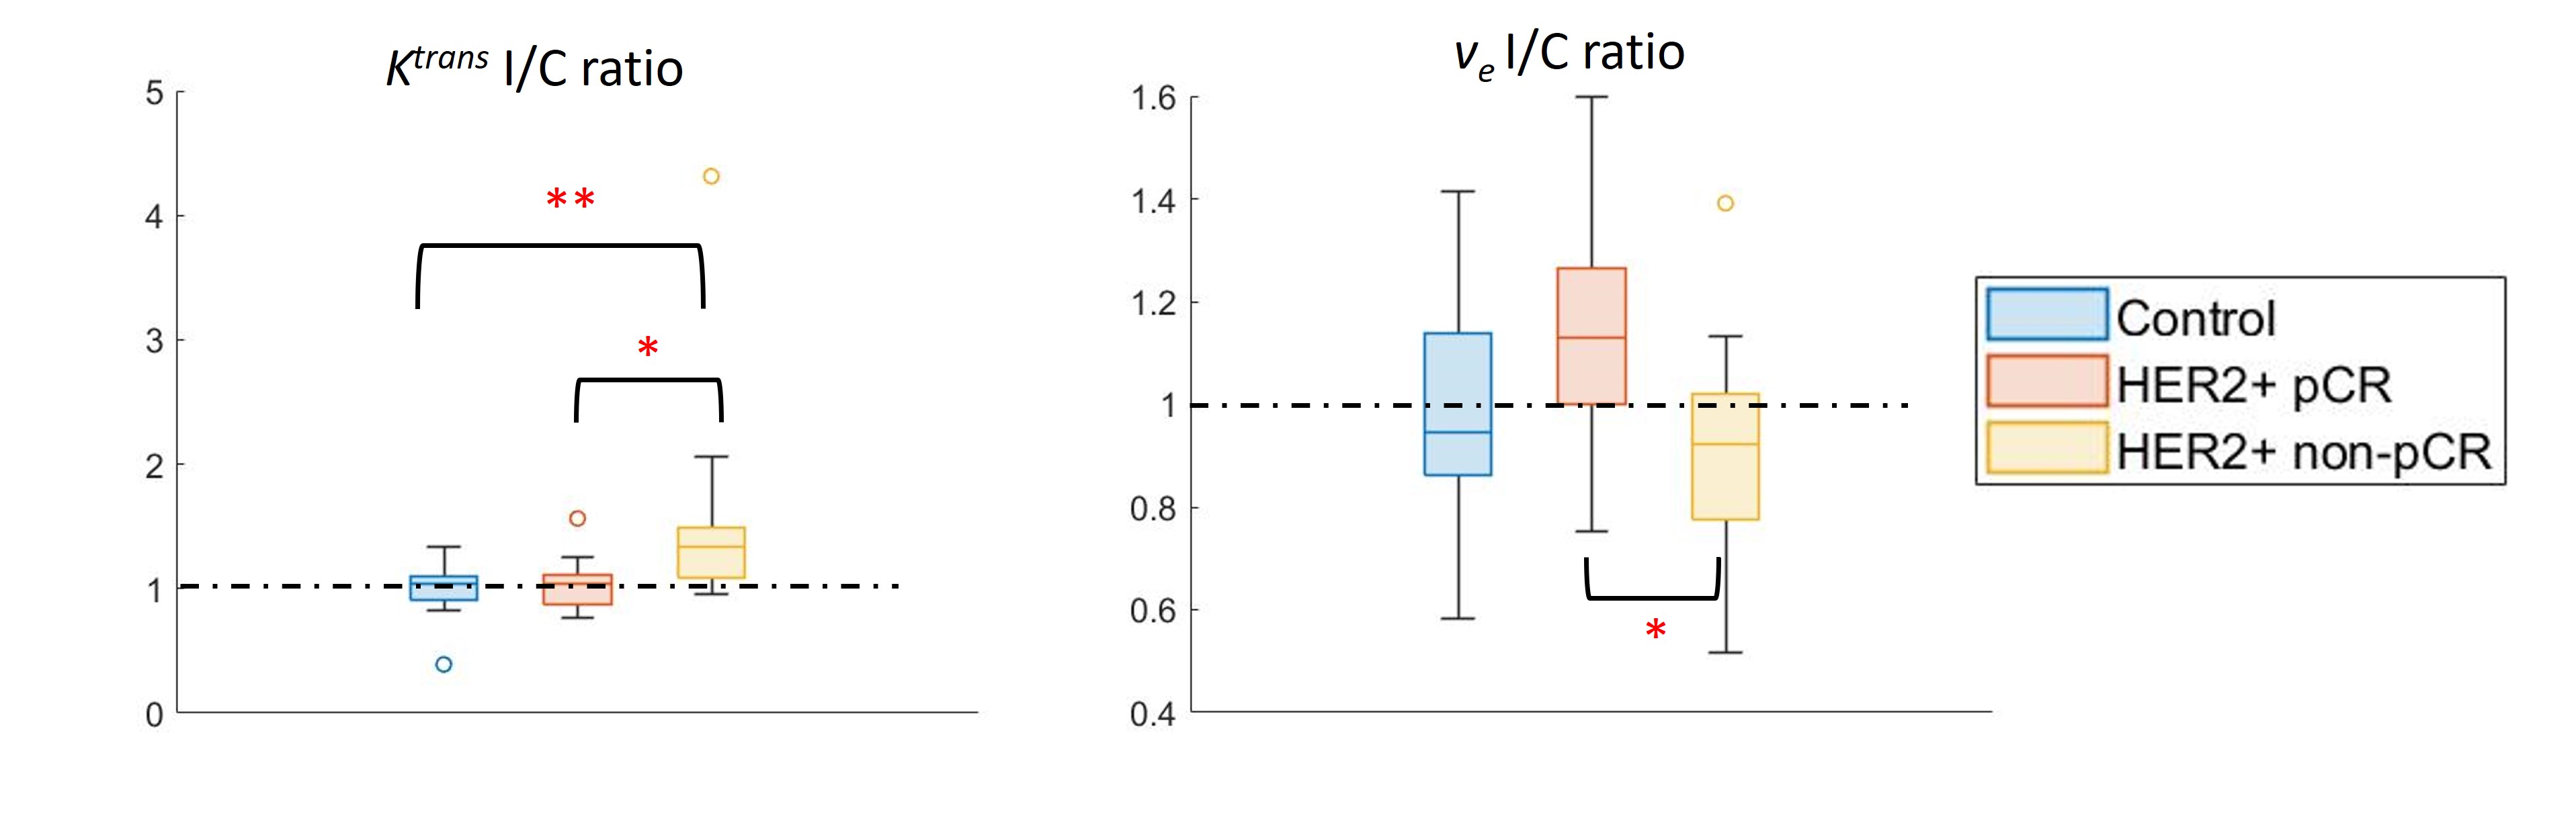
To quantify the bilateral asymmetry in parenchymal enhancement, we calculated the I/C ratio of kBPE ($$$K^{trans}$$$ and $$$v_e$$$), which was defined as the ratio of the averaged kBPE in ipsilateral normal parenchyma and the average in contralateral parenchymal. For the control cases, the ‘ipsilateral’ breast was randomly selected from the left or right breast.
The Wilcoxon rank sum test was used to compare kBPEs between pCR and all residual disease (non-pCR). We calculated odds ratios (ORs) with 95% confidence intervals (CIs) and p values for each kBPE. The area under the receiver operating characteristic curves were calculated, and optimal cutoff values to identify pCR were derived using the Youden index. Multivariable logistic regression was performed using the kBPEs. All statistical tests were two sided, and a value of p< .05 was considered statistically significant.
Results
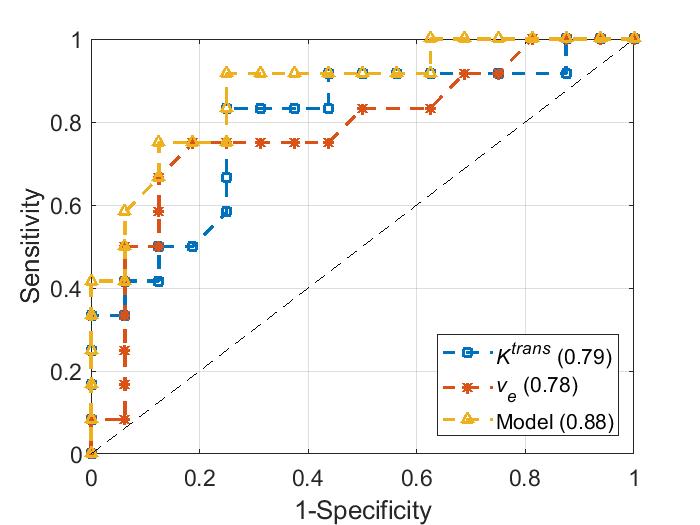
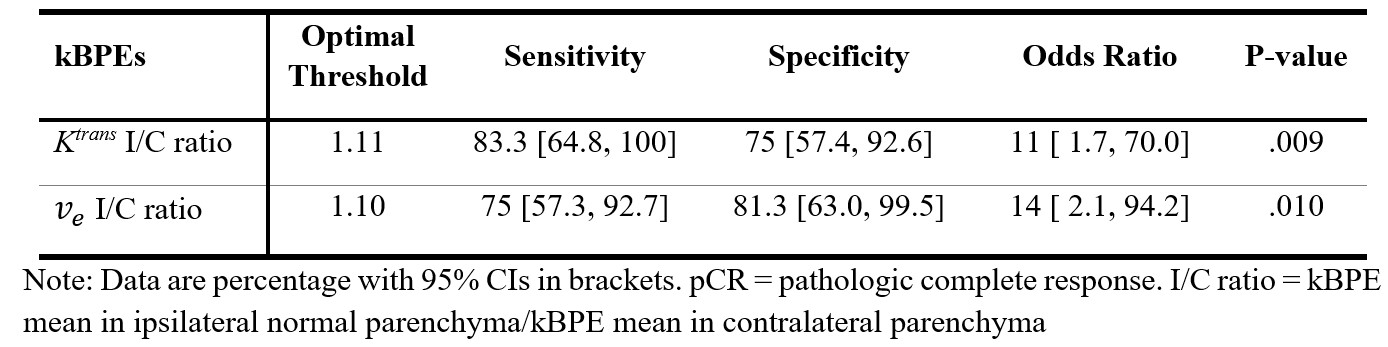
Figure 1 compares the I/C ratios of kBPEs of the control group to those of pCR and non-pCR groups. The pCR group showed small difference of $$$K^{trans}$$$ between two breasts, which was close to the trend observed in the control group (p = .88). The non-pCR group showed greater $$$K^{trans}$$$ in the ipsilateral than contralateral breast, which was significantly different from the trend showing in the control group and pCR group (p < .01). The pCR group showed significantly different $$$v_e$$$ I/C ratio from the non-pCR group (p = .01). Table 1 summarizes the optimum threshold, diagnostic performance and univariable ORs of the two kBPEs used to predict pCR. I/C ratio of $$$K^{trans}$$$ more than 1.11 and I/C ratio of $$$v_e$$$ less than 1.10 were associated with pCR. The area under the receiver operating characteristic curve of the two-kBPE model was 0.88 with sensitivity of 91.7% [95% CI: 72.2, 100] and specificity of 75% [95% CI: 57.4.0, 92.6] (Figure 2).Discussion
The results show that aggressive cancers significantly affect perfusion in the ipsilateral normal parenchyma. Increased signal enhancement in ipsilateral normal parenchyma that is associated with elevated blood supply and early uptake of contrast media in ipsilateral breast can be reliably detected by ultrafast DCE-MRI combined with the quantitative analysis and may be used as a marker of angiogenesis. We took the ratio of the ipsi-to contra-lateral kBPEs to correct for physiologic variations and increase diagnostic effectiveness. More rapid enhancement in ipsilateral normal parenchyma indicates stronger angiogenic signaling, and a more aggressive cancer that requires more aggressive therapy.Conclusion
High asymmetry of kBPE between ipsi- and contra-lateral normal parenchyma predicts poor response to NAC in patients with HER2-positive breast cancer and suggests that more aggressive therapy is needed.Acknowledgements
This study is supported in part by the National Cancer Institute of the National Institutes of Health through grants U01 CA142565, R01 CA172801, 1U24 CA226110, 1F32 CA265232, the Segal Family Foundation, the University of Chicago Cancer Center, and Cancer Prevention and Research Institute of Texas CPRIT RP160005. We also thank Dr. Olufunmilayo Olopade and the SPORE grant 5P20 CA233307-02.References
1. Earl H, Provenzano E, Abraham J, et al. Neoadjuvant trials in early breast cancer: pathological response at surgery and correlation to longer term outcomes - what does it all mean? BMC Med. Sep 2015;13:234. doi:10.1186/s12916-015-0472-7
2. Spring LM, Fell G, Arfe A, et al. Pathologic Complete Response after Neoadjuvant Chemotherapy and Impact on Breast Cancer Recurrence and Survival: A Comprehensive Meta-analysis. Clin Cancer Res. 06 2020;26(12):2838-2848. doi:10.1158/1078-0432.CCR-19-3492
3. Pineda FD, Medved M, Wang S, et al. Ultrafast Bilateral DCE-MRI of the Breast with Conventional Fourier Sampling: Preliminary Evaluation of Semi-quantitative Analysis. Acad Radiol. 09 2016;23(9):1137-44. doi:10.1016/j.acra.2016.04.008
4. Abe H, Mori N, Tsuchiya K, et al. Kinetic Analysis of Benign and Malignant Breast Lesions With Ultrafast Dynamic Contrast-Enhanced MRI: Comparison With Standard Kinetic Assessment. AJR Am J Roentgenol. Nov 2016;207(5):1159-1166. doi:10.2214/AJR.15.15957
5. Ramtohul T, Tescher C, Vaflard P, et al. Prospective Evaluation of Ultrafast Breast MRI for Predicting Pathologic Response after Neoadjuvant Therapies. Radiology. Jul 26 2022:220389. doi:10.1148/radiol.220389
6. Ren Z, Pineda FD, Howard FM, et al. Differences Between Ipsilateral and Contralateral Early Parenchymal Enhancement Kinetics Predict Response of Breast Cancer to Neoadjuvant Therapy. Acad Radiol. Mar 26 2022;doi:10.1016/j.acra.2022.02.008
7. Fedorov A, Beichel R, Kalpathy-Cramer J, et al. 3D Slicer as an image computing platform for the Quantitative Imaging Network. Magn Reson Imaging. Nov 2012;30(9):1323-41. doi:10.1016/j.mri.2012.05.001
8. Vercauteren T, Pennec X, Perchant A, Ayache N. Diffeomorphic demons: efficient non-parametric image registration. Neuroimage. Mar 2009;45(1 Suppl):S61-72. doi:10.1016/j.neuroimage.2008.10.040
9. Shen Y, Goerner FL, Snyder C, et al. T1 relaxivities of gadolinium-based magnetic resonance contrast agents in human whole blood at 1.5, 3, and 7 T. Invest Radiol. May 2015;50(5):330-8. doi:10.1097/RLI.0000000000000132
10. Rakow-Penner R, Daniel B, Yu H, Sawyer-Glover A, Glover GH. Relaxation times of breast tissue at 1.5T and 3T measured using IDEAL. J Magn Reson Imaging. Jan 2006;23(1):87-91. doi:10.1002/jmri.20469
11. Lu H, Clingman C, Golay X, van Zijl PC. Determining the longitudinal relaxation time (T1) of blood at 3.0 Tesla. Magn Reson Med. Sep 2004;52(3):679-82. doi:10.1002/mrm.20178
12. Tofts PS, Brix G, Buckley DL, et al. Estimating kinetic parameters from dynamic contrast-enhanced T(1)-weighted MRI of a diffusable tracer: standardized quantities and symbols. J Magn Reson Imaging. Sep 1999;10(3):223-32. doi:10.1002/(sici)1522-2586(199909)10:3<223::aid-jmri2>3.0.co;2-s
Figures