1142
T1 and T2 Mapping Using Highly Sparse Unsuppressed Water Signals from MRSI Scans with Generalized Series-Assisted Low-Rank Tensor Modelling1Beckman Institute for Advanced Science and Technology, University of Illinois at Urbana-Champaign, Urbana, IL, United States, 2National Center for Supercomputing Applications, University of Illinois at Urbana-Champaign, Urbana, IL, United States, 3Siemens Medical Solutions, Urbana, IL, United States, 4Department of Electrical and Computer Engineering, University of Illinois at Urbana-Champaign, Urbana, IL, United States, 5Radiology, Harvard Medical School, Boston, MA, United States, 6Radiology, Massachusetts General Hospital, Boston, MA, United States, 7School of Biomedical Engineering, Shanghai Jiao Tong University, Shanghai, China, 8Department of Bioengineering, University of Illinois at Urbana-Champaign, Urbana, IL, United States, 9Carle Illinois College of Medicine, University of Illinois at Urbana-Champaign, Urbana, IL, United States
Synopsis
Keywords: Quantitative Imaging, Quantitative Imaging
MR spectroscopic imaging (MRSI) without water suppression provides a unique opportunity to use the unsuppressed water spectroscopic signals for T1 and T2 mapping. This work presents a new image reconstruction method for reconstructing the T1/T2 maps from the highly sparse MRSI data. This method uses a novel generalized series-assisted low-rank tensor model to absorb the high-quality reference MRSI images to constrain the spatial-spectral-parametric variations. Experimental results demonstrated very encouraging reconstruction performance.Introduction
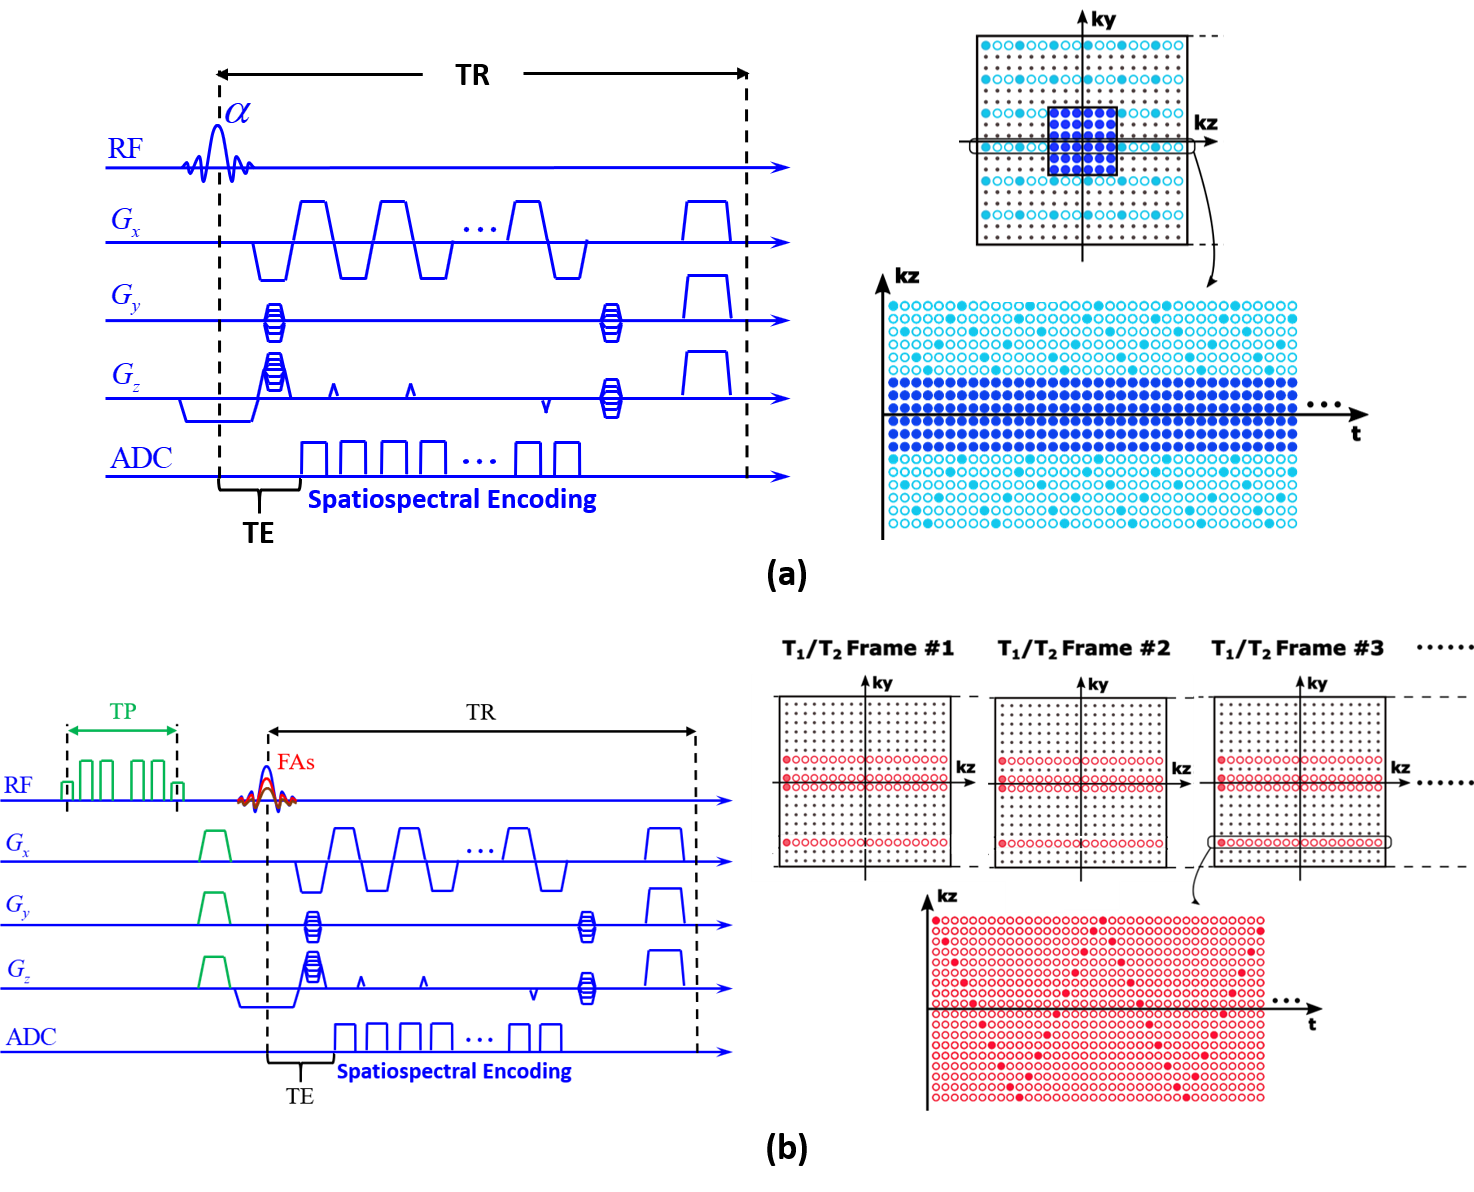
MR spectroscopic imaging (MRSI) and quantitative parametric mapping are common imaging tools that provide complementary insights into tissue properties and disease changes1,2. In practice, these two imaging modalities are performed using different sequences, leading to prohibitively long scan time (> 30 min). Recently, an emerging MRSI technique called SPICE has demonstrated a unique capability of simultaneous acquisition of tissue metabolites and relaxation parameters3. As shown in Fig. 1, in addition to the backbone non-water-suppressed MRSI data for metabolic imaging4-8, SPICE acquires a series of additional data frames with varying flip angles and T2 preparation pulses for T1/T2 mapping3. These auxiliary data sample the $$$(\boldsymbol{k},t)$$$-space very sparsely (with an acceleration factor of 388), thereby only adding a tiny amount of scan time (1 min). However, the extreme sparse sampling poses great challenge for image reconstruction. This work addresses this problem using a model-based approach. A novel generalized series (GS)-assisted low-rank tensor model is proposed to effectively incorporate the spectral and spatial priors in the metabolic imaging signals, enabling high-quality T1/T2 reconstruction from highly sparse data. The proposed method has been evaluated using both simulated and experimental data, producing impressive results.Methods
Problem FormulationThe specific image reconstruction problem addressed here can be formulated as follows:
$$\hspace{10em}\text{Given }d(\boldsymbol{k},t,T)=\int\rho(\boldsymbol{x},t,T)e^{-i2\pi\boldsymbol{k}\boldsymbol{x}}d\boldsymbol{x}+\xi(\boldsymbol{k},t,T)\text{ and }\rho_{\text{ref}}(\boldsymbol{x},t),\\{\hspace{15em}}\text{determine }\rho(\boldsymbol{x},t,T).\hspace{23em}(1)$$
In Eq. (1), $$$\rho(\boldsymbol{x},t,T)$$$ denotes the desired image function of spatial ($$$\boldsymbol{x}$$$), spectroscopic ($$$t$$$), and parametric ($$$T$$$) variations, $$$d(\boldsymbol{k},t,T)$$$ the acquired T1/T2 imaging data, $$$\xi(\boldsymbol{k},t,T)$$$ the measurement noise, and $$$\rho_{\text{ref}}(\boldsymbol{x},t)$$$ the reference MRSI signal reconstructed from the companion metabolic imaging data. Note the parametric variations along $$$T$$$ account for the signal changes due to different flip angles and T2 preparation pulses.
In this work, $$$d(\boldsymbol{k},t,T)$$$ samples the $$$(\boldsymbol{k},t)$$$-space very sparsely (Fig. 1b); so the inverse problem in Eq. (1) is highly under-determined. We solve this problem using a constrained signal model that effectively incorporates the spatiospectral priors in $$$\rho_{\text{ref}}(\boldsymbol{x},t)$$$.
GS-Assisted Low-Rank Tensor Model
In this work, we express $$$\rho(\boldsymbol{x},t,T)$$$ as the following low-rank tensor:
$$\hspace{-5em}\rho(\boldsymbol{x},t,T)=\rho(\boldsymbol{x},T)\rho_{\text{ref}}(\boldsymbol{x},t)\\{\hspace{2.3em}}=\sum_{q=1}^{Q}a_{q}(\boldsymbol{x})\phi_{q}(T)\rho_{\text{ref}}(\boldsymbol{x},t)\\{\hspace{15.5em}}\text{subject to }\|a_{q}(\boldsymbol{x})-\sum_{n}c_{n}e^{i2\pi{n}\Delta{\boldsymbol{k}}{\boldsymbol{x}}}\rho_{\text{ref}}(\boldsymbol{x},0)\|_2^2\leq\delta^2.\hspace{9em}(2)$$
This signal model has several key innovative features. First, it represents the temporal-parametric variations as a rank-1 subspace: $$$\rho(\boldsymbol{x},t,T)=\rho(\boldsymbol{x},t)\rho_{\text{ref}}(\boldsymbol{x},t)$$$. This is based on the fact that the spectroscopic signals collected at different $$$T$$$ share the same acquisition sequence as $$$\rho_{\text{ref}}(\boldsymbol{x},t)$$$ except for different flip angles and T2 preparation times; as a result, they have the same evolution pattern along $$$t$$$ except for T1/T2-weighting. Second, the proposed model expresses the spatial-parametric variations as a rank-$$$Q$$$ subspace: $$$\rho(\boldsymbol{x},T)=\sum_{q=1}^{Q}a_{q}(\boldsymbol{x})\phi_{q}(T)$$$. This exploits the fact that $$$\{\rho(\boldsymbol{x},T)\}$$$ for different voxels, viewed as functions of $$$T$$$, are strongly correlated such that their distributions can be captured by a low-dimensional subspace. Finally, the spatial coefficient, $$$a_{q}(\boldsymbol{x})$$$, is enforced to be well approximated by a GS model: $$$\sum_{n}c_{n}e^{i2\pi{n}\Delta{\boldsymbol{k}}{\boldsymbol{x}}}\rho_{\text{ref}}(\boldsymbol{x},0)$$$.9 This GS model absorbs $$$\rho_{\text{ref}}(\boldsymbol{x},0)$$$ into the spatial basis functions to effectively constrain the spatial variations.
As compared to the conventional Fourier series model, the proposed low-rank tensor model has two orders of magnitude fewer parameters (1.9×10⁶ vs. 2.8×10⁸), thereby enabling high-quality image reconstruction from highly sparse data. The GS model further imposes spatial a priori constraints, providing additional performance improvement.
Constrained Image Reconstruction
With the proposed image model, image reconstruction was done by solving the following constrained optimization problem:
$$\hspace{13em}\hat{a},\hat{c}=\arg\min_{a,c}=\|d-\Omega{F}S(\Phi{a}\otimes\rho_{\text{ref}})\|_2^2+\lambda\|a-Gc\|_2^2,\hspace{9em}(3)$$
where $$$d,a,c,\rho_{\text{ref}}$$$ are the vector forms of the measured data, $$$\{a_{q}(\boldsymbol{x})\}$$$, $$$\{c_{n}\}$$$, and $$$\rho_{\text{ref}}(\boldsymbol{x},t)$$$, respectively; $$$\Omega,F,S,\Phi,G$$$ are the operators associated with $$$(\boldsymbol{k},t)$$$-space sampling, Fourier transform, sensitivity encoding, parametric basis functions, and GS model. After $$$\hat{a}$$$ was determined, the reconstructed signal $$$\hat{\rho}(\boldsymbol{x},t,T)$$$ was synthesized using Eq. (2), and T1/T2 maps were then estimated by fitting the relaxation models.
Results
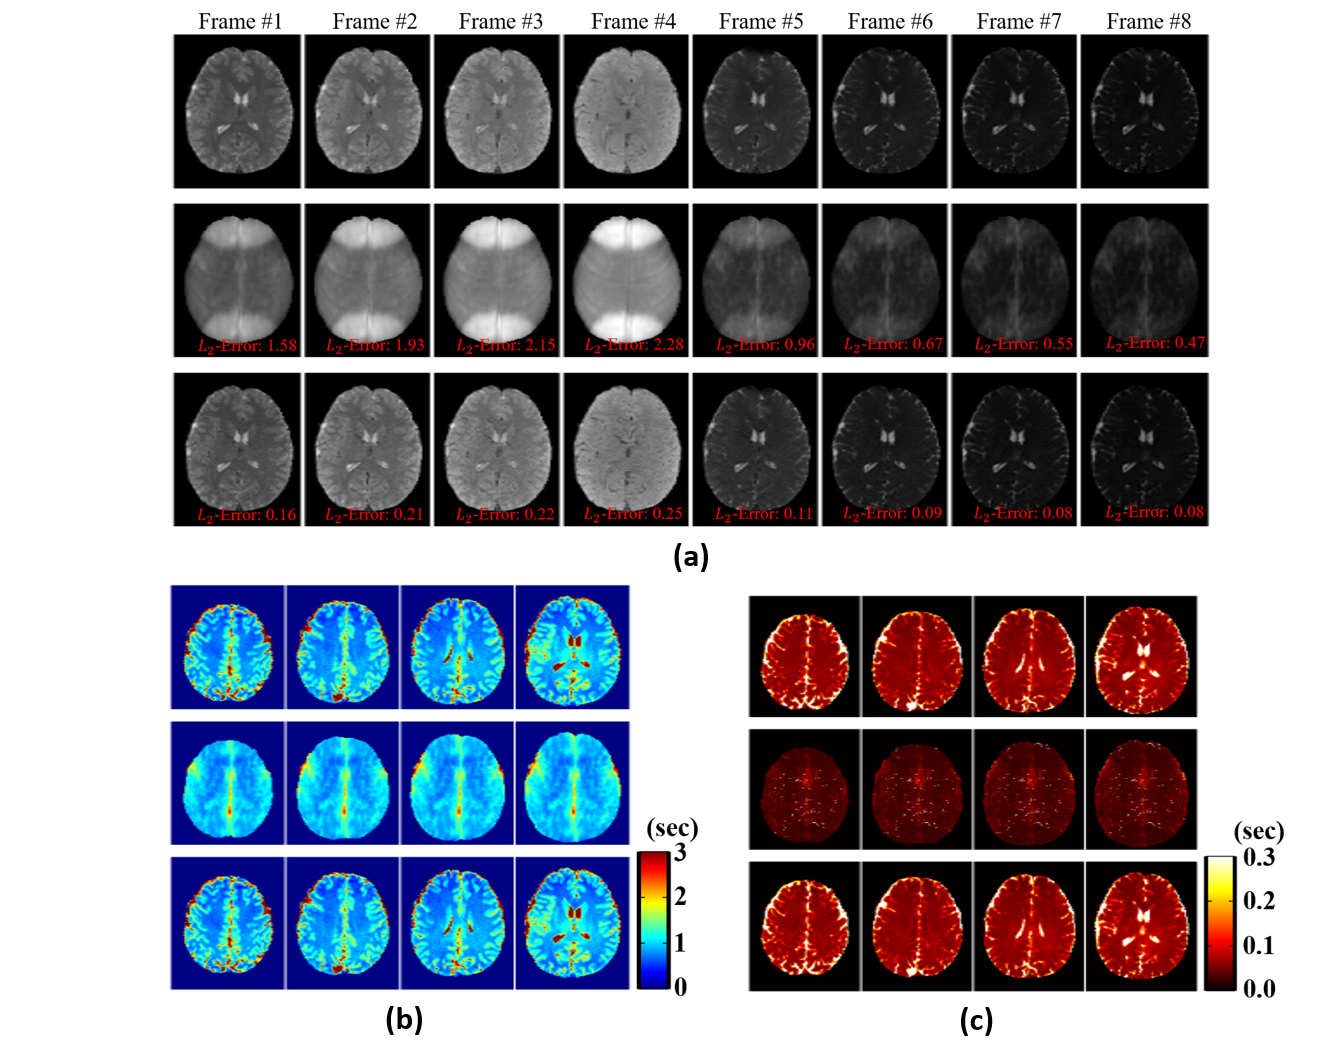
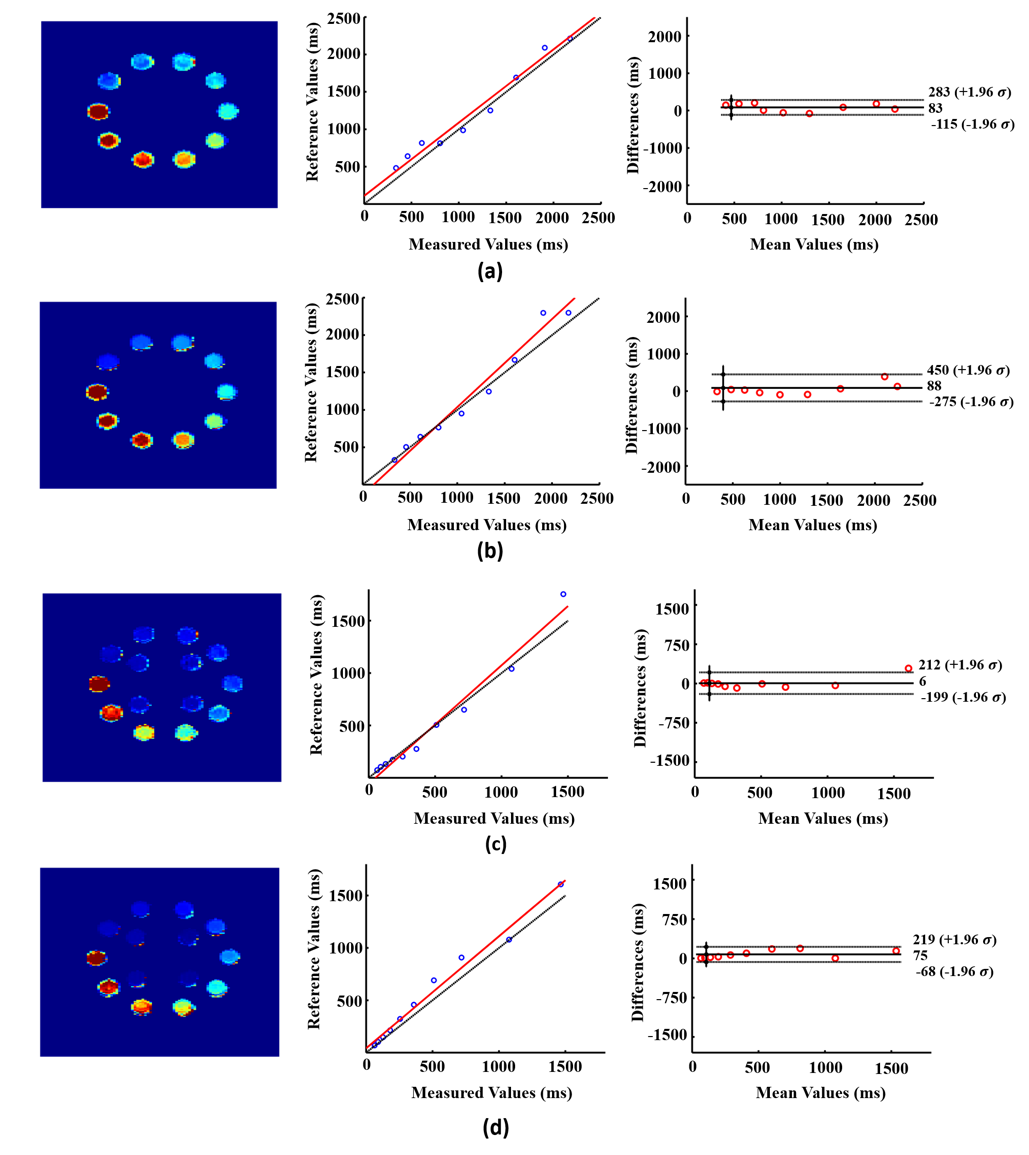
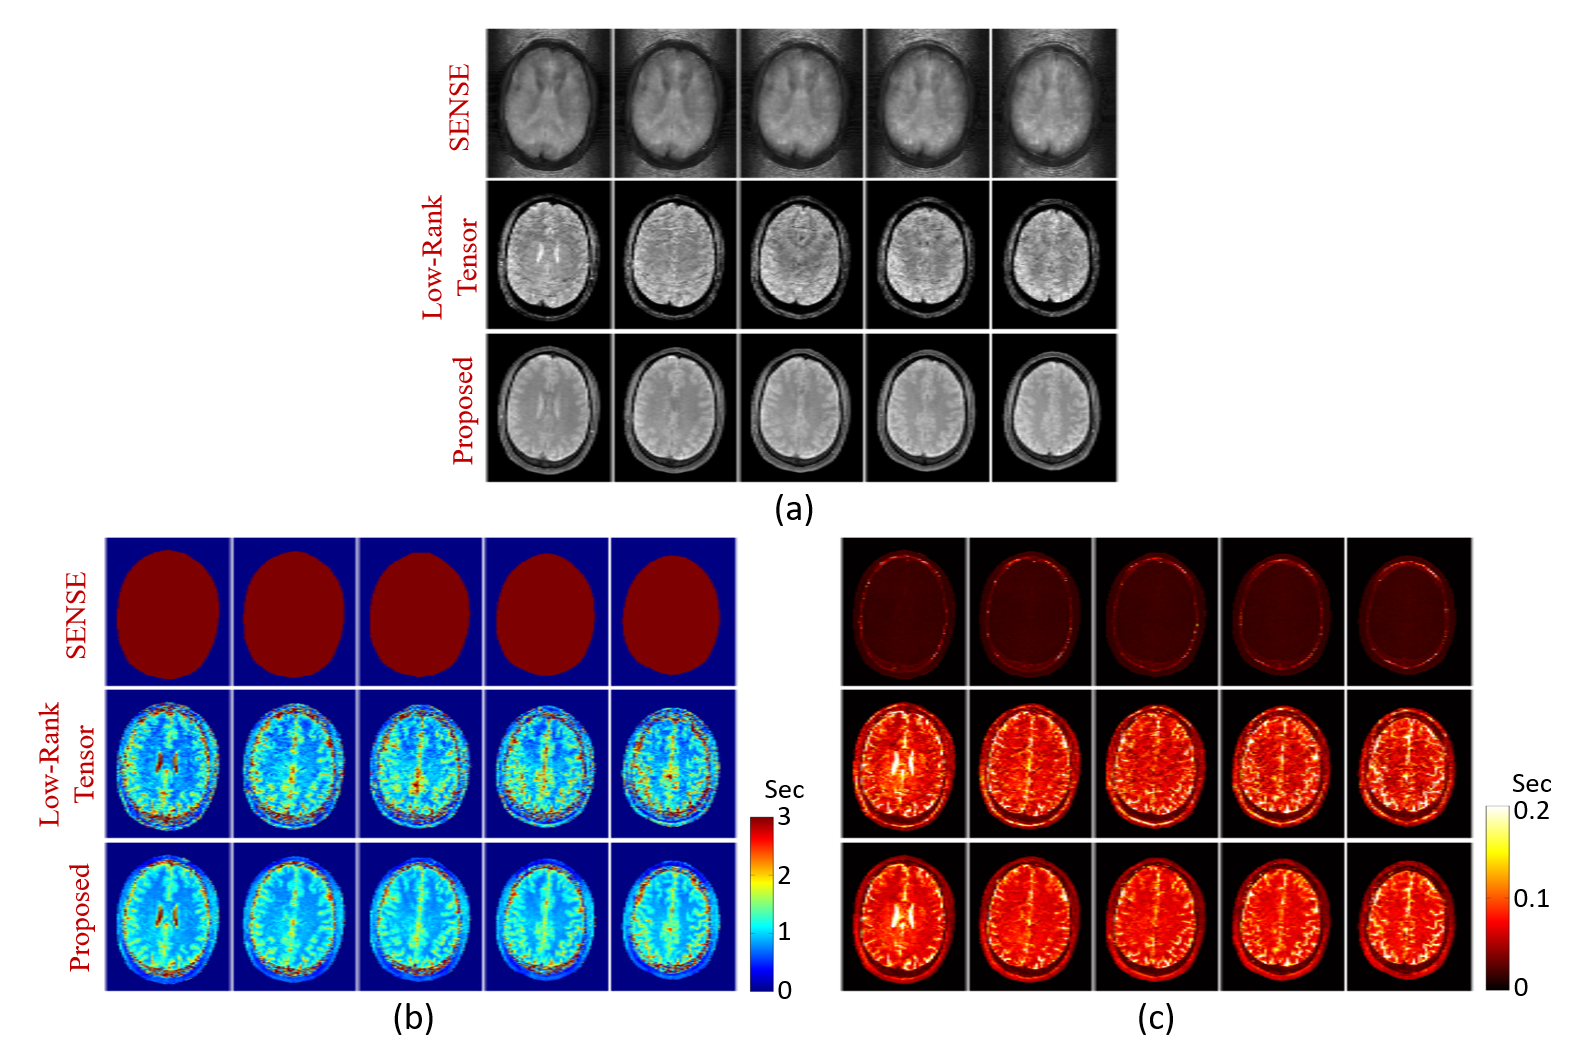
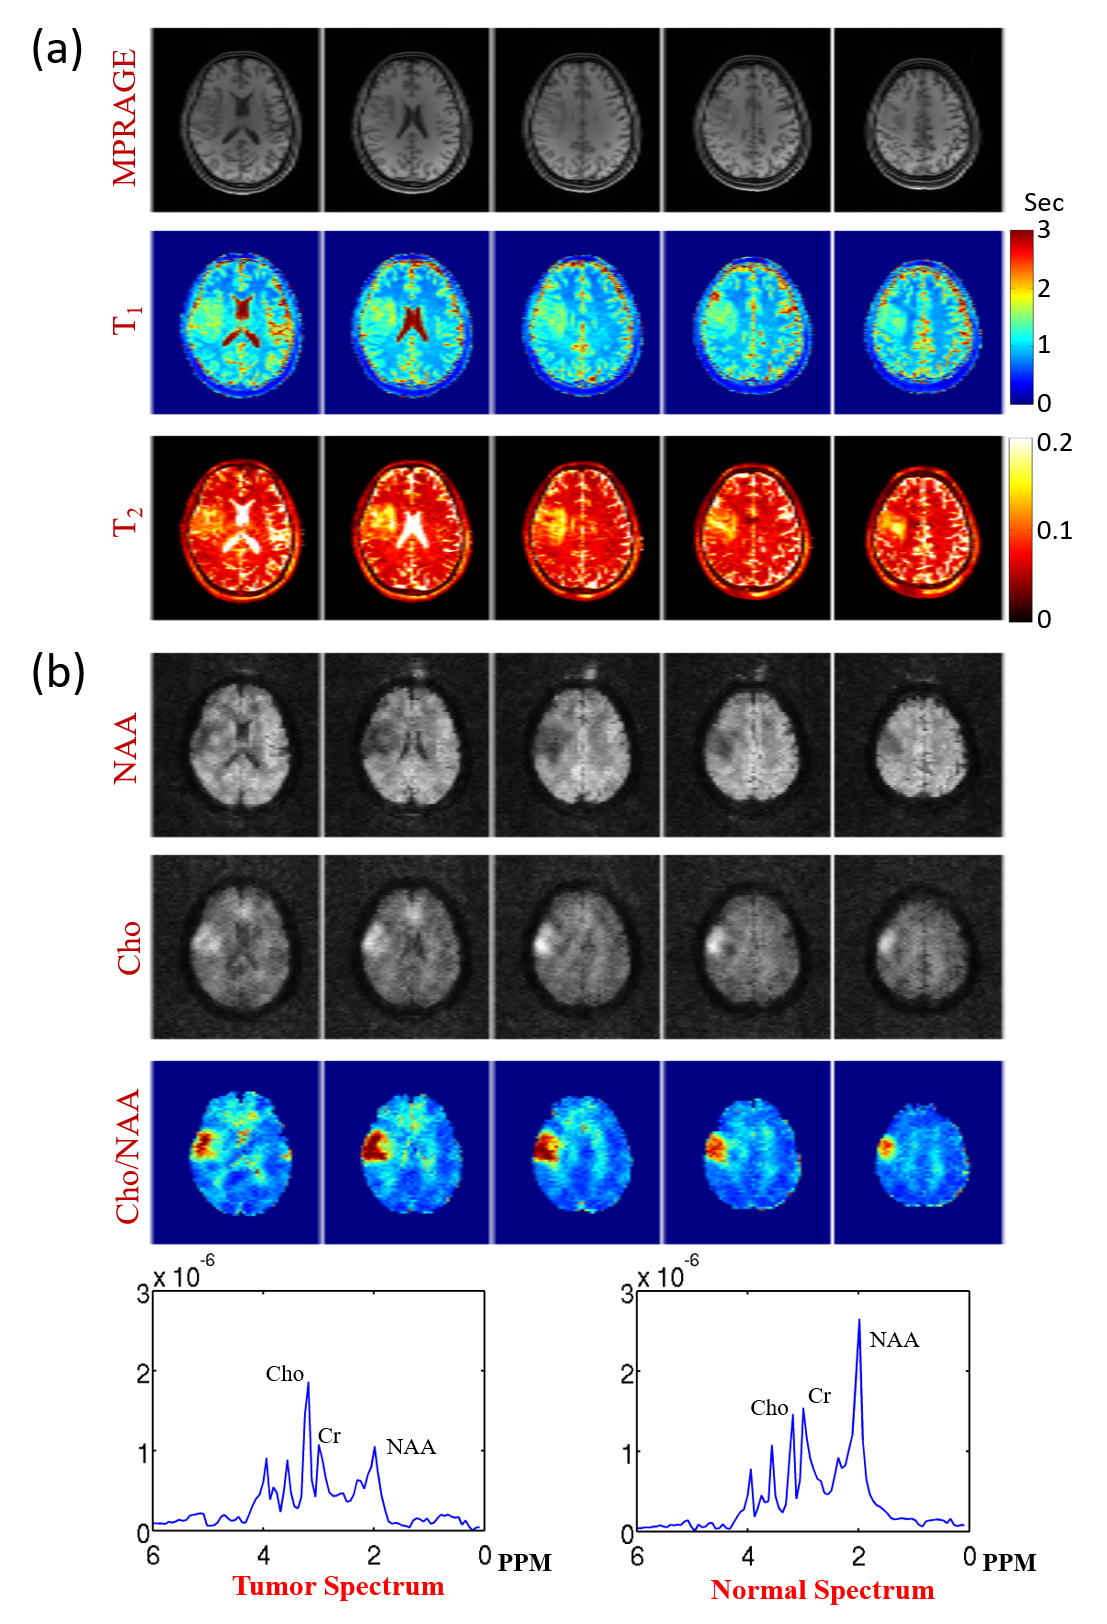
The proposed method has been evaluated using both simulated and experimental data. Simulated data were constructed based on Eq. (2) with true parameters determined from an in vivo dataset plus Gaussian noise. Experimental data were obtained from both phantom and human subjects on 3T systems (MAGNETOM Prisma, Siemens Healthcare, Erlangen, Germany) using the following imaging parameters: TR/TE=160/1.6ms, FOV=230×230×72mm3, matrix size=216×122×72, FA=12/17/22/27/32°, TP=0/20/40/60/80ms, scan time=8.5min. Figure 2 shows the simulation results, which compare our method with conventional SENSE reconstruction. As shown, the proposed method significantly improved the reconstruction accuracy. Figure 3 shows the phantom results, which demonstrate that our imaging method achieved comparable accuracy as standard T1/T2 imaging methods (VFA-FLASH10 and multi-TE-TSE11). Figure 4 shows the in vivo results, where we compared SENSE-based, low-rank tensor-based (i.e., using the proposed model in Eq. (2) but without GS-based constraint), and the proposed reconstruction. As shown, the low-rank tensor model significantly reduced the aliasing artifacts over traditional model, while the GS-based constraint further improved the spatial quality. We have also tested the proposed method on one brain tumor patient. As can be seen in Fig. 5, high-quality T1/T2 and metabolic maps were obtained from SPICE data, characterizing the tissue abnormality within the tumor.Conclusions
This paper presents a novel model-based method for reconstruction of T1/T2 maps from unsuppressed water signals acquired in MRSI scans supplemented with highly sparse T1/T2-encoded data. The proposed method utilizes the low-rank tensor and GS model to effectively absorb the spectral and spatial priors. Reconstructions results from both simulated and experimental data demonstrated the potential of the proposed method to support rapid simultaneous metabolic and parametric imaging.Acknowledgements
No acknowledgement found.References
[1] S. Posse, R. Otazo, S. R. Dager, and J. Alger, “MR spectroscopic imaging: Principles and recent advances,” J. Magn. Reson, vol. 37, no. 6, pp. 1301–1325, 2013.
[2] S. D. Serai, “Basics of magnetic resonance imaging and quantitative parameters T1, T2, T2*, T1rho and diffusion-weighted imaging”, Pediatr. Radiol., vol. 52, pp. 217–227, 2022.
[3] R. Guo, Y. Zhao, Y. Li, Y. Li, and Z.-P. Liang, “Rapid parametric mapping using the unsuppressed water signals in metabolic imaging of the brain,” in Proc. Intl. Soc. Magn. Reson. Med., 2021, p. 1803.
[4] Z.-P. Liang, “Spatiotemporal Imaging with Partially Separable Functions,” in Proc. IEEE Int. Symp. Biomed. Imag., vol. 2, pp. 988–991, 2007.
[5] F. Lam and Z.-P. Liang, “A subspace approach to high-resolution spectroscopic imaging,” Magn. Reson. Med., vol. 71, pp. 1349–1357, 2014.
[6] X. Peng, F. Lam, Y. Li, B. Clifford, and Z.-P. Liang, “Simultaneous QSM and metabolic imaging of the brain using SPICE,” Magn. Reson. Med., vol. 79, pp. 13–21, 2018.
[7] R. Guo, Y. Zhao, Y. Li, Y. Li, and Z. Liang, “Simultaneous metabolic and functional imaging of the brain using SPICE,” Magn. Reson. Med., vol. 82, pp. 1993–2002, 2019.
[8] F. Lam, Y. Li, R. Guo, B. Clifford, and Z. Liang, “Ultrafast magnetic resonance spectroscopic imaging using SPICE with learned subspaces,” Magn Reson Med, vol. 83, pp. 377–390, 2020.
[9] Z.-P. Liang and P. C. Lauterbur, “A generalized series approach to MR spectroscopic imaging,” IEEE Trans. Med. Imaging, vol. 10, pp. 132–137, 1991.
[10] E. K. Fram et al., “Rapid calculation of T1 using variable flip angle gradient refocused imaging,” Magn Reson Imaging, vol. 5, pp. 201–208, 1987.
[11] T. Zhang, R. Guo, Y. Li, Y. Zhao, Y. Li, and Z. P. Liang, “T2′ mapping of the brain from water-unsuppressed 1H-MRSI and turbo spin-echo data,” Magn. Reson. Med., vol. 88, pp. 2198–2207, 2022.
Figures