1141
Widespread, depth-dependent microstructural damage in the cortex of children with focal epilepsy: A quantitative T1 and T2 mapping study1Centre for the Developing Brain, School of Biomedical Engineering and Imaging Sciences, King's College London, London, United Kingdom, 2Department for Forensic and Neurodevelopmental Sciences, Institute of Psychiatry, Psychology and Neuroscience, King's College London, London, United Kingdom, 3Department of Biomedical Engineering, King's College London, London, United Kingdom, 4Biomedical Image Technologies, ETSI Telecomunicación, Madrid, Spain, 5Universidad Politécnica de Madrid, Madrid, Spain, 6Biomedical Research Networking Center in Bioengineering, Biomaterials and Nanomedicine (CIBER-BBN), Madrid, Spain, 7Department of Neuroimaging, King's College London, London, United Kingdom, 8MRC Centre for Neurodevelopmental Disorders, London, United Kingdom
Synopsis
Keywords: Epilepsy, Relaxometry, Paediatric
We assessed cortical microstructure in children with drug-resistant focal epilepsy using T1 and T2 relaxometry (qT1 and qT2). We show widespread, depth-mediated qT1 and qT2 increases, and alterations in intracortical organisation in patients. Changes did not correlate with clinical parameters, suggesting that they may be independent of disease severity. Using a random forest algorithm, we also show that qT1 and qT2 surface-features from patients with radiologically defined abnormalities (MRI-positive) and controls, can classify patients without reported radiological abnormalities (MRI-negative). This suggests a common imaging endophenotype of focal epilepsy irrespective of visible abnormalities that may be present at a pre-symptomatic disease-stage.
Introduction
In adults with focal epilepsy, widespread cortical changes remote from the putative epileptic focus have been demonstrated with MRI1,3–6, predominantly using morphological markers3. It is not known whether these alterations are the result of ongoing chronic disease-processes7,8 and treatment-related side-effects9,10, or whether they emerge at an earlier disease-stage2,11. Only a few studies have focused on children, who typically have shorter disease-duration. Fewer still have utilised multimodal quantitative MRI (qMRI), which may provide a more sensitive index of microstructural changes12. Here, we applied surface-based13 qT1 and qT2 to assess cortical architecture in children with drug-resistant focal epilepsy, and their relationship to clinical parameters. Additionally, we used a random forest classifier on qT1 and qT2 cortical gradient maps to assess whether cortical microstructure patterns learnt from MRI-positive patients could classify MRI-negative patients.Methods
Data Acquisition89 children were scanned without sedation on a 3T Achieva-TX scanner (Philips Healthcare) - 43 with drug-resistant focal epilepsy [age-range: 4-18, mean=12yrs] and 46 healthy controls [age-range: 2-18, mean=11.5yrs]. See Table 1 for acquisition parameters. All images were motion-corrected14.
Analysis:
Surface reconstruction: FLAIR and T1w images were analysed with the HCP structural pipeline13 to reconstruct white/grey matter (WM/GM) and pial surfaces. These surfaces were used to compute equi-volume cortical surface depths by sampling the surface vertices in steps of 20% of cortical volume (0%: depth 1 – WM/GM, 100%: depth 5 - pial surface).
T1 and T2 surface mapping: qT1 and qT2 images15 were rigidly co-registered to their corresponding MPRAGE volume, smoothed (s = 0.4), and projected to each depth.
Group-differences in cortical qT1 and qT2: Group-wise alterations at each cortical depth were tested using PALM10. Additionally, vertex-wise qT1 and qT2 values at 20% depth were subtracted from those at 80% depth, and group-differences in cortical gradients were tested as an index of intracortical organization. Age, sex, cortical thickness and curvature were included as covariates1,16,17. Analyses were repeated by splitting patients with temporal focus (N=22) and patients with frontal focus (N=14) into sub-groups, and then again by splitting patients according to their focus laterality, to understand the effect of focus area and laterality on the examined changes. In all analyses, TFCE was employed as a test statistic, and a conservative single FWE correction-rate was applied across modalities and contrasts.
Assessment of the diagnostic performance of surface-based qMRI supported through a random forest classifier: A random forest algorithm was trained on the gradient maps of qT1 and qT2 unpermuted residuals of MRI-positive patients (N=21) and controls (N=31). The model’s performance was tested on gradient maps of qT1 and qT2 unpermuted residuals of MRI-negative patients (N=19) and controls (N=14) held-out from the training set. AUC, accuracy, sensitivity, specificity and F1‑scores were used to evaluate classification performance. A permutation-based p-value was calculated to assess how likely the performance of the classifier would be obtained by chance.
Results
Group-differences at each cortical depth (Figure 2): qT2 increases were detected in the outmost cortical depths in temporal patients, especially in the left hemisphere. qT2 increases affected temporal, as well as frontal, occipital and parietal lobes. qT1 and qT2 increases were detected in the outermost cortical depths in patients with left-hemisphere focus compared to controls. No significant differences were detected between patients’ subgroups and none of the detected changes were associated with clinical variables.Group-differences in cortical gradients (Figure 3): We detected steeper gradients in the patient group, with increasingly high qT1 and qT2 in the outermost cortical depths bilaterally. Widespread and bilateral steeper qT1 and qT2 gradients were detected in temporal patients and in patients with left-hemisphere focus compared to controls. No significant differences were detected between patients’ subgroups and none of the detected changes was associated with clinical variables.
Random forest classifier performance (Figure 4): On a classifier trained with MRI-positive patients and controls, we had a test AUC of 95%, accuracy of 82%, sensitivity of 62% at 100% specificity, and an F1 score of 77% on MRI-negative patients and controls that were not part of the training group. The classifier performed significantly better than chance [p < 0.001] (Figure 4).
Discussion
We report the presence of widespread, depth-mediated qT1 and qT2 increases, and alterations in intracortical organization in children with focal epilepsy. Changes were unrelated to focus area or laterality, and likely represent loss of structure, gliosis, myelin and iron changes, edema-associated free-water increases, or a combination of these12. Based on the lack of associations with disease-severity measures, we suggest that such changes appear during cerebral development and represent antecedent neurobiological alterations, rather than the cumulative effect of seizure-activity or medication side-effects. A random forest classifier trained on whole-brain qT1 and qT2 surface maps from MRI-positive patients and controls could classify data from MRI-negative patients and controls not used in the training phase, suggesting the presence of a potential imaging endophenotype of focal epilepsy, detectable with or without radiologically-identified abnormalities being present. Its ability to classify young patients suggests that such endophenotype may be present at a pre-symptomatic disease-stage.Conclusions
These findings could have important implications for the early diagnosis of epilepsy, possibly before seizure-activity appears, with the goal of enabling timely care for patients and increasing the range and timing of therapeutic options.Acknowledgements
This work was supported by a Sir Henry Dale Fellowship jointly funded by the Wellcome Trust and the Royal Society (Grant Number 206675/Z/17/Z), GOSHCC Sparks Grant V4419, King's Health Partners and by core funding from the Wellcome/EPSRC Centre for Medical Engineering [WT203148/Z/16/Z] as well as by the National Institute for Health Research (NIHR) Biomedical Research Centre based at Guy’s and St Thomas’ NHS Foundation Trust and King’s College London and/or the NIHR Clinical Research Facility. The views expressed are those of the author(s) and not necessarily those of the NHS, the NIHR or the Department of Health and Social Care. We are also thankful to the families who contributed their time to this research, and to our colleagues from the Evelina London Children Hospital, St Thomas’ Hospital and Centre for the Developing Brain.
References
1. Liu, R. S. et al. Progressive neocortical damage in epilepsy. Annals of Neurology: Official Journal of the American Neurological Association and the Child Neurology Society 53, 312–324 (2003).
2. Sisodiya, S., Free, S., Stevens, J., Fish, D. & Shorvon, S. Widespread cerebral structural changes in patients with cortical dysgenesis and epilepsy. Brain 118, 1039–1050 (1995).
3. Ahmad, R. et al. Cortical Changes in Epilepsy Patients With Focal Cortical Dysplasia: New Insights With T2 Mapping. Journal of Magnetic Resonance Imaging 52, 1783–1789 (2020).
4. Bernhardt, B. C. et al. Preferential susceptibility of limbic cortices to microstructural damage in temporal lobe epilepsy: A quantitative T1 mapping study. Neuroimage 182, 294–303 (2018).
5. Woermann, F. G., Free, S. L., Koepp, M. J., Ashburner, J. & Duncan, J. S. Voxel-by-voxel comparison of automatically segmented cerebral gray matter—a rater-independent comparison of structural MRI in patients with epilepsy. Neuroimage 10, 373–384 (1999).
6. Caciagli, L. et al. Thalamus and focal to bilateral seizures: A multiscale cognitive imaging study. Neurology 95, e2427–e2441 (2020).
7. Adler, S. et al. Topographic principles of cortical fluid-attenuated inversion recovery signal in temporal lobe epilepsy. Epilepsia 59, 627–635 (2018).
8. Donaire, A. et al. Cortical laminar necrosis related to prolonged focal status epilepticus. Journal of Neurology, Neurosurgery & Psychiatry 77, 104–106 (2006).
9. De Marcos, F. A., Ghizoni, E., Kobayashi, E., Li, L. M. & Cendes, F. Cerebellar volume and long-term use of phenytoin. Seizure 12, 312–315 (2003).
10. Latour, P. et al. Drug induced encephalopathy in six epileptic patients: topiramate? valproate? or both? Hum Psychopharmacol 19, 193–203 (2004).
11. Widjaja, E. et al. Reduced Cortical Thickness in Children with New-Onset Seizures. AJNR Am J Neuroradiol 33, 673–677 (2012).
12. Cercignani, M., Dowell, N. G. & Tofts, P. S. Quantitative MRI of the Brain: Principles of Physical Measurement, Second edition. (CRC Press, 2018).
13. Glasser, M. F. et al. The minimal preprocessing pipelines for the Human Connectome Project. Neuroimage 80, 105–124 (2013).
14. Cordero Grande, L. et al. Motion‐corrected MRI with DISORDER: Distributed and incoherent sample orders for reconstruction deblurring using encoding redundancy. Magnetic resonance in medicine 84, 713–726 (2020).
15. Teixeira, R. P. A. G., Malik, S. J. & Hajnal, J. V. Joint system relaxometry (JSR) and Crámer-Rao lower bound optimization of sequence parameters: A framework for enhanced precision of DESPOT T1 and T2 estimation. Magn Reson Med 79, 234–245 (2018).
16. Galovic, M. et al. Resective surgery prevents progressive cortical thinning in temporal lobe epilepsy. Brain 143, 3262–3272 (2020).
17. Annese, J., Pitiot, A., Dinov, I. D. & Toga, A. W. A myelo-architectonic method for the structural classification of cortical areas. NeuroImage 21, 15–26 (2004).
Figures
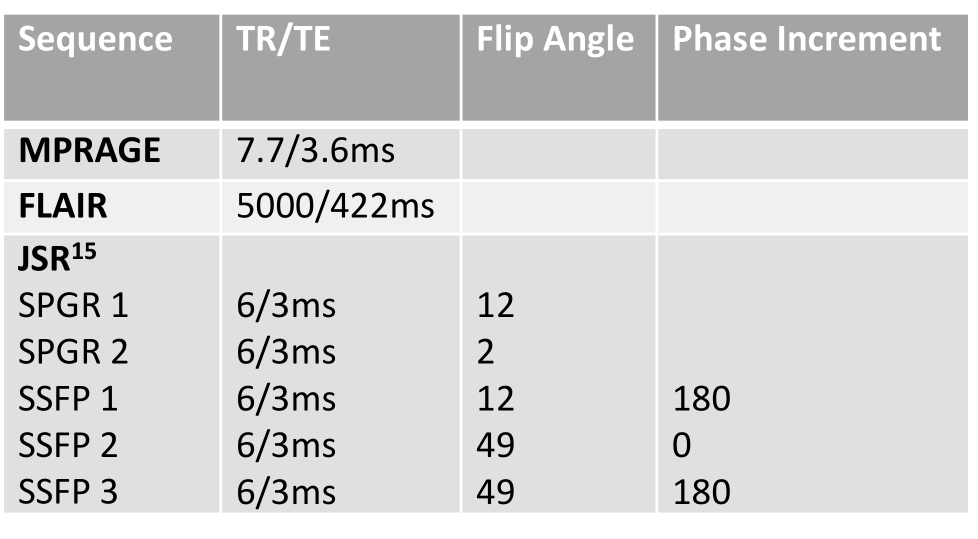
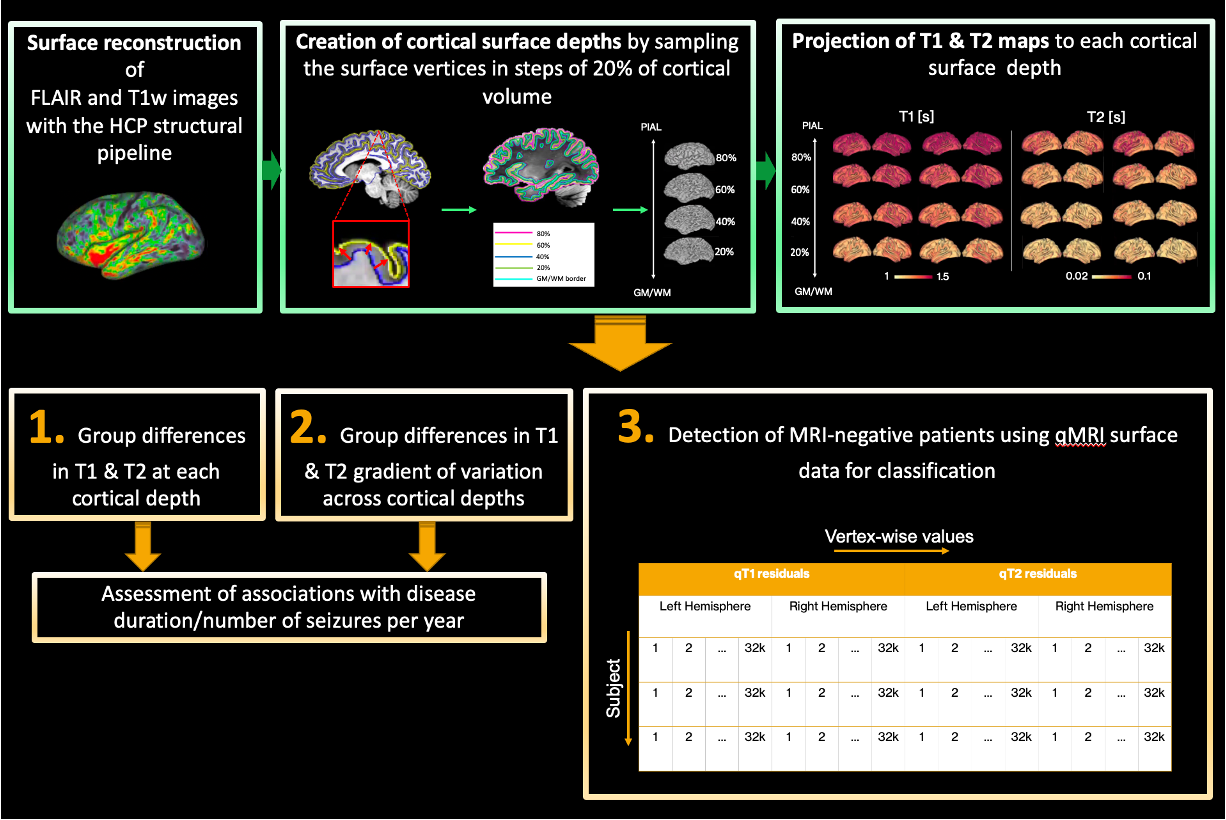
Figure 1. Diagram of data processing (green) and analysis (orange). Surface extraction at increasing cortical depths and projection of qT1 and qT2 maps onto each depth allowed: 1) to assess qT1 & qT2 depth-wise group differences; 2) to investigate group differences in qT1 & qT2 gradients; (3) to assess the classification performance of qMRI through a random forest classifier. For this purpose, we concatenated each subject’s vertex-wise qT1 & qT2 unpermuted residuals for left and right hemispheres.
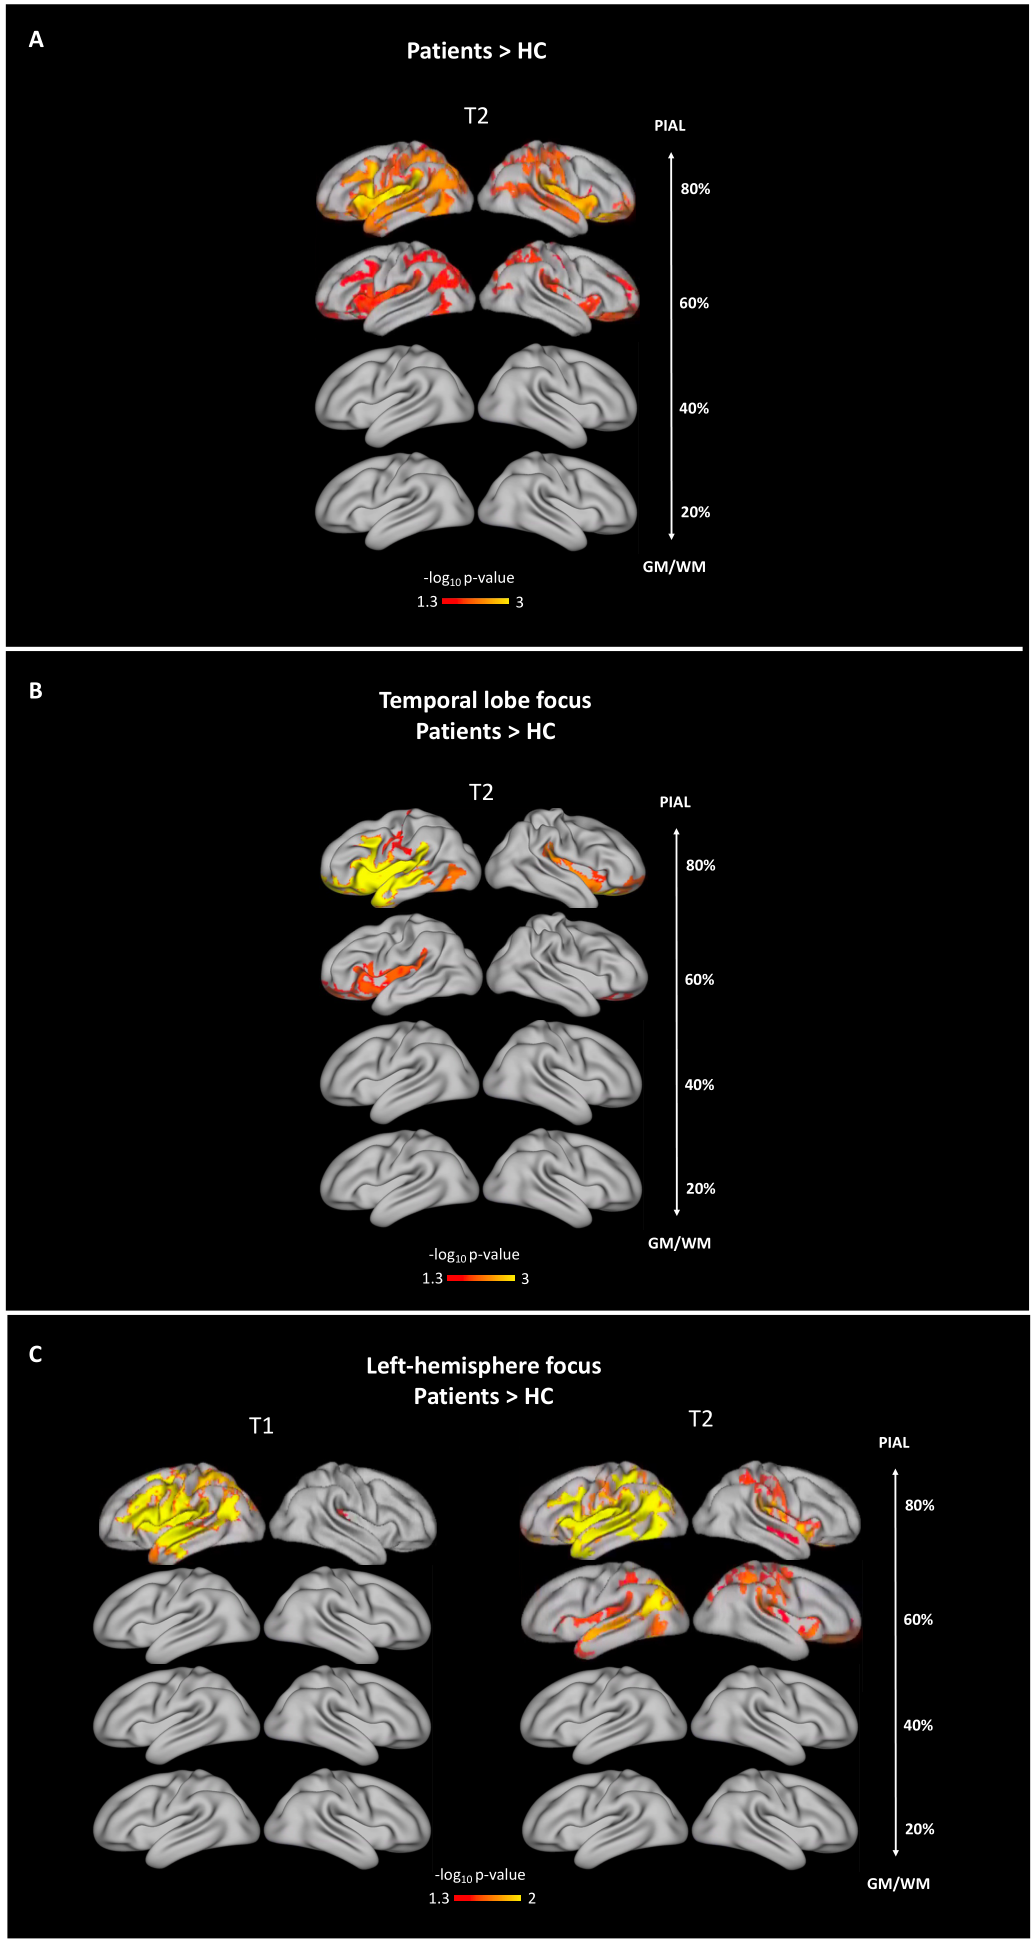
Figure 2. Group differences in qT1 & qT2 at each depth from the GM/WM border. Group differences were widespread and depth-mediated. (A) Patients versus controls. (B) Temporal patients versus controls. Patients with occipital (N=3) and parietal (N=2) focus, as well as patients with both frontal and temporal focus (N=2) were excluded from this analysis because of low numbers. (C) Patients with left hemisphere focus versus controls. One patient was excluded from this analysis because of uncertain hemispheric focus.
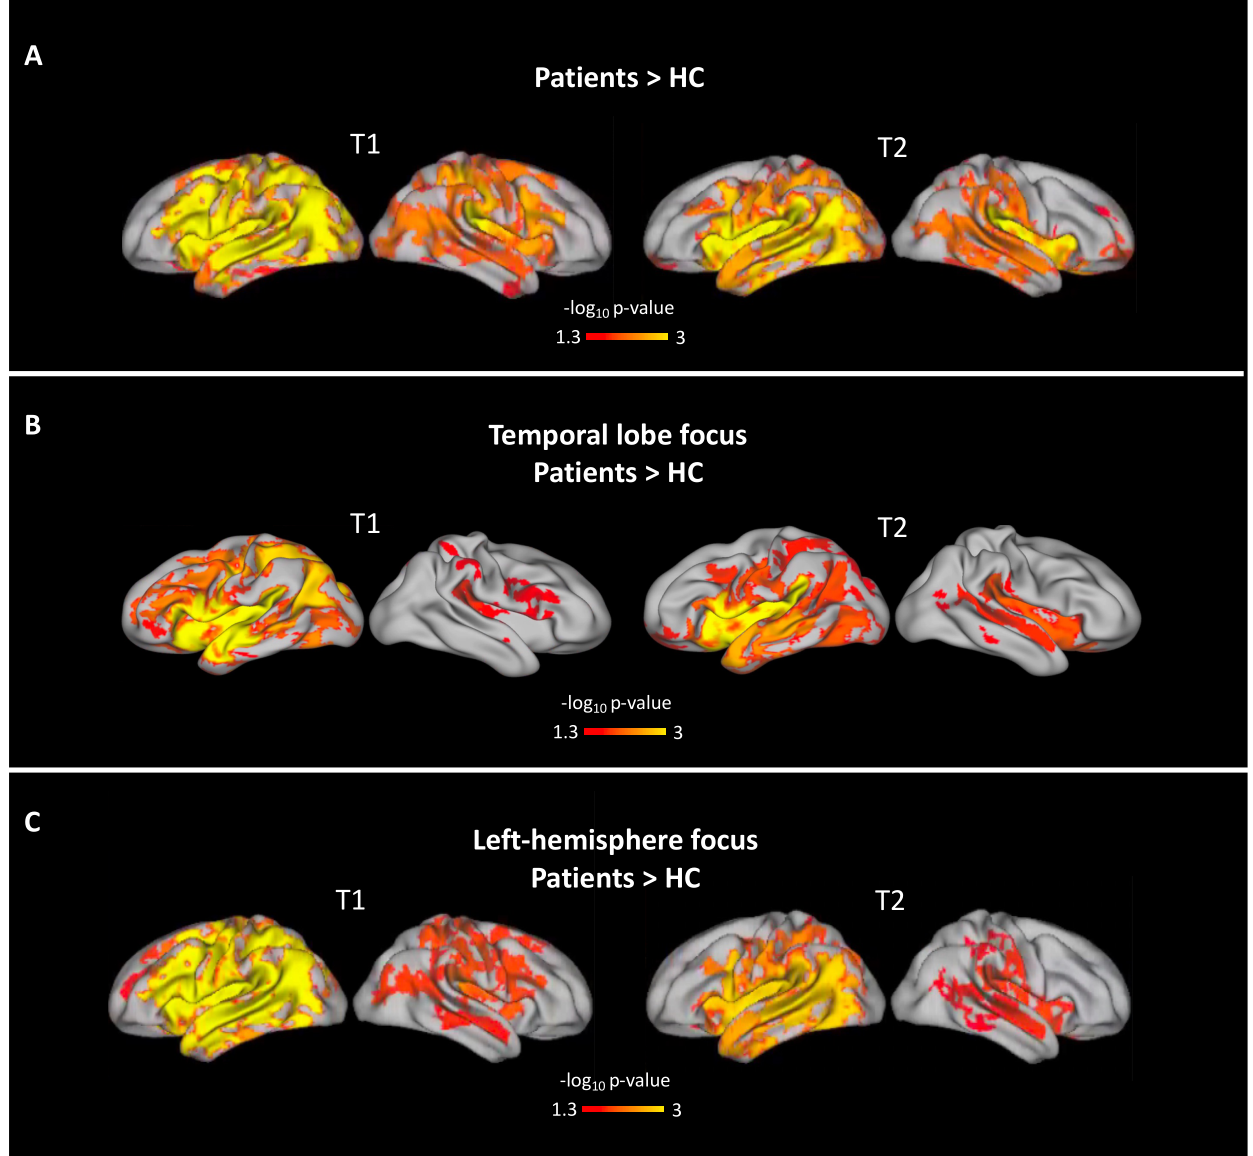
Figure 3. Group differences in qT1 & qT2 cortical gradients. Increasingly high qT1 and qT2 in the outermost cortical depths can be detected bilaterally in patients. (A) Patients versus controls. (B) TLE patients versus controls. As above, patients with occipital (N = 3) and parietal (N = 2) focus, as well as patients with both frontal and temporal focus (N = 2) were excluded from this analysis because of low numbers. (C) Patients with left hemisphere focus versus controls. One patient was excluded because of uncertain hemispheric focus.
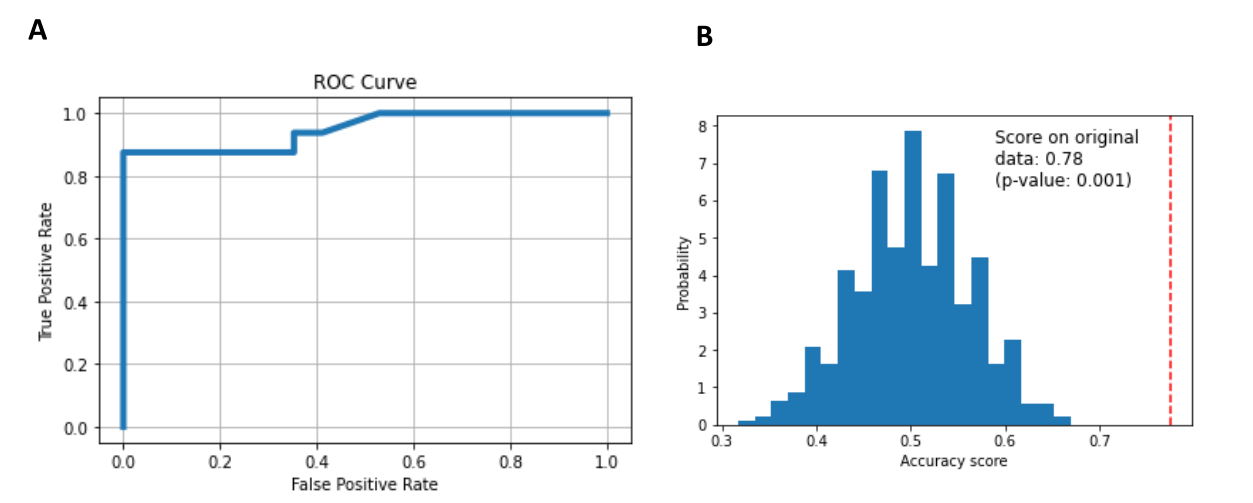
Figure 4. Random Forest Classifier performance. (A) ROC Curve; (B) Histogram of the permutation scores (the null distribution). The red line indicates the score obtained by the classifier on the original data. The score is much better than that obtained by using permuted data and the p-value is significant.