1137
A data-driven paradigm for myelin water imaging – validation on multicompartment phantom and multiple sclerosis patient1The Department of Biomedical Engineering, Tel-Aviv University, Tel-Aviv, Israel, 2Sagol School of Neuroscience, Tel-Aviv University, Tel Aviv, Israel, 3Center for Advanced Imaging Innovation and Research (CAI2R), New-York University Langone Medical Center, New York, NY, United States
Synopsis
Keywords: White Matter, Multiple Sclerosis, Myelin
Multicomponent (MC) T2 analysis is a common technique for probing sub-voxel compartmentation in myelinated tissues. However, the task of resolving the T2 spectra from a single voxel is ill-posed and highly sensitive to noise. Applying a spatially-global MC analysis of the tissue prior to the voxel-wise analysis promotes more stable solutions. Specifically, this approach identifies a specific set of MC T2 features which are then used for fitting the signal in each voxel. Preliminary results suggest that the new data-driven approach can accurately estimate myelin content and correctly estimate myelin content in healthy tissue and in multiple sclerosis lesions.Introduction
Quantification of myelin in white matter (WM) tissues is important for monitoring the progression of many neurodegenerative diseases including multiple sclerosis (MS) and Alzheimer’s disease1–3. One approach to probe sub-voxel content, such as myelin, is multi-component T2 (mcT2) analysis - a deconvolution process that converts a T2 signal into a distribution of T2 values (T2 spectra)4. In the WM these spectra are useful for estimating the myelin water fraction (MWF) by calculating the relative area of the short T2 values (0…40 ms 5,6), providing a reliable proxy of myelin content3,6.Traditionally, mcT2 analysis is based on separating the signal into a weighted sum of exponential decay curves. This, however, is highly challenging since the problem is ill-posed and very sensitive to noise7,8. Recently, a new data-driven paradigm for mcT2 analysis showed promising results on numerical simulations and human brain5. In this approach statistical analysis is applied to the entire WM as a preprocessing step in order to identify a set of global mcT2 features which are then used as basis-functions for voxel-wise mcT2 fitting. In this work, we compared data-driven vs. non-data-driven myelin water imaging (MWI) in a unique MC phantom and in the brain of an MS patient.
Methods
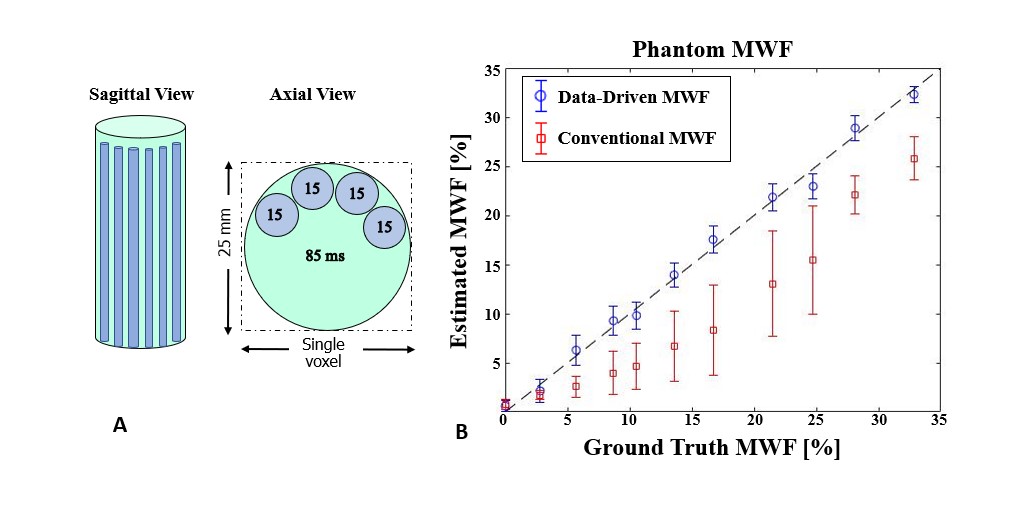
Phantom preparation: An mcT2 phantom was prepared from 2 MnCl2 solutions with different T2 values. Eleven tubes of 15 ml were filled with a 85 ms solution. Every tube was added with varying number of 3 and 5 mm tubes filled with a 15 ms solution, producing relative fractions of 0–33 % of the short T2 component.MRI scans : Phantom was scanned on a 3T Prisma MRI scanner (Siemens Healthineers) using a multi-echo spin-echo (MESE) protocol [TR/TE=4000/7.2 ms, FOV=1000x750 mm2, matrix size 40x30, slice thickness = 3 mm, NEchoes=24]. Each tube was scanned separately and analyzed using the data-driven algorithm. Scans used extremely low-resolutions with pixel size of 25x25 mm in order to capture the entire phantom within one pixel as shown in Figure 1A. The brain of an adult volunteer was scanned on the same scanner using a MESE protocol [TR/TE=3000/10 ms, FOV=216x180 mm2, matrix size 216x180, slice thickness = 3 mm, NEchoes =15]. The brain of a healthy adult MS patient was scanned on a similar scanner and MESE protocol [TR/TE=4600/12 ms, FOV=200x220 mm2, matrix size 112x128, slice thickness = 3 mm, NEchoes=11].
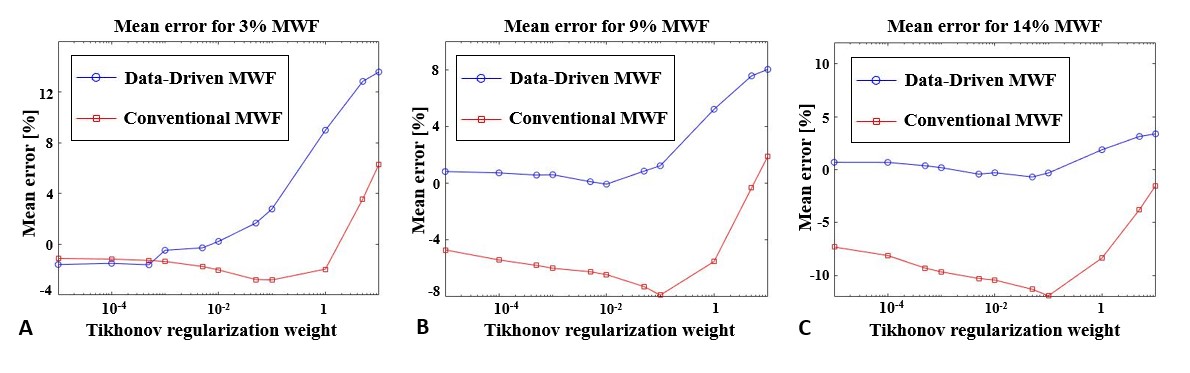
mcT2 Analysis: data-driven analysis was performed using an mcT2 dictionary constructed using 55 single-T2 elements, logarithmically spaced between 5-800 ms, and fraction resolution of 0.055. MWF values were compared to the exponential fitting9–11. For each technique, a grid-search of Tikhonov regularization weights (10-5-10) was performed for optimizing the fitting process5,6.
Results
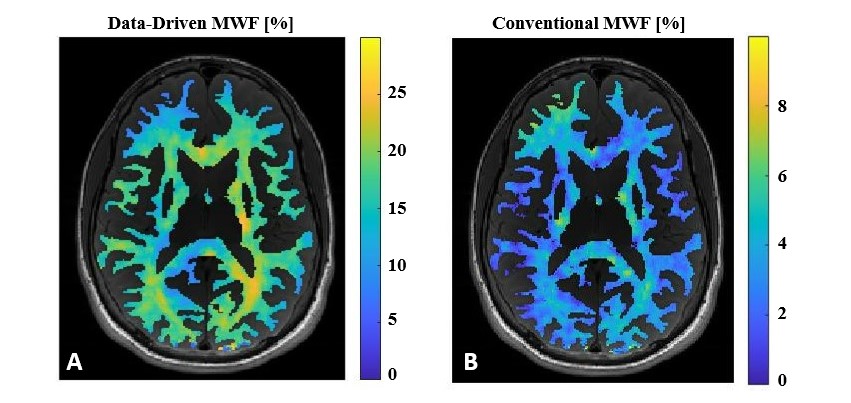
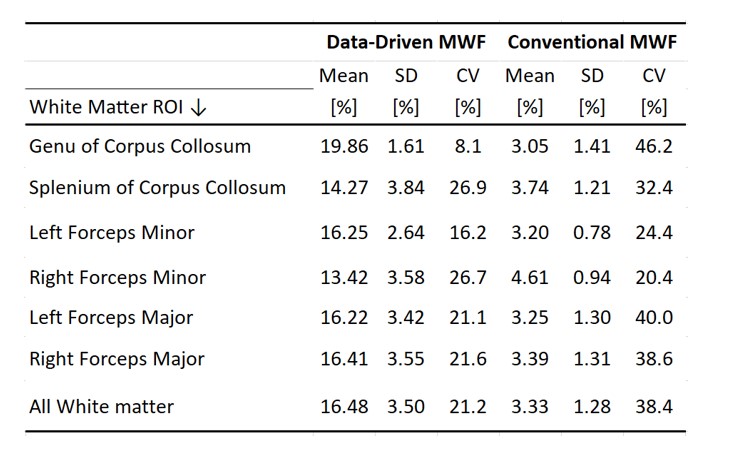
MWF of a series of phantoms is provided in Figure 1, demonstrates the high accuracy of the data-driven algorithm vis-à-vis conventional exponential fitting, which produced higher error (standard deviation, SD) and underestimated the fraction of the short T2 component compared to ground truth values. Figure 2 shows the robustness of the data-driven approach in comparison to exponential fitting across a range of Tikhonov regularization weights and for three representative test tubes.Figure 3 shows MWF maps for a healthy volunteer, analyzed by the two assayed techniques. Similar to the phantom results, the exponential technique tends to underestimate the MWF values, while the data-driven values are in agreement with previous works12–15. Table 1 presents the mean, SD and coefficient of variation (CV) of MWF for different brain regions in the WM of the healthy volunteer. Similar to Figure 3, a large variability exists in mean MWF values between the two techniques. Although the SD of the data-driven technique is higher, its CV tends to be smaller.
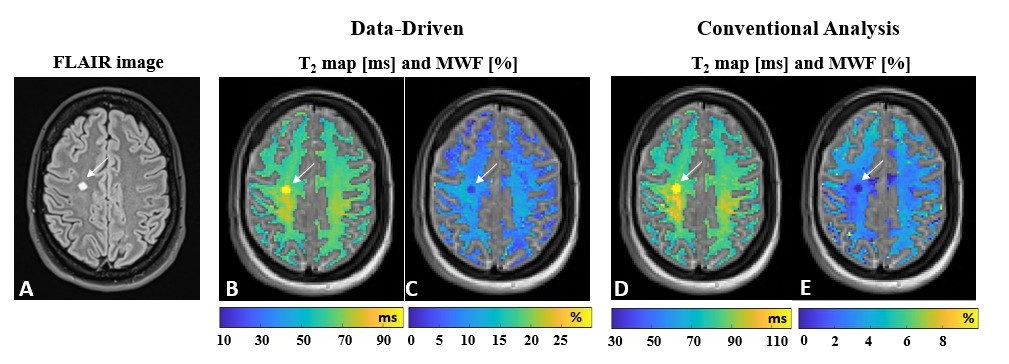
Figure 4 shows a fluid attenuated inversion recovery (FLAIR) image, MWF and T2 maps for a MS patient. Each of the techniques succeeded to correctly identify the lesion, having elevated T2 values caused by inflammation and decreased MWF values due to local demyelination.
Discussion
This study presents new validations of the data-driven algorithm on a multi-compartment phantom and a MS patient. It demonstrates the power of identifying a tissue-specific set of global features resulting in decreased ambiguity in the T2 space and more stable convergence of the mcT2 fitting process, compared conventional multi-exponential technique which underestimated the MWF values. The T2 maps of both techniques show distinct values for the lesion and its surroundings. However, the result using multi exponential technique might be not reproducible between scans and scanners, as opposed to the data-driven algorithm which incorporates the protocol scheme and scan parameters into its reconstruction process16–18. The MWF map of the MS patient demonstrate the potential of the data-driven approach in assessing the myelin content in MS patients, while further investigation is required on larger cohort in order to validate its performance.Acknowledgements
No acknowledgement found.References
1. Steinman, L. Multiple sclerosis: A coordinated immunological attack against myelin in the central nervous system. Cell 85, 299–302 (1996).
2. Papuć, E. & Rejdak, K. State of the art paper The role of myelin damage in Alzheimer’s disease pathology. Arch Med Sci 16, 345–351 (2020).
3. Heath, F., Hurley, S. A., Johansen-Berg, H. & Sampaio-Baptista, C. Advances in noninvasive myelin imaging. Dev Neurobiol 78, 136–151 (2018).
4. Whittall, K. P. & MacKay, A. L. Quantitative interpretation of NMR relaxation data. Journal of Magnetic Resonance (1969) 84, 134–152 (1989).
5. Omer, N., Galun, M., Stern, N., Blumenfeld-Katzir, T. & Ben-Eliezer, N. Data-driven algorithm for myelin water imaging: Probing subvoxel compartmentation based on identification of spatially global tissue features. Magn Reson Med 87, 2521–2535 (2022).
6. Alonso-Ortiz, E., Levesque, I. R. & Pike, G. B. MRI-based myelin water imaging: A technical review. Magn Reson Med 73, 70–81 (2015).
7. Does, M. D. Inferring Brain Tissue Composition and Microstructure via MR Relaxometry. Neuroimage 182, 136 (2018).
8. Chan, K. S. & Marques, J. P. Multi-compartment relaxometry and diffusion informed myelin water imaging – Promises and challenges of new gradient echo myelin water imaging methods. Neuroimage 221, 117159 (2020).
9. Kolind, S. H., Mädler, B., Fischer, S., Li, D. K. B. & MacKay, A. L. Myelin water imaging: Implementation and development at 3.0T and comparison to 1.5T measurements. Magn Reson Med 62, 106–115 (2009).
10. Prasloski, T., Mädler, B., Xiang, Q. S., MacKay, A. & Jones, C. Applications of stimulated echo correction to multicomponent T2 analysis. Magn Reson Med 67, 1803–1814 (2012).
11. McPhee, K. C. & Wilman, A. H. Limitations of skipping echoes for exponential T2 fitting. Journal of Magnetic Resonance Imaging 48, 1432–1440 (2018).
12. Deoni, S. C. L., Rutt, B. K., Arun, T., Pierpaoli, C. & Jones, D. K. Gleaning multicomponent T1 and T2 information from steady-state imaging data. Magn Reson Med 60, 1372–1387 (2008).
13. Warntjes, M., Engström, M., Tisell, A. & Lundberg, P. Modeling the presence of myelin and edema in the brain based on multi-parametric quantitative MRI. Front Neurol 7, 16 (2016).
14. Nagtegaal, M. et al. Myelin water imaging from multi-echo T2 MR relaxometry data using a joint sparsity constraint. Neuroimage 219, 117014 (2020).
15. Kumar, D. et al. Using 3D spatial correlations to improve the noise robustness of multi component analysis of 3D multi echo quantitative T2 relaxometry data. Neuroimage 178, 583–601 (2018).
16. Ben-Eliezer, N., Sodickson, D. K., Shepherd, T., Wiggins, G. C. & Block, K. T. Accelerated and motion-robust in vivo T2 mapping from radially undersampled data using Bloch-simulation-based iterative reconstruction. Magn Reson Med 75, 1346 (2016).
17. Radunsky, D. et al. Quantitative platform for accurate and reproducible assessment of transverse (T2) relaxation time. NMR Biomed 34, e4537 (2021).
18. Ben-Eliezer, N., Sodickson, D. K., Shepherd, T., Wiggins, G. C. & Block, K. T. Accelerated and motion-robust in vivo T2 mapping from radially undersampled data using bloch-simulation-based iterative reconstruction. Magn Reson Med 75, 1346–1354 (2016).
Figures