1136
Component Analysis based on Standard-deviation Attenuation (CASA): a new algorithm for the denoising of Diffusion MRI data
Mauro Zucchelli1, Christos Papageorgakis1, and Stefano Casagranda1
1Department of R&D Advanced Applications, Olea Medical, La Ciotat, France
1Department of R&D Advanced Applications, Olea Medical, La Ciotat, France
Synopsis
Keywords: White Matter, Diffusion Tensor Imaging, Denoising, CASA
Noise is a crucial problem that affects even the most advanced MRI techniques based on model fitting. It is therefore important to act on the raw data to remove as much noise as possible, while preserving the anatomical structures. Many techniques based on Principal Component Analysis (PCA) take advantage of the redundancy of information contained in multiphase data, to perform robust denoising. In this work, we introduce a new denoising method based on PC images. We show the added value of our technique on both the raw data and the derived fractional anisotropy map.INTRODUCTION
Diffusion MRI (dMRI) is the main imaging technique used to probe white matter connections in-vivo. A dMRI acquisition is composed of one or more baseline images called b=0 and several diffusion weighted images, usually 30 or more with a higher b-values. Changing the b-values and the gradient directions we obtain different sampling schemes which are used to probe the brain microstructure. To accelerate the scan-time of the numerous 3D volumes composing a dMRI acquisition, several techniques have been employed but often at the cost of a reduced Signal-to-Noise Ratio (SNR).In this work we propose a new technique, called Component Analysis based on Standard-deviation Attenuation (CASA), for denoising dMRI data. CASA was first introduced for CEST data denoising1 and it is the first time that it is also applied to diffusion MRI.METHODS
CASA is based on the decrease of the variance of a Principal Component (PC) related image after a smoothing filter is applied on it. The CASA denoising algorithm can be summarized in the following steps:1) PCA is performed to obtain the PC related images. Those are images composed by collecting the coefficients associated to the extracted principal components and placed at their corresponding voxel locations. The standard deviation of the voxels of the full image is computed for each of the N-PC related images to form the vector σ = [ σ1, … ,σN]..
2) We perform a Gaussian smoothing on each component and the standard deviation is recomputed on the smoothed PC related images σs = [ σ1s, … ,σNs]. See Figure 1 (left) for an example of a component before and after the smoothing.
3) The rate of decrease of standard deviation, which we call the CASA rates, is computed for each component as the vector σir=(σi-σis)/σi. The vector σr is ordered by its values (see Figure 1). The components whose σir are on the plateau of the curve are rejected and set to 0. σr can be considered an estimator of the SNR with low values corresponding to high SNR and σr close to 1 to completely noisy data.
4) Before the signal reconstruction a Gaussian smoothing is applied on the retained PC related images. The strength of the applied filter is proportional to the amount of information that the ith component carries. This is expressed as the value of 0.5 times the value of σir after a min-max normalization. This allows optimizing the filtering method based on the amount of noise and information present in each component.
5) The retained component coefficients are projected back in the original space and will form the denoised data.
We test our technique on a high angular resolution diffusion images (HARDI) data of a healthy volunteer with 1 b=0 and 64 b=2000s/mm2 images. Data was acquired on a 3 Tesla MR scanner (Galan, Canon Medical Systems Corporation, Ōtawara, Tochigi, Japan).
RESULTS
In order to evaluate CASA denoising, we compare it with one of the state-of-the-art denoising algorithms for dMRI data, the random-matrix based denoising2 included in the MRtrix 3.0 software library (dwidenoise with default parameters)3. Figure 2 shows the result of the denoising on the HARDI data for three diffusion gradients. CASA denoised data appear to be qualitatively less noisy, with clearer contrast in all the major brain structures. To quantify the denoising, we calculate σr for all the diffusion weighted volumes as an estimator of the SNR (Figure 3). The original noisy data have a σr above 0.4 on average. MRtrix denoised data improve the σr to an average of 0.35 and CASA denoising obtains the best performance for an average σr of 0.28. The denoising of the individual dMRI volume translates to an improved quality of all the dMRI derived indices. Figure 4 shows the fractional anisotropy (FA) calculated on the original (left), the MRtrix denoised (central), and on the CASA denoised data (right). The FA obtained after our denoising shows a major improvement in all the brain structures compared to both the original and the MRtrix denoised one.DISCUSSION AND CONCLUSION
In this work, we introduced a novel denoising technique based on principal components analysis with a principal component selection criterion and an additional adaptive filtering step that leads to better preservation of anatomical structures, rejecting persistent spatial noise from the extracted component coefficients. The CASA technique takes about 11 seconds to process our data. Our results showed that we were able to outperform one of the state-of-the-art methods for dMRI denoising - MRtrix random-matrix-based denoising - on the tested data. One of the main advantages of our technique is that it is model-free, thus it does not make any assumption on the noise distribution. Moreover, it can be applied to any kind of multi-phase MRI data and not only dMRI. This work is still preliminary, but it will be extended and validated on multiple subjects in our future studies.Acknowledgements
No acknowledgement found.References
1. Casagranda S.; Papageorgakis C.; et al. Principal Component selections and filtering by spatial information criteria for multi-acquisition CEST MRI denoising. In Proceedings of the 31st Annual Meeting of the ISMRM 2022. Abstract 2080.
2. Veraart, J.; et al. Denoising of diffusion MRI using random matrix theory. NeuroImage, 2016, 142, 394-406, doi: 10.1016/j.neuroimage.2016.08.016
3. Tournier, J.-D.; et al. MRtrix3: A fast, flexible and open software framework for medical image processing and visualisation. NeuroImage, 2019, 202, 116137
Figures
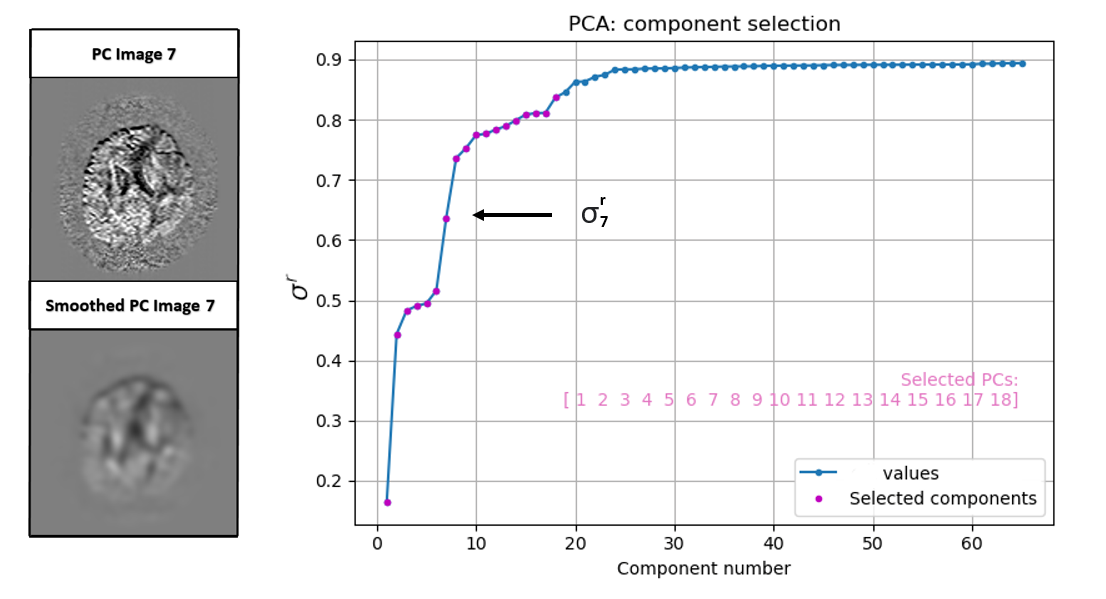
Figure 1. CASA rates σr calculated on the Principal Components (PC) of the HARDI data.
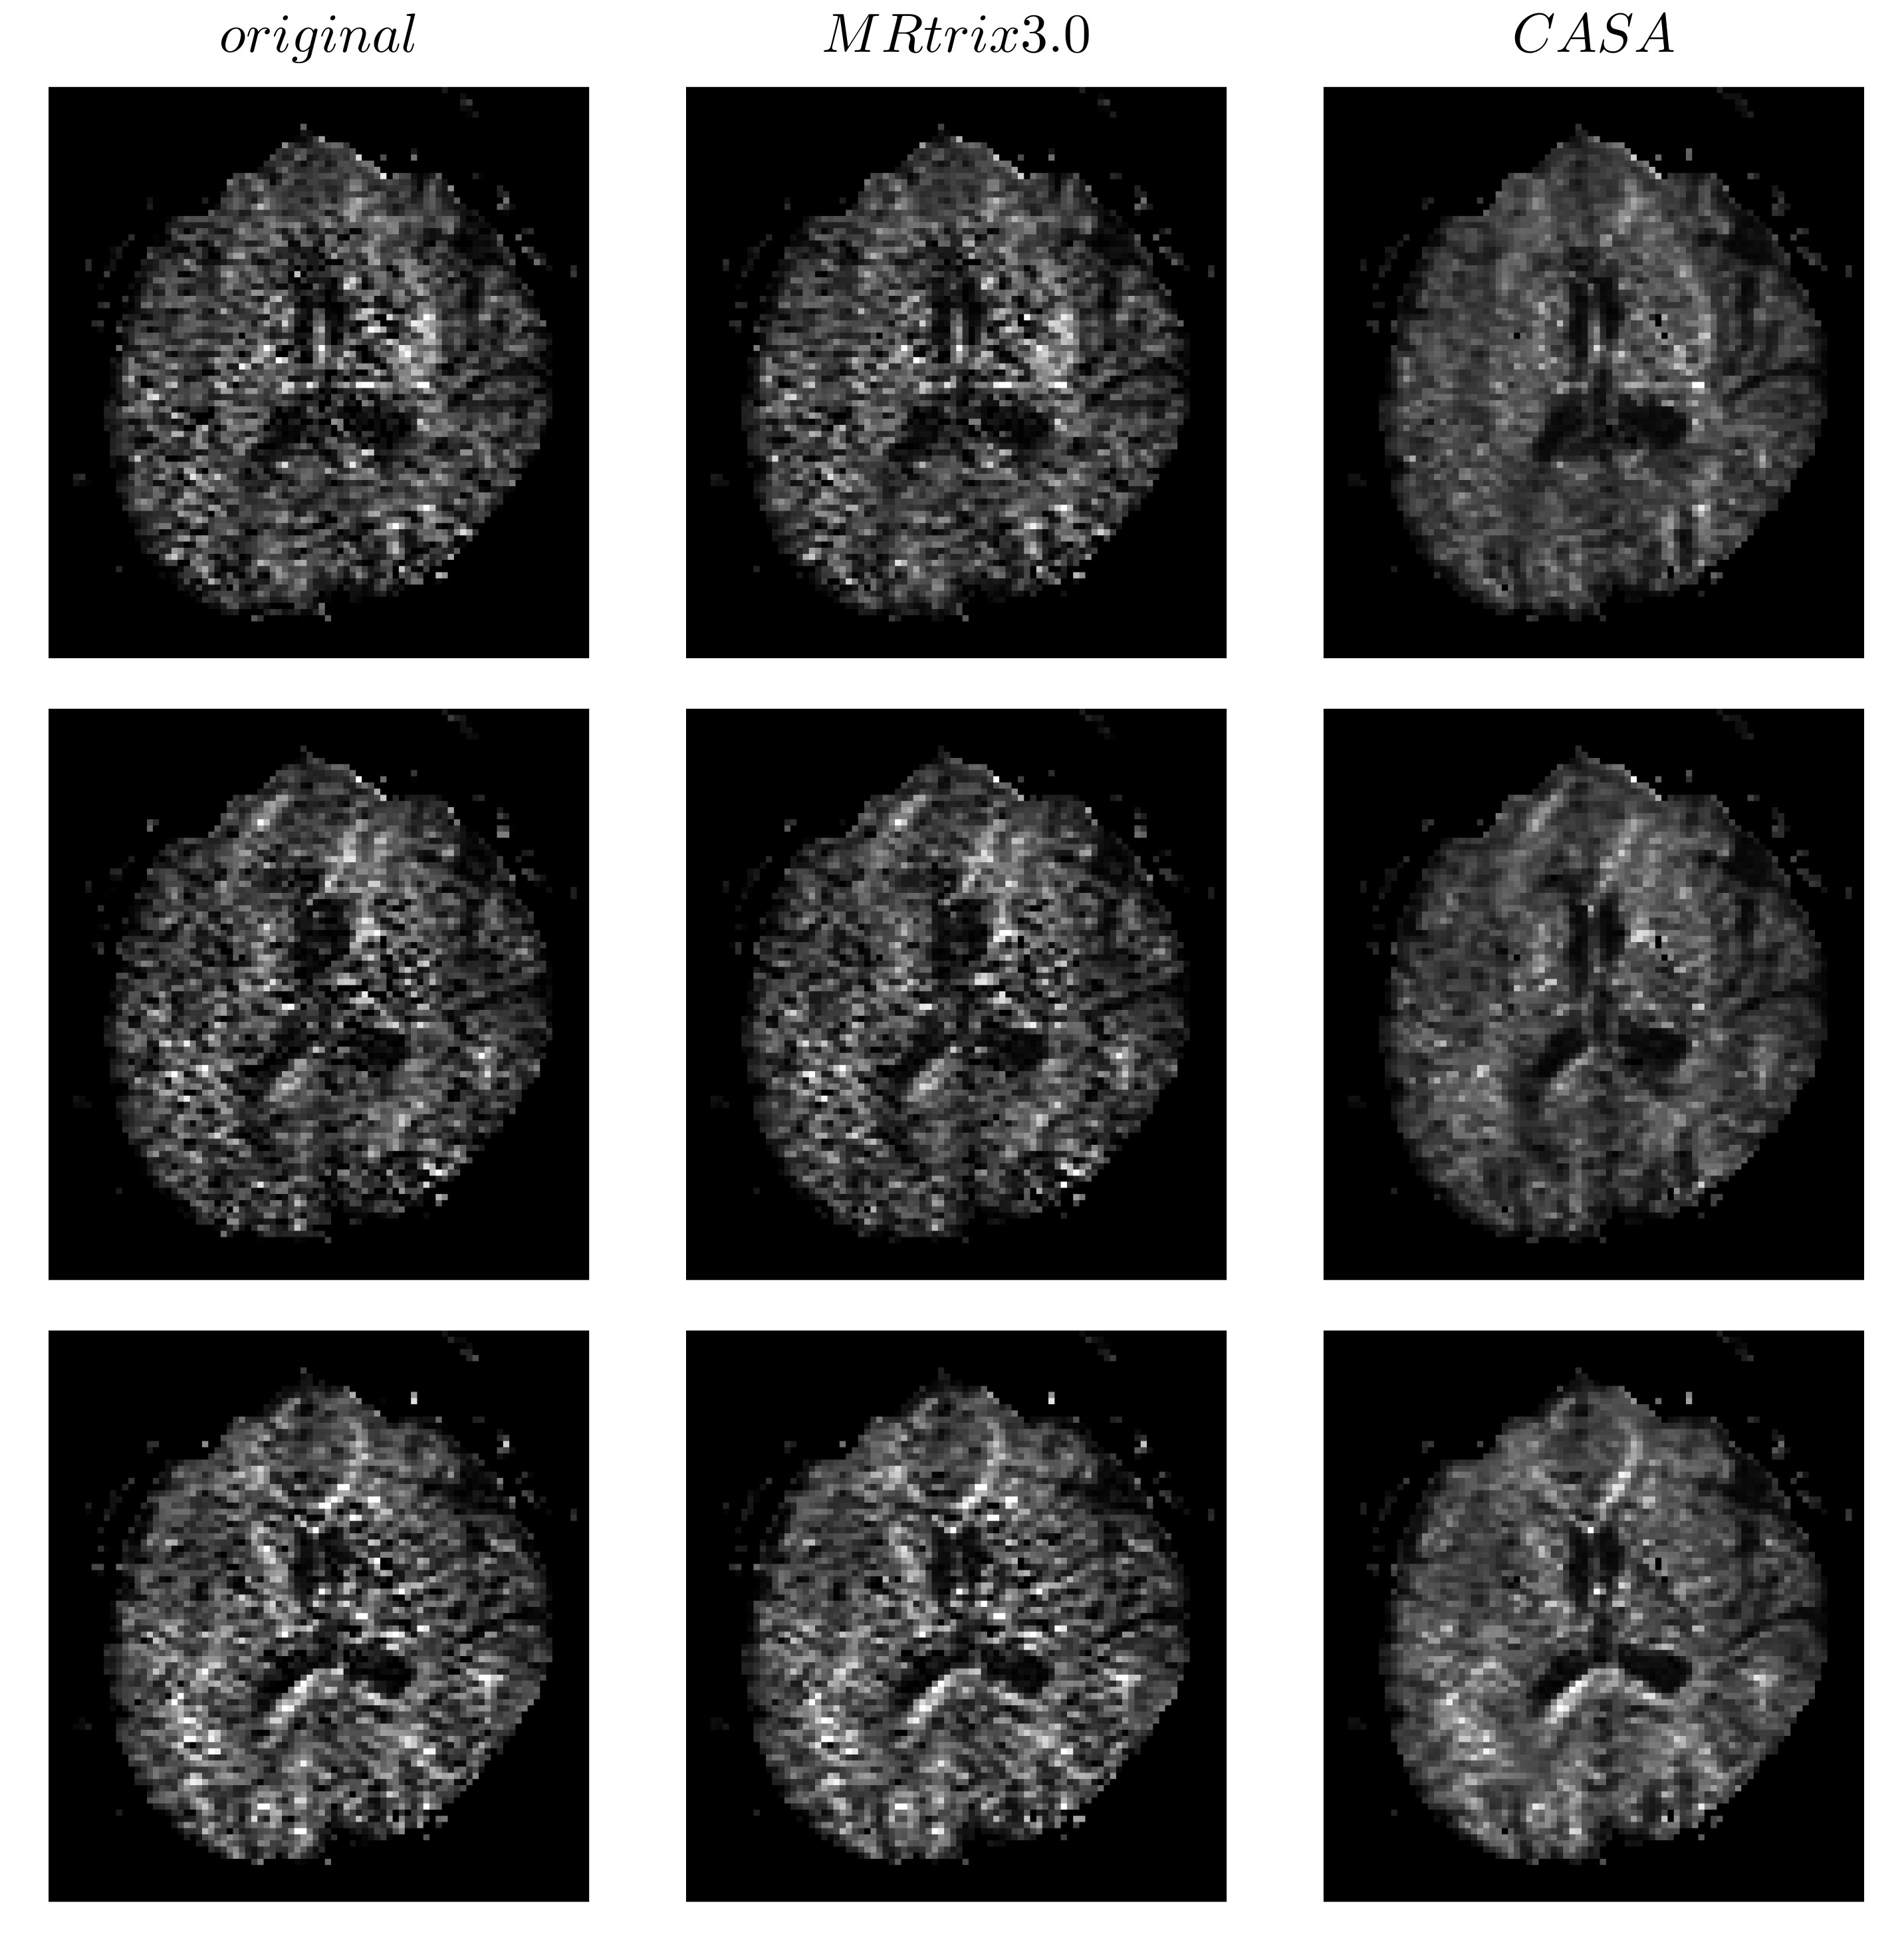
Figure 2. Three dMRI volumes of the HARDI data at b-value 2000 s/mm2. The left column shows the original data, the central column shows the data denoised using MRtrix 3.0, and the right column the data denoised using the CASA.
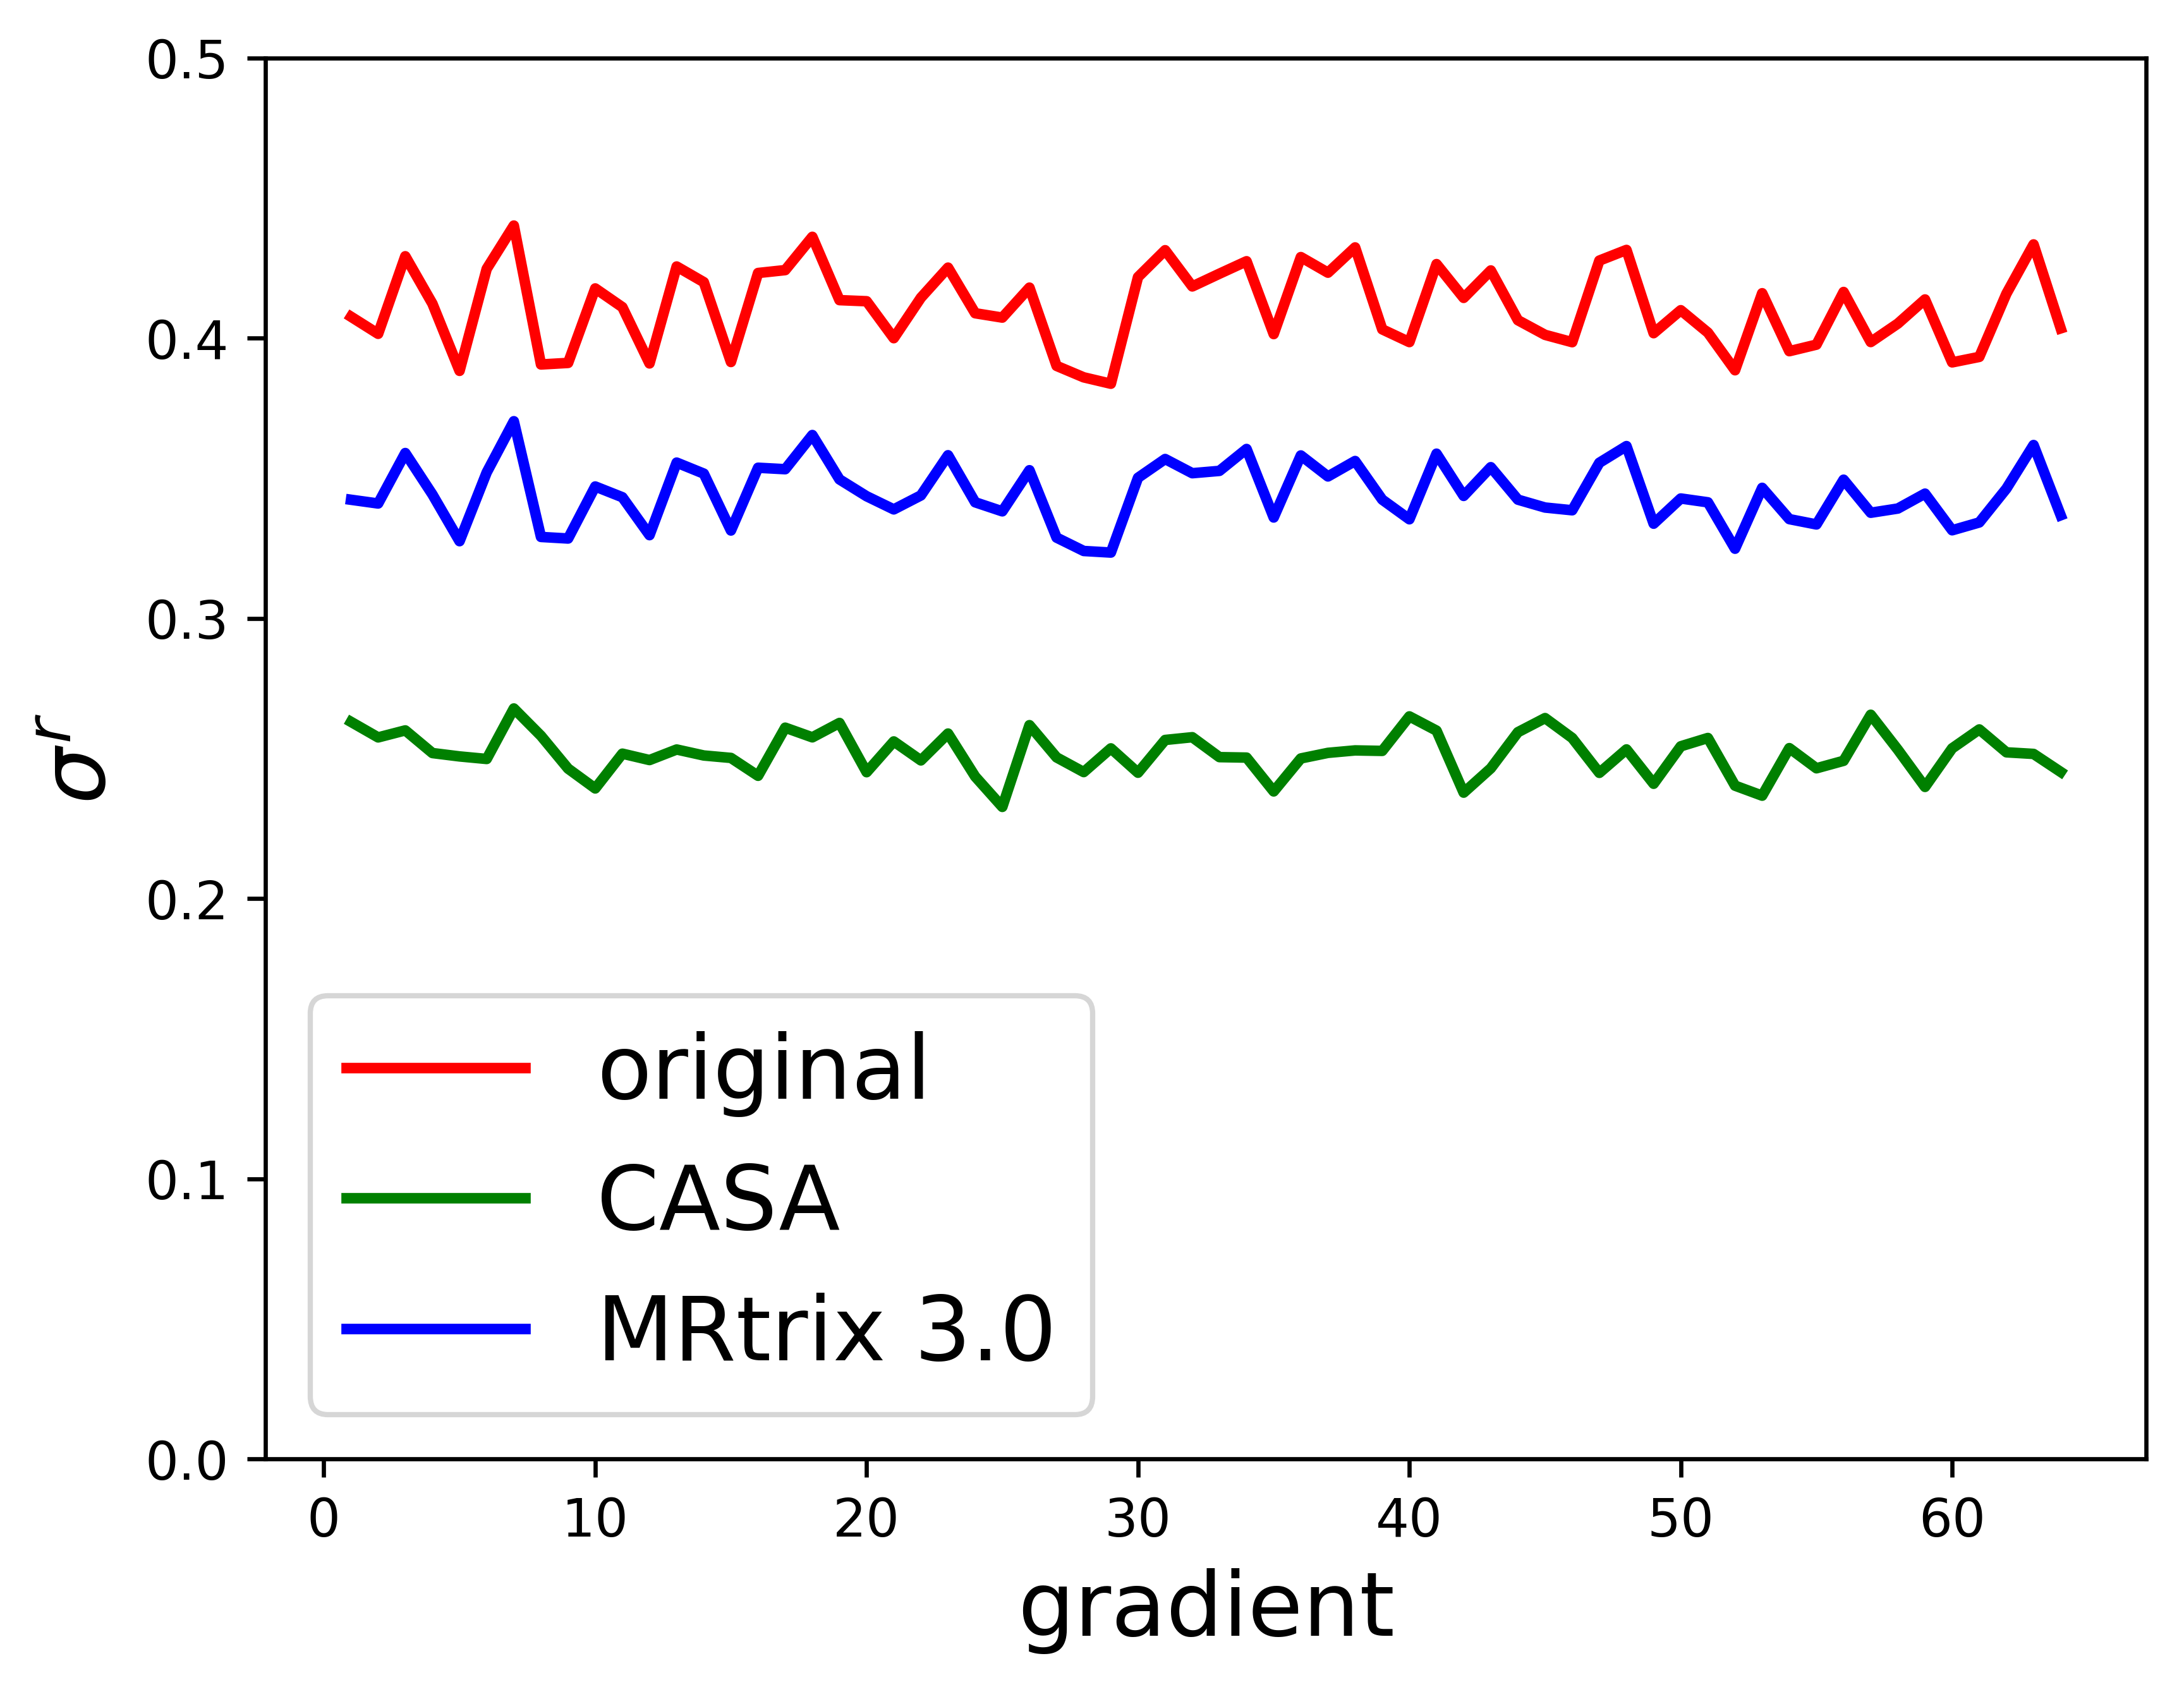
Figure 3.CASA rates σr calculated on the 64 diffusion gradients of the HARDI data, before denoising (red line), denoised with MRtrix (blue line), and denoised with CASA (green line).
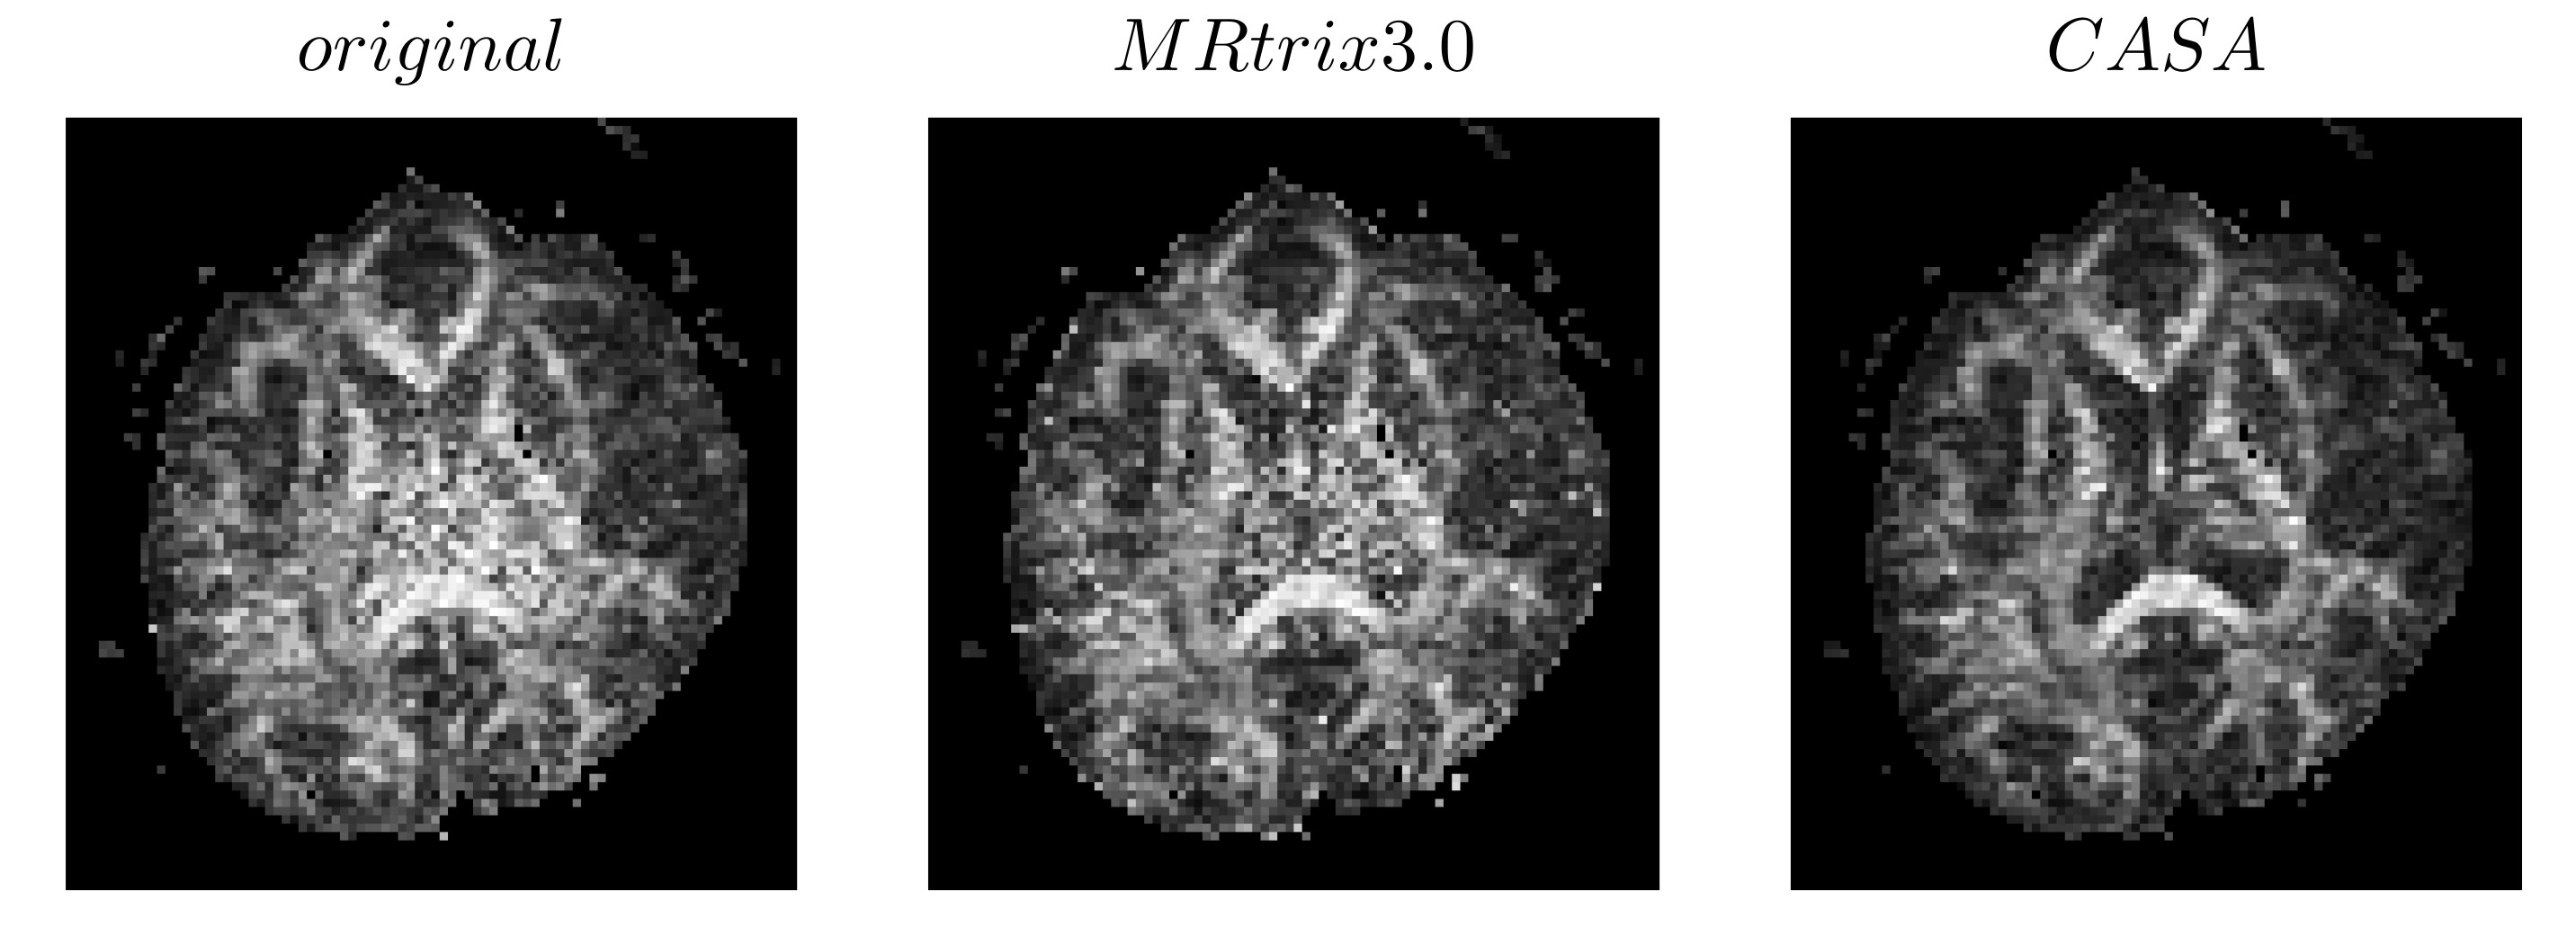
Figure 4. Fractional Anisotropy calculated on the original data (left), on the data denoised using MRtrix 3.0 (central), and on the data denoised using CASA (right).
DOI: https://doi.org/10.58530/2023/1136