1134
Mapping the myelin bilayer with short-T2 MRI: Translation to in vivo application1Institute for Biomedical Engineering, ETH Zurich and University of Zurich, Zurich, Switzerland, 2Department of Neuroradiology, Clinical Neuroscience Center, University Hospital Zurich, University of Zurich, Zurich, Switzerland
Synopsis
Keywords: White Matter, Multiple Sclerosis, Myelin imaging
Direct access to myelin content through the detection of signals from the myelin lipid-protein bilayer can be achieved using advanced short-T2 techniques. Here, we translate an existing procedure for mapping the myelin bilayer ex vivo to in vivo human application. Myelin maps are generated by fitting a three-component complex model to multi-TE (20–800µs) data acquired using the HYFI variant of the zero-TE sequence. The presented myelin maps exhibit expected white/grey matter contrast and are of reasonable quality. The step to in vivo represents an important advancement for myelin bilayer mapping as a promising emerging technique.
Introduction
Myelin is a lipid-rich tissue surrounding axons that facilitates efficient signal transmission between neurons. Diseases in which the integrity of myelin is compromised, such as multiple sclerosis,1 pose a substantial clinical burden. Quantitative mapping of myelin content is desirable for monitoring of demyelinating disorders and to aid the development of therapies aimed at regenerating myelin.Several techniques to map myelin content through the detection of myelin-related water signals have been proposed.2-4 In parallel, myelin imaging techniques based around the detection of rapidly decaying signals from non-aqueous protons in the myelin lipid-protein bilayer have been developed.5-11 Because of their more direct access to myelin, bilayer-based methods may potentially complement or even outperform water-based methods.
Recently, using a dedicated short-T2 system capable of imaging samples with T2s down to 10µs at high resolution,12 myelin bilayer content in brain tissue has been successfully mapped ex vivo by fitting a three-component complex model to multi-TE data acquired using single-point imaging (SPI).11,13,14 With SPI, each k-space point is acquired at the same time TE after RF excitation;15,16 thus, each reconstructed image accurately reflects the signal state at the respective TE. However, SPI is time consuming and SNR inefficient, rendering it unsuitable in vivo.
In this work, we translate the methods of the aforementioned ex vivo myelin bilayer mapping studies to in vivo application in the human brain, which is achieved by using the zero-TE17 sequence with hybrid filling (HYFI).18 The presented myelin mapping procedure offers unique insight into myelin content in in vivo human brain and holds the potential to yield high myelin specificity.
Methods
Due to the extremely rapid decay of myelin bilayer signals (75% have T2s <100µs),11 imaging of the myelin bilayer relies on advanced short-T2 methodology and hardware enabling early detection and fast encoding of signals. We utilised a 3T Philips Achieva system equipped with a custom-built gradient capable of >200mT/m gradient strength at 100% duty cycle,19 a 1H-free birdcage coil,20 and fast, high-power transmit/receive switches.21The head of a healthy 54-year-old male was imaged using a protocol of 11 images at TEs ranging from 20–800µs with a total scan time of 1.5 hours. Details can be found in Table 1.
With HYFI, the dead-time (DT) data gap in central k-space characteristic to the zero-TE sequence is filled with additional acquisitions, and the exact acquisition geometry is determined by how much signal decay is permitted within the gap. The acquisition geometry (represented by the time evolution across k-space) for the present protocol is shown in Figure 1; note that with SPI, the acquisition geometry would correspond to horizontal lines at TE=DT.
The images were reconstructed separately for each of the coil channels to matrix N=186 including a cosine k-space filter of periodicity 2N, quadrature-combined, 3D rigid-body registered, and bias corrected.22 For display, the images were interpolated to 3N voxels.
The components of the signal model used for fitting were chosen based on recommendations from ex vivo studies13 and were as follows (adopting the interpretation from the studies):
- Myelin: Super-Lorentzian lineshape23,24 with ultrashort T2,min of 5.5µs and a chemical shift of 1.1ppm.
- Residual short-T2 content: Super-Lorentzian lineshape with short T2,min of 100µs and a chemical shift of 2.1ppm.
- Water: Lorentzian lineshape with T2 of 50ms and a chemical shift of 4.7ppm.
Results
Figure 2 displays a subset of images from the multi-TE protocol for three different slices. The decay of short-T2 signals can be observed as a change in intensity and contrast at longer TEs.Figure 3 shows example complex data, averaged over multiple voxels in a white matter region, and corresponding fit.
In Figure 4, fitted amplitude maps of the signal components are displayed. As expected, the myelin map exhibits highest intensity in white matter, lower intensity in grey matter, and practically no signal in cerebrospinal fluid. In contrast, the map of residual short-T2 content does not exhibit differences between white and grey matter.
Discussion
The data acquisition and processing strategies employed in this work, including rapid encoding of ultrashort-T2 signals and separation of the residual short-T2 component, offer advantages regarding myelin specificity compared to previous approaches.The main constraint on the imaging protocol concerns scan time, although it is expected that further optimisation will ease this constraint. Compared to the ex vivo protocol,13 fewer and a narrower spread of TEs are employed.
Because of the time evolution across k-space in the HYFI sequence, each reconstructed image does not accurately represent the signal state at a single time. However, for the fitting, each image must be assigned a time value. The impact of this approximation on the fitting results requires further consideration, but the observed fit quality indicates that the proposed setting (see Figure 1) is reasonable.
Conclusion
The in vivo myelin mapping procedure presented here shows promising preliminary results. It is expected that with further optimisation of the protocol and data processing pipeline, as well as testing in more volunteers and patients with demyelinating diseases, the technique has the potential to provide important information in both research and clinical settings.Acknowledgements
No acknowledgement found.References
1. Love S. Demyelinating diseases. J Clin Pathol. 2006;59:1151-1159.
2. Laule C, Vavasour IM, Kolind SH et al. Magnetic Resonance Imaging of Myelin. Neurotherapeutics. 2007;4:460-484.
3. Piredda GF, Hilbert T, Thiran J-P, Kober T. Probing myelin content of the human brain with MRI: A review. Magn Reson Med. 2021;85:627-652.
4. Varma G, Duhamel G, de Bazelaire C, Alsop DC. Magnetization Transfer from Inhomogeneously Broadened Lines: A Potential Marker for Myelin. Magn Reson Med. 2015;73:614-622.
5. Nayak KS, Pauly JM, Gold GE, Nishimura DG. Imaging Ultra-Short T2 Species in the Brain. In Proceedings of the ISMRM 8th Scientific Meeting & Exhibition, Denver, USA, 2000. p.509.
6. Waldman A, Rees J, Brock C, Robson M, Gatehouse P, Bydder G. MRI of the brain with ultra-short echo-time pulse sequences. Neuroradiology. 2003;45:887-892.
7. Wilhelm MJ, Ong HH, Wehrli SL et al. Direct magnetic resonance detection of myelin and prospects for quantitative imaging of myelin density. Proc Natl Acad Sci. 2012;109:9605-9610.
8. Du J, Ma G, Li S et al. Ultrashort echo time (UTE) magnetic resonance imaging of the short T2 components in white matter of the brain using a clinical 3T scanner. NeuroImage. 2014;87:32-41.
9. Seifert AC, Li C, Wilhelm MJ, Wehrli SL, Wehrli FW. Towards quantification of myelin by solid-state MRI of the lipid matrix protons. NeuroImage. 2017;163:358-367.
10. Boucneau T, Cao P, Tang S et al. In Vivo Characterization of Brain Ultrashort-T2 Components. Magn Reson Med. 2018;80:726-735.
11. Weiger M, Froidevaux R, Baadsvik EL, Brunner DO, Rösler MB, Pruessmann KP. Advances in MRI of the myelin bilayer. NeuroImage. 2020;217:116888.
12. Froidevaux R, Weiger M, Rösler MB et al. High-resolution short-T2 MRI using a high-performance gradient. Magn Reson Med. 2020;84:1933-1946.
13. Baadsvik EL, Weiger M, Froidevaux R, Faigle W, Ineichen BV, Pruessmann KP. Mapping the myelin bilayer with short-T2 MRI: Methods validation and reference data for healthy human brain. Magn Reson Med. 2022. doi: https://doi.org/10.1002/mrm.29481.
14. Baadsvik EL, Weiger M, Froidevaux R, Faigle W, Ineichen BV, Pruessmann KP. Mapping myelin content in ex-vivo MS brain tissue using short-T2 MRI of the lipid-protein bilayer. In Proceedings of the ISMRM & SMRT Annual Meeting & Exhibition, 2021. p.2827.
15. Emid S, Creyghton JHN. High resolution NMR imaging in solids. Physica B+C. 1985;128:81-83.
16. Mastikhin IV, Balcom BJ. Centric SPRITE MRI of biomaterials with short T2. In: John Wiley & Sons L, editor. eMagRes. Volume 1. Chichester, United Kingdom; 2012. p 783-788.
17. Weiger M, Pruessmann KP. MRI with Zero Echo Time. In: eMagRes. Volume 1. Chichester, UK: John Wiley & Sons; 2012. p 311-322.
18. Froidevaux R, Weiger M, Rosler MB, Brunner DO, Pruessmann KP. HYFI: Hybrid filling of the dead-time gap for faster zero echo time imaging. NMR Biomed. 2021;34:e4493.
19. Weiger M, Overweg J, Rösler MB et al. A High-Performance Gradient Insert for Rapid and Short-T2 Imaging at Full Duty Cycle. Magn Reson Med. 2018;79:3256-3266.
20. Rösler MB, Weiger M, Brunner DO, Schmid T, Froidevaux R, Pruessmann KP. An RF birdcage coil designed for an insert gradient coil dedicated to short-T2 MRI. In Proceedings of the ISMRM 25th Annual Meeting & Exhibition and SMRT 26th Annual Meeting, Honolulu, Hawaii, USA, 2017. p.2668.
21. Schildknecht CM, Weiger M, Froidevaux R, Pruessmann KP. Rapid high power transmit-receive switching using a timed cascade of PIN diodes. In Proceedings of the ISMRM & SMRT Annual Meeting & Exhibition, 2021. p.1411.
22. The Wellcome Centre for Human Neuroimaging. Statistical Parametric Mapping (SPM) 12. London, UK: UCL Queen Square Institute of Neurology. https://www.fil.ion.ucl.ac.uk/spm/software/spm12/.
23. Bloom M, Burnell EE, Valic MI, Weeks G. Nuclear magnetic resonance line shapes in lipid bi-layer model membranes. Chem Phys Lipids. 1975;14:107-112.
24. Wennerström H. Proton nuclear magnetic resonance lineshapes in lamellar liquid crystals. Chem Phys Lett. 1973;18:41-44.
Figures
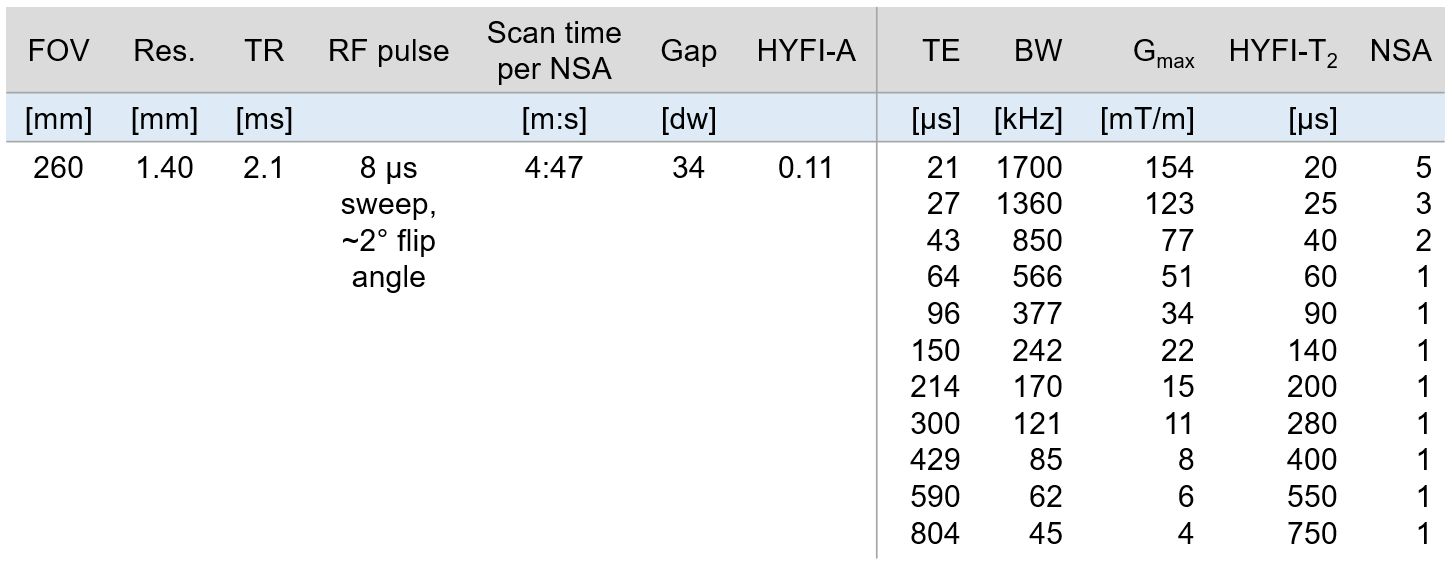
Table 1: Parameters of the imaging protocol. “Gap” refers to the radius of the dead-time (DT) gap (in Nyquist dwells, dw), which in HYFI is filled by additional acquisitions. The HYFI parameters HYFI-A (amplitude coefficient) and HYFI-T2 (target T2) control how much signal decay is permitted within the gap and thus determine the acquisition geometry within the gap (see Figure 1). Because signals with shorter T2s die out over time, we set HYFI-T2=DT. Abbreviations: Res., nominal 3D isotropic resolution; NSA, number of signal averages; BW, image bandwidth; Gmax, max. gradient strength.
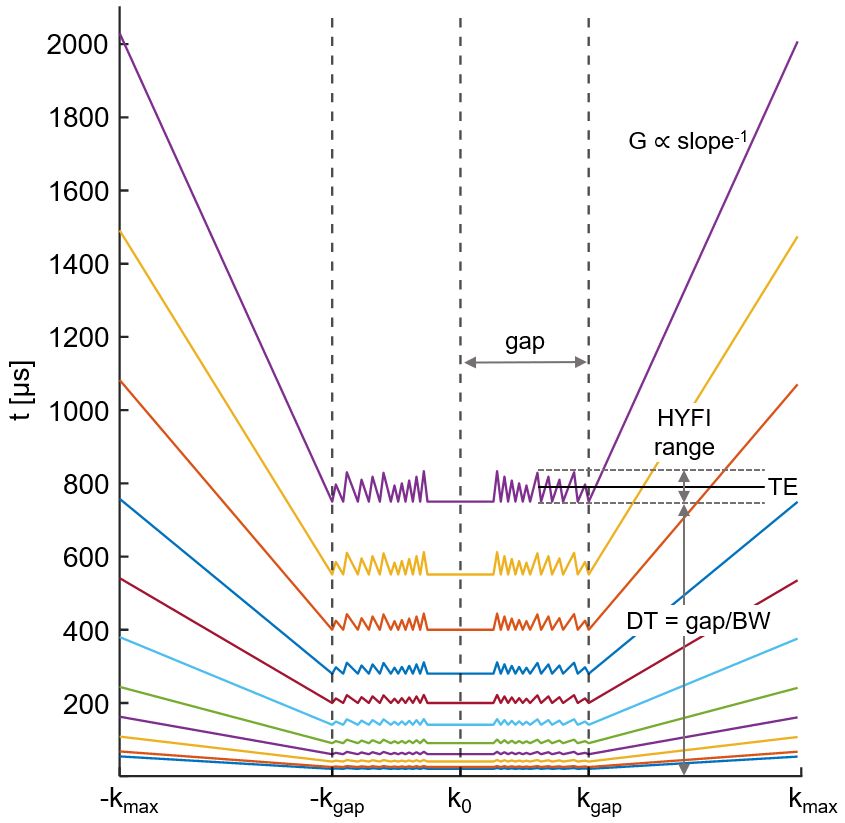
Figure 1: k-Space acquisition pattern (1D) as a function of time after RF excitation. Within the dead-time (DT) gap, the k-space core is sampled with SPI while the remainder of the gap is sampled using many radial acquisitions (gradient strength G<Gmax). Outside the gap, a regular zero-TE radial acquisition is performed (G=Gmax). Longer readouts are accepted for larger TEs, assuming that relatively short-T2 signals have died out. Radial acquisitions (frequency encoding) reduce scan time compared to SPI (phase encoding). The definition of TE is demonstrated for the TEmax image.
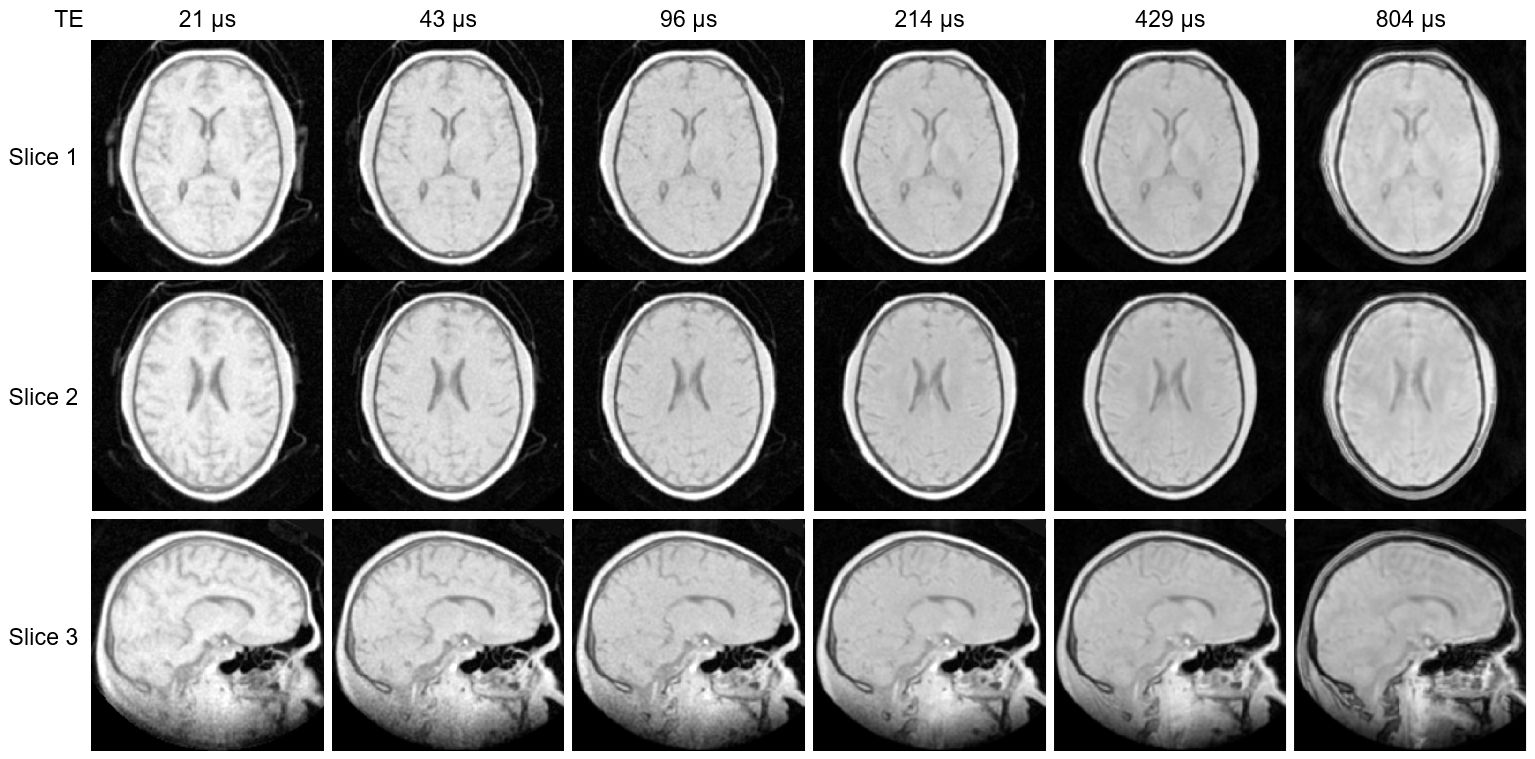
Figure 2: Subset of the full multi-TE image series showing three slices of the 3D images (two axial, one sagittal). All images have the same colour scale. The intensity and contrast change with increasing TE as short-T2 signals decay. The overall image quality is good. Short-T2 signals from the inflatable head support (CRANIA, Pearl Technology, Switzerland) are visible outside the head, particularly in the shortest-TE images.
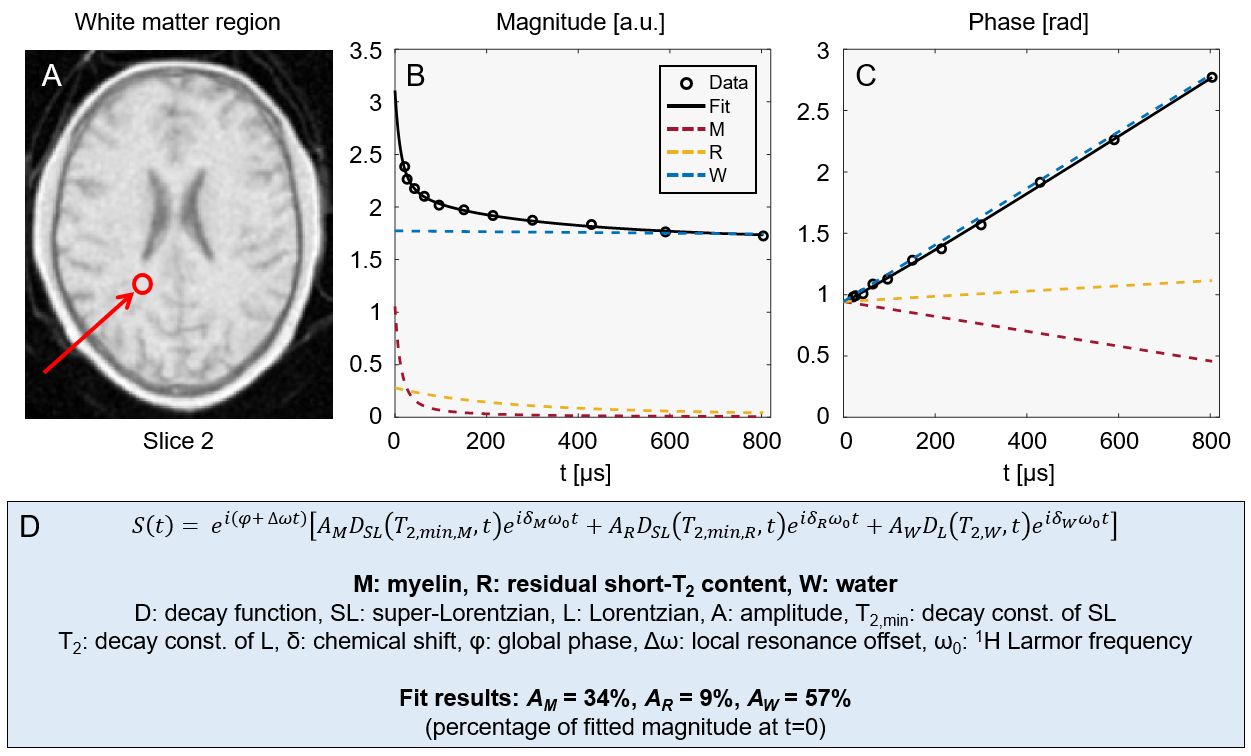
Figure 3: Example fit to averaged signals from a cluster of white matter voxels (location indicated in panel A). The magnitude (B) and phase (C) behaviour of the signal is shown together with the contributions of each fitted signal component. The magnitude evolution shows rapid initial decay (M-comp.) followed by less rapid decay (R-comp.) before converging to the water level (W-comp.). The phase evolution is close to linear due to the dominant contribution of water. Panel D contains an expression for the fitted signal model as well as the relative component amplitudes found by the fit.
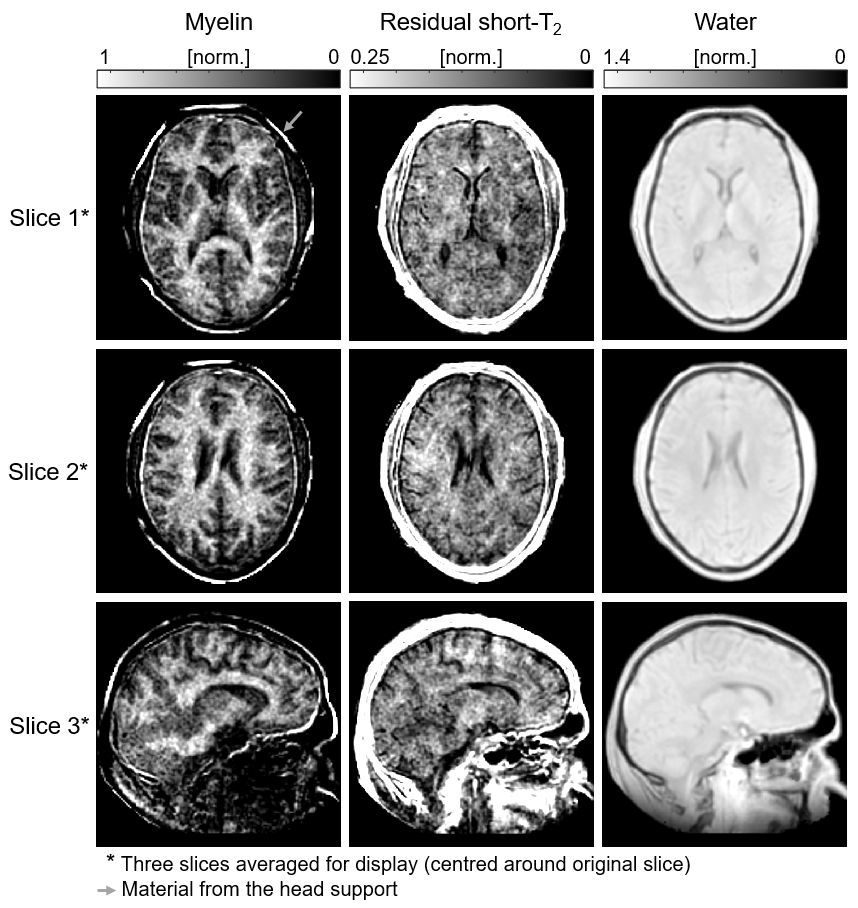
Figure 4: Amplitude maps of the three signal components for the image slices shown in Figure 2. All images are masked based on the head outline in the water map. The myelin component exhibits large amplitudes in white matter, low amplitudes in grey matter and practically no signal from cerebrospinal fluid (CSF). The residual short-T2 component does not differentiate between white and grey matter, but CSF is also here void of signal. The water map shows higher signal in grey than in white matter, indicating that the larger water content dominates the effect of relatively low T1 weighting.