1133
Cross-subject variability of the optic radiation anatomy: a large-scale analysis1BAOBAB, NeuroSpin, Université Paris-Saclay, CNRS, CEA, Gif-sur-Yvette, France, 2AP-HP, Epilepsy Unit, GH Pitié-Salpêtrière-Charles Foix, Paris, France, 3Sorbonne Université, Paris, France
Synopsis
Keywords: White Matter, Brain
Optic radiations are tracts of importance for neurosurgery, especially their path within the temporal lobe. Using an advanced analysis pipeline relying on probabilistic tractography and fiber clustering, we processed the diffusion MRI data of the 1065 subjects of the HCP cohort and reconstructed a reference optic radiation bundle. From it, we subsequently extracted the optic radiations of each subject to study the variability of their morphometry. We identified a higher variability of their rostral extent, with a significant left-right difference (median distance to the temporal pole +/- standard deviation: left: 28.8 +/- 2.3 mm, right: 29.2 +/- 2.1 mm, p=1.10-8).Introduction
Optic radiations are tracts of particular interest for neurosurgery, especially for temporal lobe resection, because their lesion is responsible for visual field defects. However, histological and MRI studies suggested a high cross-subject variability of their anatomy, especially for their most anterior extent within the temporal lobe. We therefore aimed to better assess this cross-subject morphometric variability in a large cohort of healthy subjects.Method
Cohort and imaging protocol - We exploited the large brain MRI dataset available from the Human Connectome Project 1, corresponding to acquisitions on a cohort of 1065 healthy subjects aged from 22 to 35 years performed on a Connectome Skyra 3T MRI system. The following sequences were performed for each subject: an anatomical T1-weighted acquisition using a 3D MPRAGE sequence (0.7 mm isotropic spatial resolution, TR/TE=2400/2.14 ms) and series of diffusion-weighted MRI (dMRI) sequences using a 2D spin-echo single-shot multiband EPI sequence (multi-band factor of 3, monopolar diffusion gradient pulses, 1.25 mm isotropic spatial resolution, TR/TE=5500/89.50 ms) over 3 shells at b=1000/2000/3000 s/mm2, along 90 diffusion sampling directions for each shell, as well as 6 non-diffusion-weighted (b=0 s/mm2) reference images. The data were preprocessed with eddy current and susceptibility artifacts correction steps.Individual data processing - We designed an analysis pipeline for diffusion-weighted MRI data processing (figure 1) based on the Ginkgo toolbox developed by the CEA/NeuroSpin team and available at https://framagit.org/cpoupon/gkg. This pipeline performed several successive steps for each of the 1065 subject: registration of the subject’s brain MRI to a common atlas space (the MNI ICBM 2009c non-linear asymmetric template) with the ANTS (Advanced Normalization Tools) toolbox 2,3 using the anatomical T1-weighted acquisition ; computation of the diffusion Orientation Distribution Functions (ODF) with the analytical Q-ball model 4 ; computation of a whole-brain tractography with a probabilistic algorithm 5 (parameters: 8 seeds/voxel, aperture angle: 30°, fiber length range: 1.25 – 300 mm, integration step: 0.3 mm, temperature of the Gibb’s sampler: 1) ; and intra-subject fiber clustering using a hierarchical algorithm 6,7 which groups fibers according to their geometrical properties: anatomical regions (left hemisphere, right hemisphere, interhemispheric or cerebellar), fiber lengths, voxels crossed, and fibers extremities.
Group analysis - We performed a cross-subject fiber clustering on the 1065 subjects’ fiber clusters, using the HDBscan algorithm 8 (parameters: normalization factor: 6, neighbor count: 5, minimum cluster size: 10, minimum subject percentage: 2.5 %). From this, we extracted a reference optic radiation bundle by ROI selection, which was then manually curated to remove artifactual tracts. This reference bundle enabled us to extract the corresponding optic radiations of each subject from his probabilistic tractography, using a minimum pairwise distance algorithm.
Anatomical measurements - The rostral tip of the temporal pole (TP) and the rostral tip of the temporal horn of the lateral ventricle (TH) were delineated for both hemispheres from the T1-weighted MNI ICBM 2009c non-linear asymmetric template by a trained neuro-anatomist. The rostral tip of the optic radiation (OR) was automatically labeled for each subject, and the distances between those points were measured on the sagittal plane (figure 2).
Results
The optic radiations were successfully identified in 100% of the subjects for both sides. The median distance between OR and TP was 28.8 mm (standard deviation SD: 2.3 mm ; mean: 28.7 mm ; range: 17.0 - 36.2 mm) for the left hemisphere and 29.2 mm (SD: 2.1 mm ; mean: 29.2 mm ; range: 20.6 - 35.8 mm) for the right hemisphere (figure 3). The difference between hemispheres was statistically significant (p=1.10-8). The median distance between OR and TH was [-1.2 mm] (SD: 2.3 mm) for the left hemisphere and [-0.8 mm] (SD: 2.1 mm) for the right hemisphere (p=1.10-8). This distance was negative if the optic radiation extended rostrally to the temporal horn, which was found in 771 subjects (72%) for the left side and 690 (65%) for the right side.Discussion
Our results are consistent with post-mortem studies: the two largest dissection studies, performed on respectively 20 9 and 25 human brains 10, found a mean OR-TP distance of 28.4 mm (range: 20 - 33 mm) and 27 mm (SD: 3.5 mm). Prior brain MRI tractography studies found various results depending on the hardware and method used, and the mean TP-OR distance ranged, in between studies, from 26.4 mm 11 to 44 mm 12. Among them, one study directly compared the different methods and found more consistent results with a probabilistic algorithm than with a deterministic algorithm 13 (mean OR-TP distance: 33 mm for probabilistic algorithm versus 44 mm for deterministic algorithm). Moreover, the optic radiations identified on the probabilistic tractographies matched the ones identified by dissection of the same brains 13.We found a statistically significant difference between left and right optic radiations (p=1.10-8), with a more rostral extent for the left side. Such a difference was previously reported in other studies 14,15, and may explain the higher risk of postoperative visual defects after left-sided temporal brain surgeries 16.
Conclusion
We confirmed a high cross-subject variability in the rostral extent of the optic radiations and a side-to-side physiological variability, which is of great importance for temporal lobe surgery. These results highlight the importance of performing individual diffusion MRI tractography with appropriate methodology before neurosurgery.Acknowledgements
Data collection and sharing for this project was provided by the Human Connectome Project (HCP; Principal Investigators: Bruce Rosen, M.D., Ph.D., Arthur W. Toga, Ph.D., Van J. Weeden, MD). HCP funding was provided by the National Institute of Dental and Craniofacial Research (NIDCR), the National Institute of Mental Health (NIMH), and the National Institute of Neurological Disorders and Stroke (NINDS). HCP data are disseminated by the Laboratory of Neuro Imaging at the University of Southern California.
Thanks to Ursi Zaiser for her help.
References
1. Van Essen, D. C. et al. The WU-Minn Human Connectome Project: an overview. NeuroImage 80, 62–79 (2013).2. Avants, B. B. et al. A reproducible evaluation of ANTs similarity metric performance in brain image registration. NeuroImage 54, 2033–2044 (2011).
3. Avants, B. B., Epstein, C. L., Grossman, M. & Gee, J. C. Symmetric diffeomorphic image registration with cross-correlation: evaluating automated labeling of elderly and neurodegenerative brain. Med. Image Anal. 12, 26–41 (2008).
4. Descoteaux, M., Angelino, E., Fitzgibbons, S. & Deriche, R. Regularized, fast, and robust analytical Q-ball imaging. Magn. Reson. Med. 58, 497–510 (2007).
5. Koch, M. A., Norris, D. G. & Hund-Georgiadis, M. An Investigation of Functional and Anatomical Connectivity Using Magnetic Resonance Imaging. NeuroImage 16, 241–250 (2002).
6. Guevara, P. et al. Inference of a HARDI fiber bundle atlas using a two-level clustering strategy. Med. Image Comput. Comput.-Assist. Interv. MICCAI Int. Conf. Med. Image Comput. Comput.-Assist. Interv. 13, 550–7 (2010).
7. Guevara, P. et al. Automatic fiber bundle segmentation in massive tractography datasets using a multi-subject bundle atlas. Neuroimage vol. 61 1083–99 (2012).
8. Campello, R. J. G. B., Moulavi, D. & Sander, J. Density-Based Clustering Based on Hierarchical Density Estimates. in Advances in Knowledge Discovery and Data Mining (eds. Pei, J., Tseng, V. S., Cao, L., Motoda, H. & Xu, G.) 160–172 (Springer, 2013). doi:10.1007/978-3-642-37456-2_14.
9. Párraga, R. G., Ribas, G. C., Welling, L. C., Alves, R. V. & de Oliveira, E. Microsurgical anatomy of the optic radiation and related fibers in 3-dimensional images. Neurosurgery 71, 160–171; discussion 171-172 (2012).
10. Ebeling, U. & Reulen, H.-J. Neurosurgical topography of the optic radiation in the temporal lobe. Acta Neurochir. (Wien) 92, 29–36 (1988).
11. Shan, Y.-Z. et al. Automatic labeling of the fanning and curving shape of Meyer’s loop for epilepsy surgery: an atlas extracted from high-definition fiber tractography. BMC Neurol. 19, 302 (2019).
12. Nilsson, D. et al. Intersubject variability in the anterior extent of the optic radiation assessed by tractography. Epilepsy Res. 77, 11–16 (2007).
13. Lilja, Y. et al. Visualizing Meyer’s loop: A comparison of deterministic and probabilistic tractography. Epilepsy Res. 108, 481–490 (2014).
14. James, J. S. et al. Diffusion tensor imaging tractography of Meyer’s loop in planning resective surgery for drug-resistant temporal lobe epilepsy. Epilepsy Res. 110, 95–104 (2015).
15. Dreessen de Gervai, P. et al. Tractography of Meyer’s Loop asymmetries. Epilepsy Res. 108, 872–882 (2014).
16. Jeelani, N. U. O. et al. ‘Hemispherical asymmetry in the Meyer’s Loop’: a prospective study of visual-field deficits in 105 cases undergoing anterior temporal lobe resection for epilepsy. J. Neurol. Neurosurg. Psychiatry 81, 985–991 (2010).
Figures
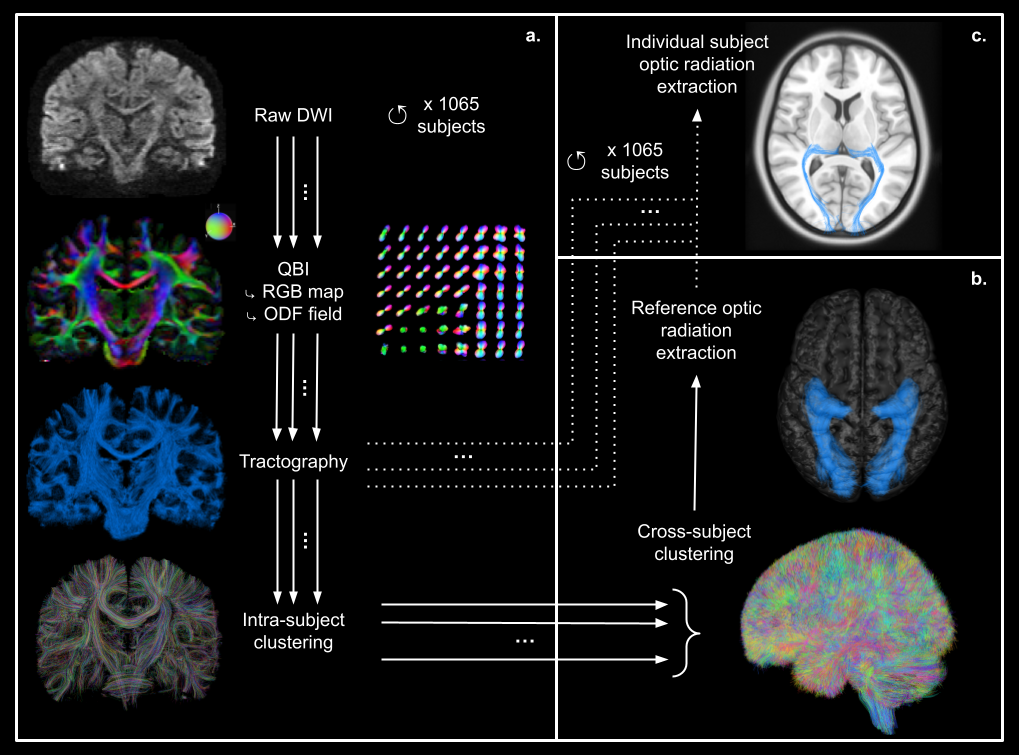
Figure 1: Diffusion analysis pipeline.
a: Individual diffusion analysis pipeline performed for each subject: raw diffusion data ➔ Q-Ball Imaging QBI (computation of RGB map and ODF field - color-coded direction: red=left-right; green=antero-posterior; blue=superior-inferior) ➔ whole-brain tractography ➔ intra-subject fiber clustering.
b: Group analysis: cross-subject fiber clustering and extraction of a reference optic radiation bundle.
c: Extraction of each subject’s individual optic radiations by applying the reference tract to the probabilistic tractography
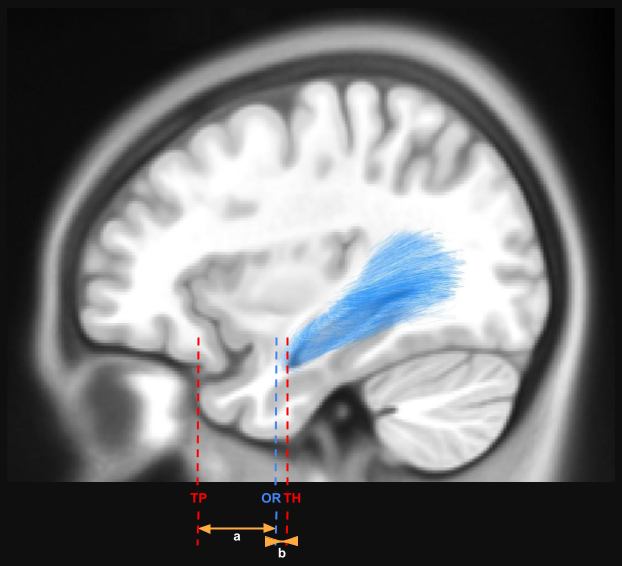
Measure of the distance (a) between the rostral ridge of the optic radiation (OR) and the rostral tip of the temporal pole (TP) and the distance (b) between the rostral ridge of the optic radiation (OR) and the rostral tip of the temporal horn of the lateral ventricle (TH).
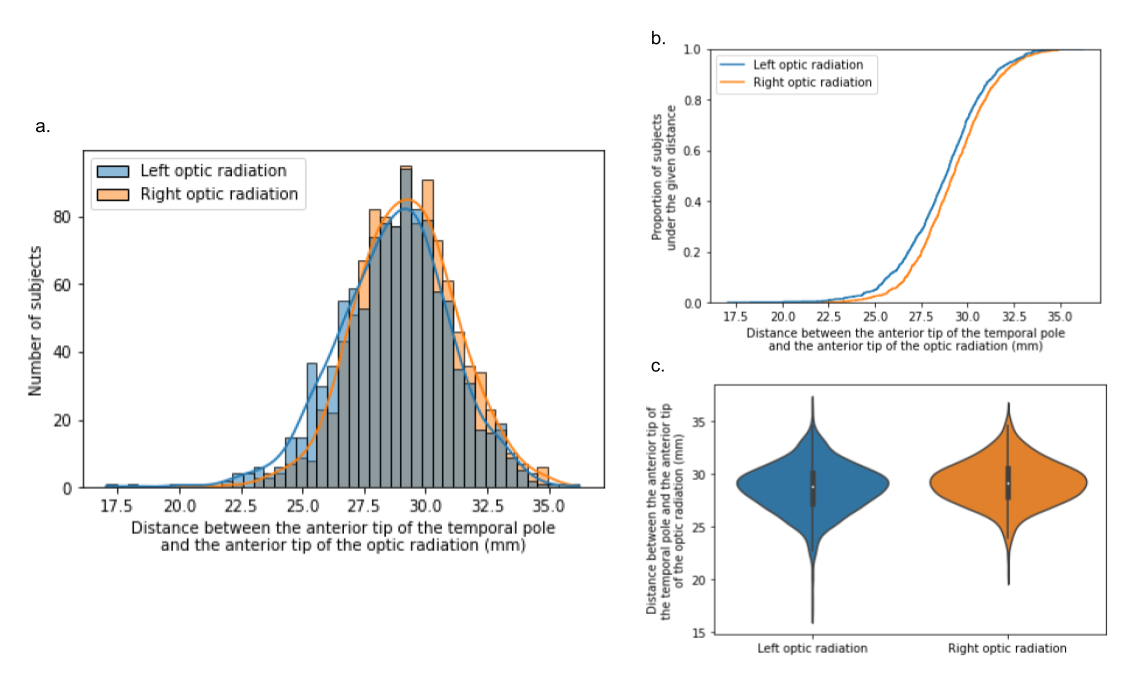
Figure 3: Distribution of the distance measures between the rostral ridge of the optic radiation and the rostral tip of the temporal pole across the whole population (1065 subjects). Blue: left hemisphere, orange: right hemisphere.
a: Histogram of the distance distribution.
b: Cumulative distribution function of the distance (proportion of subjects falling below each unique distance value).
c: Violin plot of the distance distribution (inner box: quartiles, central white dot: median value, bar: +/- 2 standard deviations)