1132
In-vivo water gap mapping as a new myelin packing marker1Edmond & Lily Safra Center for Brain Science, The Hebrew University, Jerusalem, Israel
Synopsis
Keywords: White Matter, Multiple Sclerosis, Myelin water imaging, water content
We established a new in-vivo measurement of the myelin water gap that can serve as a biomarker for myelination packing. In postmortem studies, it was shown that the water layer gap between healthy myelin membranes is compact. However, it changes during the demyelination and remyelination processes in MS patients. We developed a biophysical model based on the water fraction and multi-compartment T2 to estimate the water gap. Next, we designed a lipid phantom system with varying water gaps and validated it using Cryo-TEM. Our model successfully estimates the water gap in-vitro and shows a reliable estimation for in-vivo healthy volunteers.
Introduction
Multiple sclerosis (MS) neurological disability is caused by demyelination, axonal transection, and degeneration deficits. MS histopathology is characterized by loss of membrane adhesion, swelling across the water gaps (Fig. 1), vesiculation, and eventual disintegration of the myelin structure1,2.Myelin water imaging (MWI) is a multiexponential T2 model that estimates the fraction of the signal fraction that arises from the water trapped between the myelin membranes and that arises from other tissue water4–11. The macromolecular and lipid tissue volume (MTV), defined as 1-water fraction (WF), was shown to approximate the total myelin fraction12–14. MWI and MTV are sensitive to the reduction of myelin in MS but not to the changes in myelin organization, such as the size of the water gap between the myelin membranes. We propose a new qMRI framework that allows the estimation of the myelin water gap. Our modeling relies on multi-echo fast spin-echo (FSE) data. To validate the water gap model, we used a novel lipid phantom and tested the model’s outcome for in-vivo human data.
Methods
Membrane phantom: We developed a phantom system3,13–15 designed as multi-lamellar vesicles (MLV) of charged phosphatidylserine and phosphatidylcholine lipids that mimic the assembly of biological membranes. We suspended the membranes in NaCl solutions at different concentrations (0-500 mM) to change the water gap between the membranes (dw)15. dw decreases as a result of electrostatic screening of the membrane charge15–19 (Fig. 2).Cryogenic transmission electron microscopy (cryo-TEM): We used cryo-TEM to measure the water gap and the membrane thicknesses in the phantom system.
Human subjects: 25 young healthy volunteers aged 33 ± 7 years (10 females).
MRI: The phantoms and human subjects were scanned in a 3T Skyra Siemens scanner with a 32-channel receive head-coil for R29, R112, and WF12–14 mapping. Human brain regions were segmented using the FreeSurfer segmentation algorithm20.
Myelin water gap model: In our model, the T2 exponential decay is described as a sum of the myelin water (MW) and any other tissue water (TW) contributions multiplied by the steady-state magnetization (M0): $$$FSE(TE)=M_{o}\left(f_{MW}\cdot e^{\frac{TE}{T2_{MW}}}+f_{TW}\cdot e^{\frac{TE}{T2_{TW}}}\right)$$$, where T2MW and T2TW are the T2 of the MW and the TW respectively. The sum of the TW and MW is the total WF, estimated using the WF technique 12–14. To approximate the fraction of MW (fMW) we multiply the membrane concentration (MTV/WF) by the ratio of the water gap (dw), to the membrane thickness (dm): $$$f_{MW}=\frac{MTV}{WF}\cdot \frac{d_{w}}{d_{m}}=\frac{1-WF}{WF}\cdot \frac{d_{w}}{d_{m}}$$$
Rearranging the signal equation, we get the following dependency of the T2 multi-compartment model on the myelin water gap ratio:$$FSE(TE)=M_{0}\left[\left(\frac{1-WF}{WF}\cdot \frac{d_{w}}{d_{m}}\right)\cdot e^{-\frac{TE}{T2_{MW}}}+\left(WF-\frac{1-WF}{WF}\cdot\frac{d_{w}}{d_{m}}\right)\cdot e^{-\frac{TE}{T2_{TW}}}\right]$$
Finally, there are three unknown parameters: T2MW, T2TW and dw/dm. To fit the model, we assume that these biophysical parameters are constant across a white matter (WM) region of interest (ROI). WF is allowed to vary. Hence, we have an overdetermined system with three fitted parameters for all the voxels in the ROI, validated using cross-validation.
Results
First, we imaged the phantoms using cryo-TEM and measured the membrane and water gap sizes. The lipids’ membrane thickness was measured to be 4.5-5 nm, about the same size as the myelin membrane. The water gap between the membranes varied as salt concentration increased from ~15 nm to ~ 4 nm (Fig. 3). Since dm is relatively consistent across the myelin membrane, the ratio $$$\frac{d_{w}}{d_{m}}$$$ is a measure of the membrane packing.Second, we tested the biophysical model accuracy in fitting the data using cross-validation (Fig4a). The model cross-validation error was very low (r=0.99, p<10-2). The biophysical model characterizes the membrane packing ratio parameter (dw/dm) with high accuracy (r= 0.97, P<10-2; Fig. 4b).
Third, we assessed the membrane packing ratio in healthy young adults in four WM ROIs (lateral-occipital, superior-temporal, superior-frontal, and superior-parietal). Using cross-validation, we estimated the T2 tissue water to be T2~90 msec and the myelin water T2 values ranged between 20-40 msec (Fig. 5a) across subjects and ROIs. Importantly, these values are in agreement with the myelin water T2 previously estimated using the MWI technique21–25. All the WM areas yielded similar membrane packing ratios between 0.7-1 across all subjects and ROIs. Assuming a constant membrane thickness26 (4.5 nm), the estimated water gap thickness is between 3-4.5 nm, which is in agreement with ex-vivo and animal models estimation3,26 (Fig. 5b). Hence, both in-vitro and in-vivo data suggest that the myelin water gap mapping is feasible, consistent, and physically sound.
Conclusions
We developed a new model to study the myelination packing status in-vivo. Until now, the ratio between the water gap and membrane sizes could only be calculated in postmortem axonal analysis. Our new model allows us to estimate this ratio using clinical FSE sequence and fairly simple WF estimates12–14. Both our phantom system and in-vivo human data showed high agreement for the predicated signal and the extracted parameters (Figs. 4, 5). Hence, using well-constrained ROI-based analysis and biophysical modeling we gain new in-vivo insights regarding myelin packing.Acknowledgements
No acknowledgement found.References
1. Hafler, D. A. Multiple sclerosis. J Clin Invest 113, 788–794 (2004).
2. Ohler, B. et al. Role of lipid interactions in autoimmune demyelination. Biochimica et Biophysica Acta (BBA) - Molecular Basis of Disease 1688, 10–17 (2004).
3. Shaharabani, R. et al. Structural Transition in Myelin Membrane as Initiator of Multiple Sclerosis. J Am Chem Soc 138, 12159–12165 (2016).
4. Laule, C. & Moore, G. R. W. Myelin water imaging to detect demyelination and remyelination and its validation in pathology. Brain Pathol 28, 750–764 (2018).
5. Alonso-Ortiz, E., Levesque, I. R. & Pike, G. B. MRI-based myelin water imaging: A technical review. Magn Reson Med 73, 70–81 (2015).
6. Lee, J. et al. So You Want to Image Myelin Using MRI: An Overview and Practical Guide for Myelin Water Imaging. Journal of Magnetic Resonance Imaging 53, 360–373 (2021).
7. Nagtegaal, M. et al. Myelin water imaging from multi-echo T2 MR relaxometry data using a joint sparsity constraint. Neuroimage 219, 117014 (2020).
8. Birkl, C., Doucette, J., Fan, M., Hernández-Torres, E. & Rauscher, A. Myelin water imaging depends on white matter fiber orientation in the human brain. Magn Reson Med 85, 2221–2231 (2021).
9. Ben-Eliezer, N., Sodickson, D. K. & Block, K. T. Rapid and accurate T2 mapping from multi-spin-echo data using bloch-simulation-based reconstruction. Magn Reson Med 73, 809–817 (2015).
10. Omer, N., Galun, M., Stern, N., Blumenfeld-Katzir, T. & Ben-Eliezer, N. Data-driven algorithm for myelin water imaging: Probing subvoxel compartmentation based on identification of spatially global tissue features. Magn Reson Med 87, 2521–2535 (2022).
11. Shepherd, T. M. et al. New rapid, accurate T2 quantification detects pathology in normal-appearing brain regions of relapsing-remitting MS patients. Neuroimage Clin 14, 363–370 (2017).
12. Mezer, A. et al. Quantifying the local tissue volume and composition in individual brains with magnetic resonance imaging. Nat Med 19, 1667–72 (2013).
13. Filo, S. et al. Disentangling molecular alterations from water-content changes in the aging human brain using quantitative MRI. Nat Commun 10, 3403 (2019).
14. Shtangel, O. & Mezer, A. A. A phantom system for assessing the effects of membrane lipids on water proton relaxation. NMR Biomed 33, e4209 (2020).
15. Shaharabani, R., Ram-On, M., Talmon, Y. & Beck, R. Pathological transitions in myelin membranes driven by environmental and multiple sclerosis conditions. 115, 11156–11161 (2018).
16. Fink, L., Steiner, A., Szekely, O., Szekely, P. & Raviv, U. Structure and Interactions between Charged Lipid Membranes in the Presence of Multivalent Ions. Langmuir 35, 9694–9703 (2019).
17. Fink, L. et al. Bridges of Calcium Bicarbonate Tightly Couple Dipolar Lipid Membranes. Langmuir 36, 10715–10724 (2020).
18. Fink, L. et al. Osmotic Stress Induced Desorption of Calcium Ions from Dipolar Lipid Membranes. Langmuir 33, 5636–5641 (2017).
19. Nadler, M. et al. Following the structural changes during zinc-induced crystallization of charged membranes using time-resolved solution X-ray scattering. Soft Matter 7, 1512–1523 (2011).
20. Fischl, B. FreeSurfer. Neuroimage 62, 774–781 (2012).
21. Whittall, K. P. et al. In vivo measurement of T2 distributions and water contents in normal human brain. Magn Reson Med 37, 34–43 (1997).
22. Laule, C. et al. Magnetic Resonance Imaging of Myelin. Neurotherapeutics 4, 460–484 (2007).
23. Mackay, A. et al. In vivo visualization of myelin water in brain by magnetic resonance. Magn Reson Med 31, 673–677 (1994).
24. MacKay, A. et al. Insights into brain microstructure from the T2 distribution. Magn Reson Imaging 24, 515–525 (2006).
25. Stewart, W. A., Mackay, A. L., Whittall, K. P., Moore, G. R. W. & Paty, D. W. Spin-spin relaxation in experimental allergic Encephalomyelitis. Analysis of CPMG data using a non-linear least squares method and linear inverse theory. Magn Reson Med 29, 767–775 (1993).
26. Min, Y. et al. Interaction forces and adhesion of supported myelin lipid bilayers modulated by myelin basic protein. Proc Natl Acad Sci U S A 106, 3154–3159 (2009).
Figures
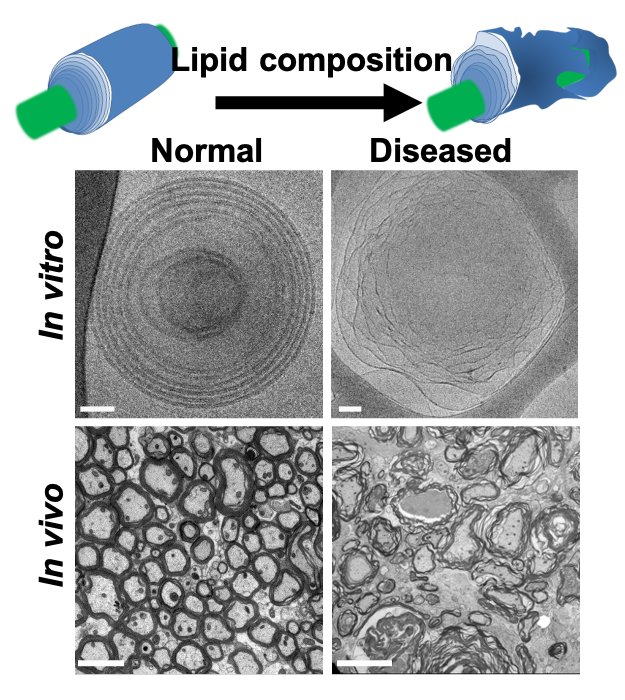
Fig. 1: Normal and diseased myelin structures both in-vitro and in-vivo. Healthy myelin has a compact and round structure n comparison to diseased undulated myelin. While the membrane thickness (black structures) stays relatively the same, the water gap between the membranes increases in the diseased state. In this work, we aim to characterize the changing ratio between the myelin water gap (dw) and the membrane thickness (dm) i.e., dw/dm. Image ad apted from3.
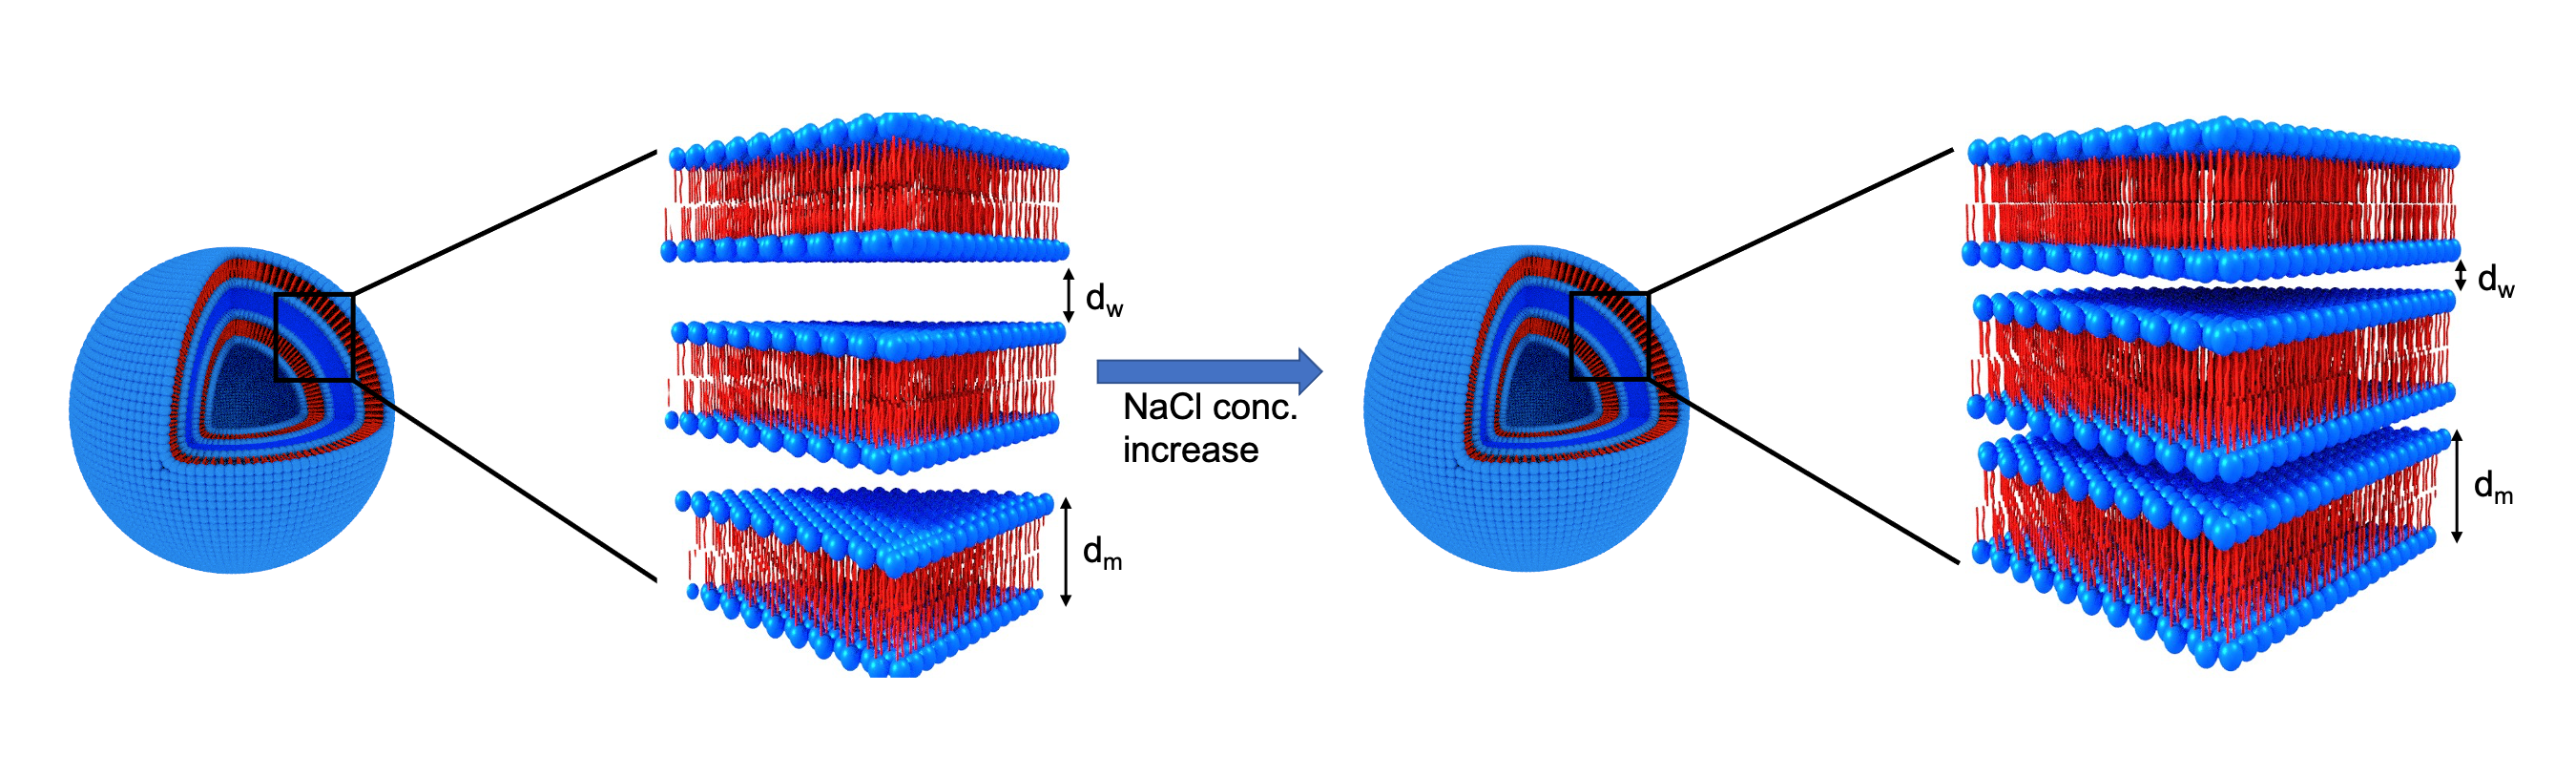
Figure 2: Schematic representation of multilamellar vesicles (MLV). The MLVs are composed of repeating layers of lipid bilayers (blue head group and red tail group) with a water gap between them. The membrane size is defined as dm. dw is the water gap size between the lipid membranes. The ratio between the water gap and the membrane thicknesses is defined as dw/dm. The addition of salt results in a decrease in the water gap, while dm does not change. Hence, the ratio dw/dm decreases.
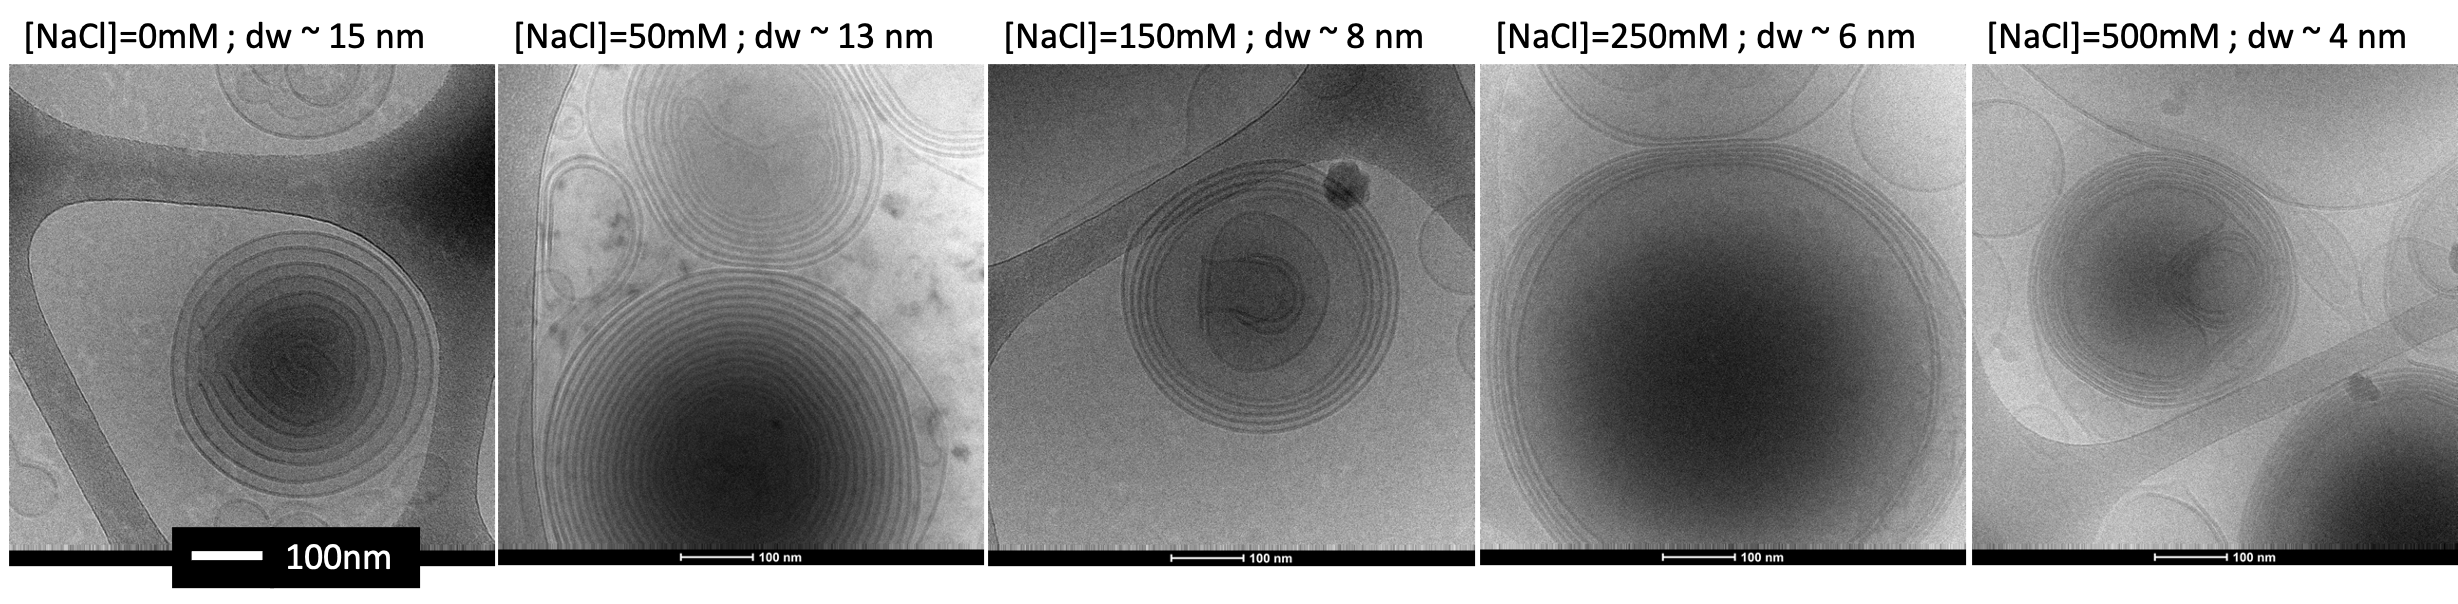
Figure 3: Cryo-TEM images of liposomes with different salt concentrations. Each MLV has an onion shape with a membrane inside a membrane (black circle lines). Between the membranes, there are water gap layers (grey areas between the black lines) which are very large (~15 nm) for no salt and very dense (~4 nm) for high salt concentration. All scale bars are 100 nm.
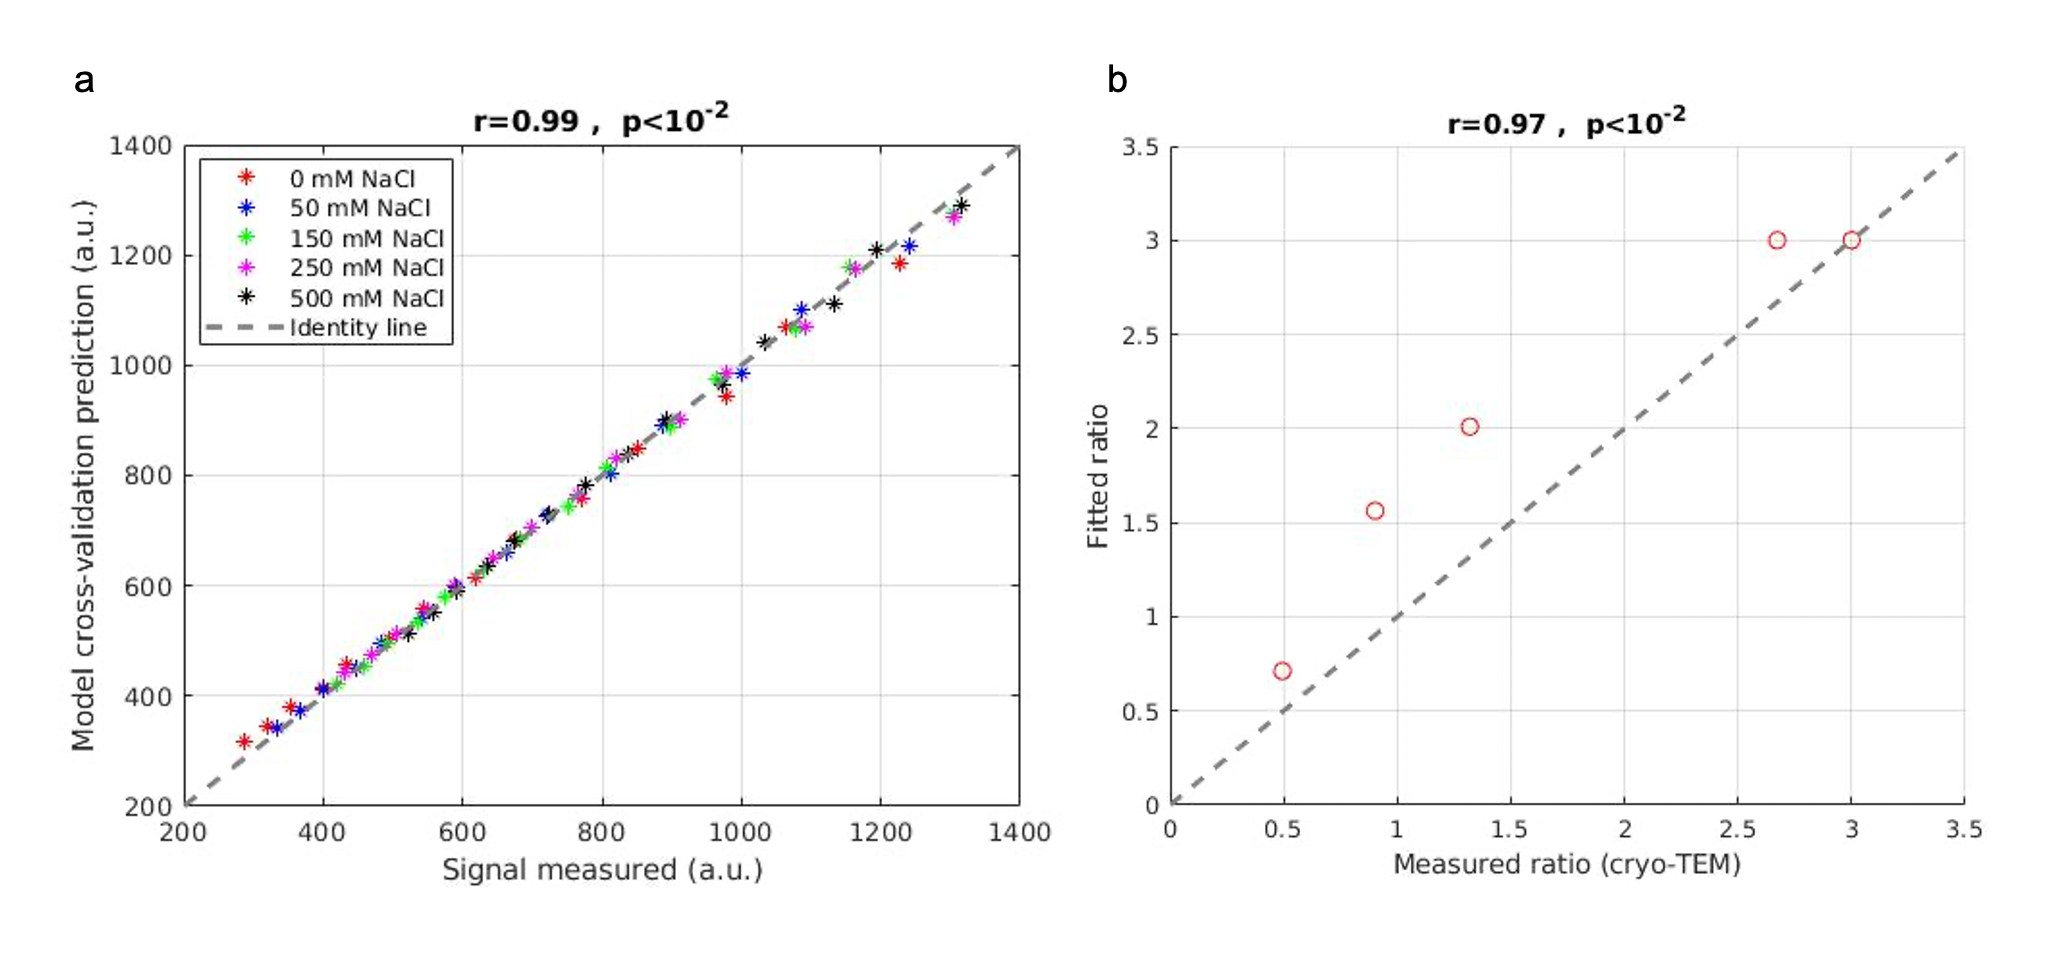
Figure 4: Accuracy of the myelin water gap model in the phantom system. (a) The signal predicted from the multi-exponential model using cross-validation correlates well (r=0.99, P<10-2) with the measured signal (x-axis). Different colors represent different salt concentrations. (b) The membrane packing ratio extracted from the biophysical model highly correlates with the membrane packing ratio estimated from cryo-TEM (r=0.97, p<10-2).
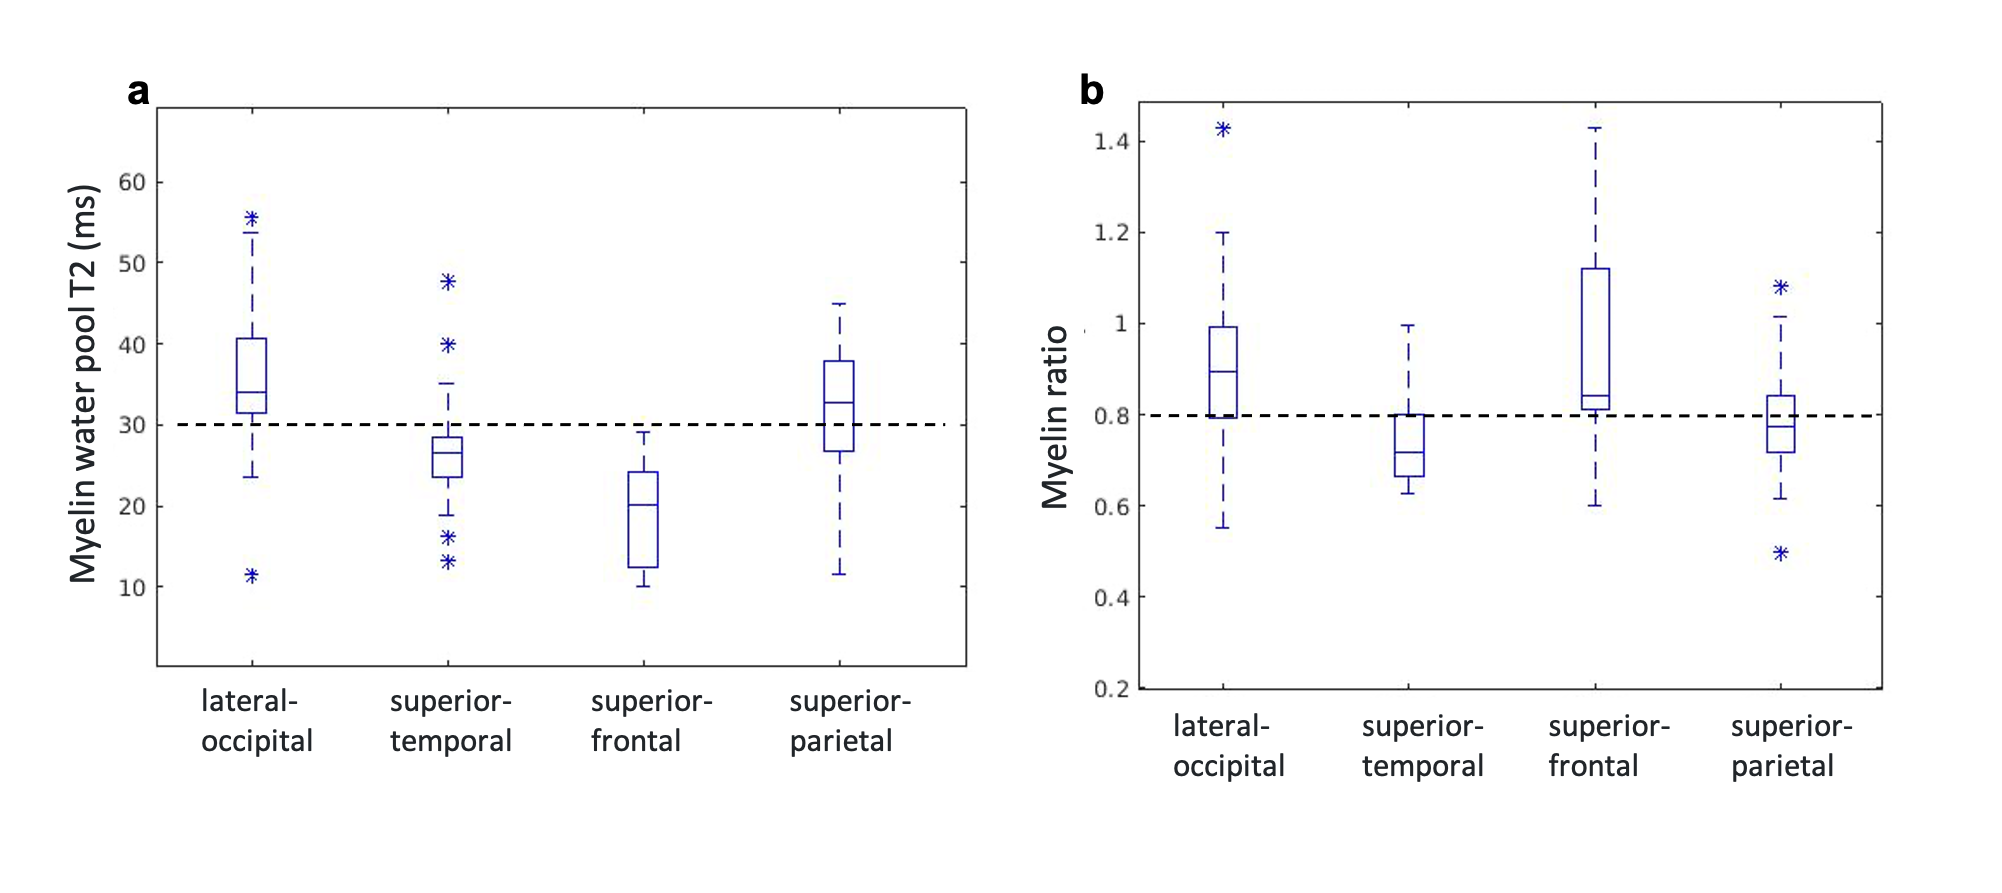
Figure 5: In-vivo myelin water gap estimation for healthy young adults (N=25) in 4 different WM areas (x-axis). (a). Relaxation time T2 of MW for each WM area. The dashed line represents the typical MW T2 value from the MWI literature 21–25. (b) The membrane packing ratio (water gap to membrane thicknesses, dw/dm) for each WM area. The dashed line represents the literature myelin water gap to myelin membrane thicknesses ratio 3,26.