1131
Adults with hypertension exhibit lower cerebral myelin content.1Laboratory of Clinical Investigations, National Institute on Aging, Baltimore, MD, United States
Synopsis
Keywords: White Matter, Relaxometry
Hypertension is a major risk factor for a myriad of neurodegenerative diseases. However, the effect of hypertension on cerebral microstructure, especially myelination, remains poorly understood. We employed multicomponent MR relaxometry and DTI to investigate the association between hypertension and cerebral microstructural integrity, with a focus on myelin content, in a cohort of cognitively unimpaired adults. Our results indicate that adults with hypertension exhibit significantly lower cerebral microstructural integrity and axonal myelination as compared to controls across, several white matter structures.
Introduction:
Structural and DTI MRI-based studies have shown that impaired white matter integrity is related to hypertension1-3. However, a direct association between hypertension and myelin loss has yet to be established. In this study, we investigated the relationship between myelin content and hypertension in normative aging. Specifically, we evaluated the associations between hypertension status and MR metrics of white matter integrity, including myelin water fraction (MWF) and longitudinal and transverse (R1 and R2) relaxation rates, measured using relaxometry, and well as fractional anisotropy (FA), axial diffusivity (AxD), mean diffusivity (MD) and radial diffusivity (RD), measured using DTI. The overarching goal of this study is to examine the relationship between hypertension and white matter integrity, with a specific focus on myelin content.Methods:
Data AcquisitionEach participant underwent our BMC-mcDESPOT protocol for MWF, R1 and R2 mapping4-6, and our DTI protocol for FA, AxD, MD and RD mapping7. The acquisition details of these protocols can be found in our previous studies8-10. Further, for each participant, the systolic and diastolic blood pressures were recorded three times in each arm in a seated position using a mercury sphygmomanometer, with the averaged values used in our subsequent analyses. The hypertension status was defined as a blood pressure >140/90 mmHg or by use of anti-hypertensive medication.
Data Processing and Statistical Analysis
For each participant, whole-brain MWF, R1 and R2 maps were generated using the BMC-mcDESPOT, DESPOT1 and DESPOT2 analyses, respectively8-10, while whole-brain FA, AxD, MD and RD maps were generated from the DTI data7. The maps were then registered to the MNI space using the FSL software11. Fourteen white matter (WM) regions of interest (ROIs) were defined from the MNI structural atlas. For each ROI, the effect of hypertension on MWF, R1, R2, FA, AxD, MD or RD was investigated using a multiple linear regression model with the MR parameters within the ROI as the dependent variable and the hypertension status as the independent variable. Age, sex, diabetes status, smoking status and cholesterol were included as relevant covariates.
Results & Discussion:
After excluding subjects with cognitive impairments, severe motion artifacts or missing data, the final study cohort consisted of 90 cognitively unimpaired participants ranging in age from 40 to 94 years (64.6 ± 17.1 years). 41 (45.6%) were women, 27 (30.0%) were hypertensive, 3 (3.3%) were diabetic, and 30 (33.3%) were identified as smokers. The mean ± standard deviation values of the systolic blood pressure (SBP) and the diastolic blood pressure (DBP) were 117.6 ± 14.5 and 68.5 ± 8.6, respectively. The mean ± standard deviation values of cholesterol were 183.0 ± 35.1.The associations between hypertension and our relaxometry and DTI metrics were significant in several white matter brain regions, even after adjustment for covariates (Table 1, 2). Specifically, we found negative regional correlations between hypertension and MWF, a specific and direct measure of myelin content, with hypertensive subjects exhibiting significantly lower values of MWF (Fig. 1, Table 1). These results suggest that hypertension may affect myelination likely through downstream impairments of the cerebral blood flow (CBF) as a consequence of cerebral artery remodeling12. Indeed, we have recently showed that deficits in CBF are associated with reduced cerebral microstructural integrity, especially myelin content13-15. Derived R1 and R2 results, which are sensitive but nonspecific measures of myelin content, are overall consistent with the MWF results (Table 1, Fig. 1). Further, we found positive regional correlations between hypertension and AxD, MD and RD and negative regional correlations between hypertension and FA (Table 2, Fig. 2). Our results agree with previous DTI-based investigations16-17, and further support our finding that hypertension may cause a decrease in axonal myelination. Hence, hypertension status may be a reliable indicator of those at risk of myelin degeneration among cognitively unimpaired adults.
Conclusion:
This study provides new insights into the association between hypertension and axonal demyelination among cognitively normal individuals. This work motivates further investigations to elucidate the extent to which hypertension and myelination are related in neurodegenerative diseases, including in Alzheimer’s disease and dementias.Acknowledgements
This work was supported by the Intramural Research Program of the National Institute on Aging of the National Institutes of Health.References
1. Skoog, I. and D. Gustafson, Update on hypertension and Alzheimer's disease. NeurolRes, 2006. 28(6): p. 605-11.
2. Longstreth, W.T., Jr., et al., Lacunar infarcts defined by magnetic resonance imaging of 3660 elderly people: the Cardiovascular Health Study. Arch Neurol, 1998. 55(9): p. 1217-25.
3. Suri, S., et al., Association of Midlife Cardiovascular Risk Profiles With Cerebral Perfusion at Older Ages. JAMA Netw Open, 2019. 2(6): p. e195776.
4. Bouhrara M, Spencer RG. Improved determination of the myelin water fraction in human brain using magnetic resonance imaging through Bayesian analysis of mcDESPOT. Neuroimage. 2016;127:456-71.
5. Bouhrara M, Spencer RG. Incorporation of nonzero echo times in the SPGR and bSSFP signal models used in mcDESPOT. Magn Reson Med. 2015;74(5):1227-35.
6. Deoni SC, Rutt BK, Peters TM. Rapid combined T1 and T2 mapping using gradient recalled acquisition in the steady state. Magn Reson Med. 2003;49(3):515-26.
7. Kiely, M., et al., Insights into human cerebral white matter maturation and degeneration across the adult lifespan. Neuroimage, 2022. 247: p. 118727.
8. Bouhrara M, Rejimon AC, Cortina LE, Khattar N, Bergeron CM, Ferrucci L, et al. Adult brain aging investigated using BMC-mcDESPOT-based myelin water fraction imaging. Neurobiol Aging. 2020;85:131-9.
9. Bouhrara M, Spencer RG. Rapid simultaneous high-resolution mapping of myelin water fraction and relaxation times in human brain using BMC-mcDESPOT. Neuroimage. 2017;147:800-11.
10. Stollberger R, Wach P. Imaging of the active B1 field in vivo. Magn Reson Med. 1996;35(2):246-51.
11. Jenkinson M, Beckmann CF, Behrens TE, Woolrich MW, Smith SM. FSL. Neuroimage. 2012;62(2):782-90.
12. Pires, P.W., et al., The effects of hypertension on the cerebral circulation. Am J Physiol Heart Circ Physiol, 2013. 304(12): p. H1598-614.
13. Bouhrara, M., et al., Association of cerebral blood flow with myelin content in cognitively unimpaired adults. BMJ Neurol Open, 2020. 2(1): p. e000053.
14. Bouhrara, M., et al., Association of Cerebral Blood Flow With Longitudinal Changes in Cerebral Microstructural Integrity in the Coronary Artery Risk Development in Young Adults (CARDIA) Study. JAMA Netw Open, 2022. 5(9): p. e2231189.
15. Kiely, M., et al., Evidence of An Association Between Cerebral Blood Flow and Microstructural Integrity in Normative Aging Using a Holistic MRI Approach. J Magn Reson Imaging, 2022.
16. Song, S.K., et al., Demyelination increases radial diffusivity in corpus callosum of mouse brain. Neuroimage, 2005. 26(1): p. 132-40.
17. Pierpaoli, C., et al., Water diffusion changes in Wallerian degeneration and their dependence on white matter architecture. Neuroimage, 2001. 13(6 Pt 1): p. 1174-85.
Figures
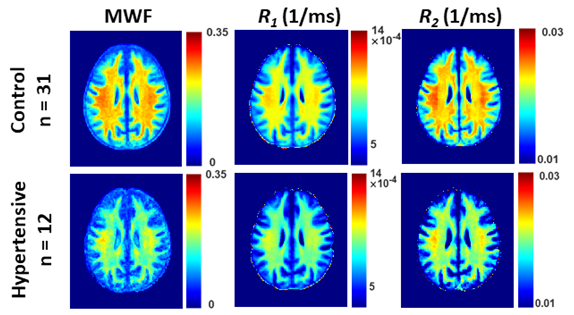
Figure 1. Examples of MWF, R1 and R2 parameter maps averaged across participants who are either hypertensive or non-hypertensive (control) drawn from a limited age range (70-94 yrs.) to mitigate the effect of age. Results are shown for a representative slice. Visual inspection indicates that overall, hypertensive patients exhibit lower regional MWF, R1 and R2 values, as compared to controls.
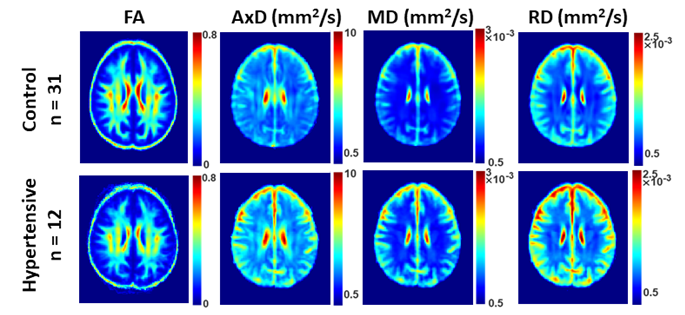
Figure 2. Examples of FA, AxD, MD, and RD parameter maps averaged across participants who are either hypertensive or non-hypertensive (control) drawn from a limited age range (70-94 yrs.) to mitigate the effect of age. Results are shown for a representative slice. Visual inspection indicates that, overall, hypertensive participants exhibit higher AxD, MD and RD values or lower values of FA as compared to controls.
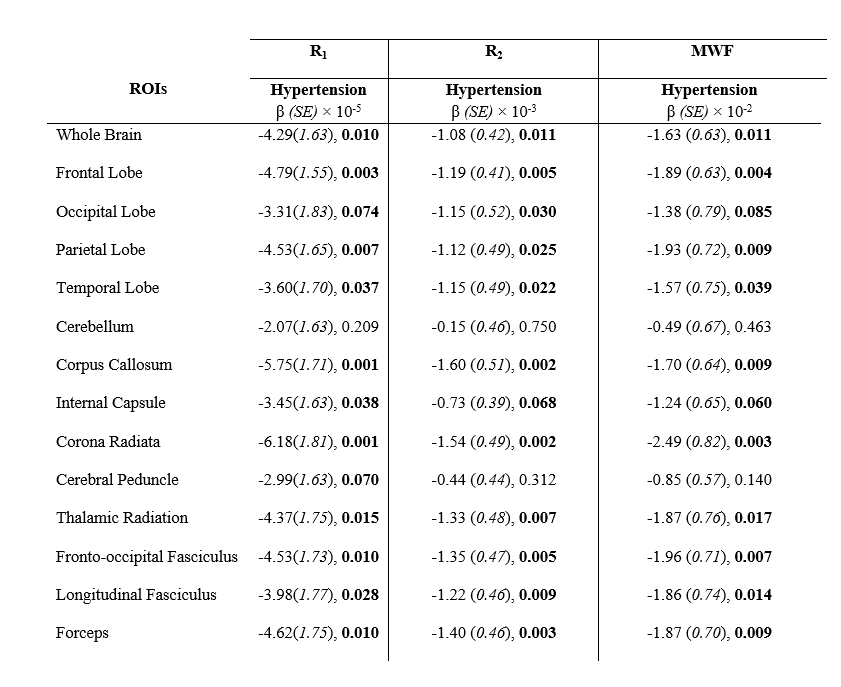
Table 1. Regression coefficients, β, (standard errors, SE), and significance, p-values, of our relaxometry metrics (R1, R2 and MWF) vs. hypertension across the 14 WM ROIs investigated. The multiple regression model is given by: MRI ~ β0 + βHypertension × Hypertension + βage × age + βSmoking × Smoking + βsex × sex + βDiabetes × Diabetes+ βCholesterol × Cholesterol, where MRI corresponds to R1, R2 or MWF. Bolded p-values indicate significance (p < 0.05) or close-to-significance (p < 0.1).
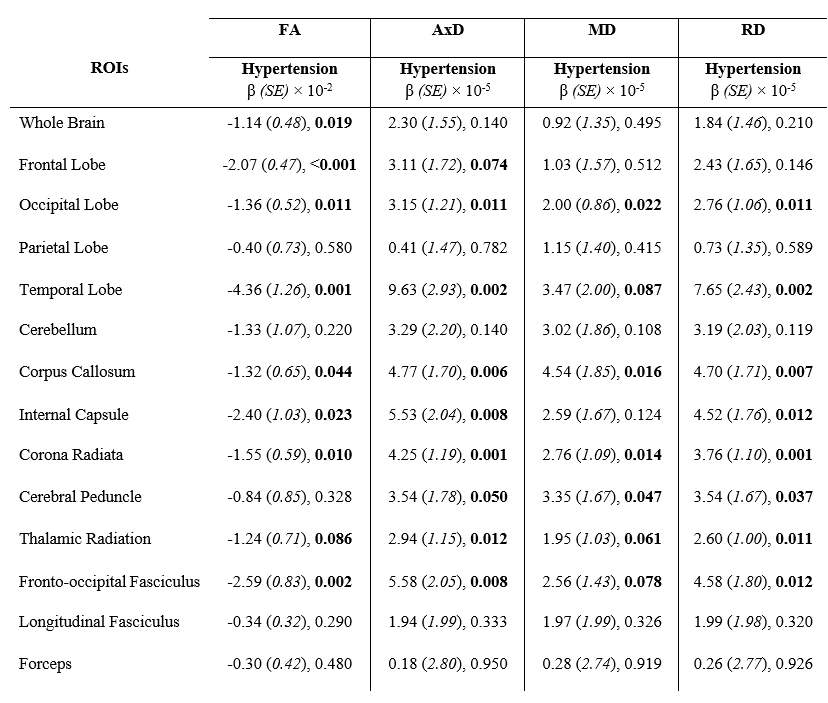
Table 2. Regression coefficients, β, (standard errors, SE), and significance, p-values, of our DTI metrics (FA, AxD, MD and RD) vs. hypertension across the 14 WM ROIs studied. The multiple regression model is given by: MRI ~ β0 + βHypertension × Hypertension + βage × age + βSmoking × Smoking + βsex × sex + βDiabetes × Diabetes+ βCholesterol × Cholesterol, where MRI corresponds to FA, AxD, MD and RD. Bolded p-values indicate significance (p < 0.05) or close-to-significance (p < 0.1).