1128
The apparent orientation dependence of MTR, ihMTR and MWF is affected by local microstructural properties in white matter1Physics & Astronomy, University of British Columbia, Vancouver, BC, Canada, 2International Collaboration on Repair Discoveries, Vancouver, BC, Canada, 3Radiology, University of British Columbia, Vancouver, BC, Canada, 4UBC MRI Research Centre, Vancouver, BC, Canada, 5Medical Biophysics, University of Toronto, Toronto, ON, Canada, 6The Hospital for Sick Children, Toronto, ON, Canada, 7MR Clinical Science, Philips Healthcare Canada, Markham, ON, Canada, 8Pathology & Laboratory Medicine, University of British Columbia, Vancouver, BC, Canada
Synopsis
Keywords: White Matter, CEST & MT, inhomogeneous Magnetization Transfer, ihMT, myelin water fraction, MWF, magnetization transfer, MT, fibre direction, orientation dependence, diffusion tensor imaging (DTI), myelin
We measured MTR, ihMTR, MWF and fibre orientation from DTI in 17 white matter regions in 17 healthy adults at 3 T. All three metrics showed an apparent orientation dependence: MWF and ihMTR were lower in fibres perpendicular to B0 by 6% and 1% respectively compared to those parallel, while MTR was lower by 0.5% at ~40°, with the highest values in fibres perpendicular to B0. However, separating the apparent orientation dependence by region revealed large variation in the trends, suggesting that real differences in myelination and other microstructural properties are confounding the apparent orientation dependence measured using this method.Introduction
The ability to quantify myelin in vivo is of great importance. A number of candidate metrics exist including magnetization transfer ratio (MTR), inhomogeneous magnetization transfer ratio (ihMTR)1–4 and myelin water fraction (MWF)5. Previous reports show ihMTR varies with white matter (WM) fibre orientation in vivo and in a phospholipid bilayer model6–8 while MWF varies with fibre orientation in vivo but not in a rat brain rotated ex vivo.9,10 Understanding the possible impact of fibre orientation dependence (OD) on myelin measures is key to be able to interpret findings in development, aging and disease.Objective: Measure how MTR, ihMTR and MWF are affected by fibre orientation in different WM structures.
Methods
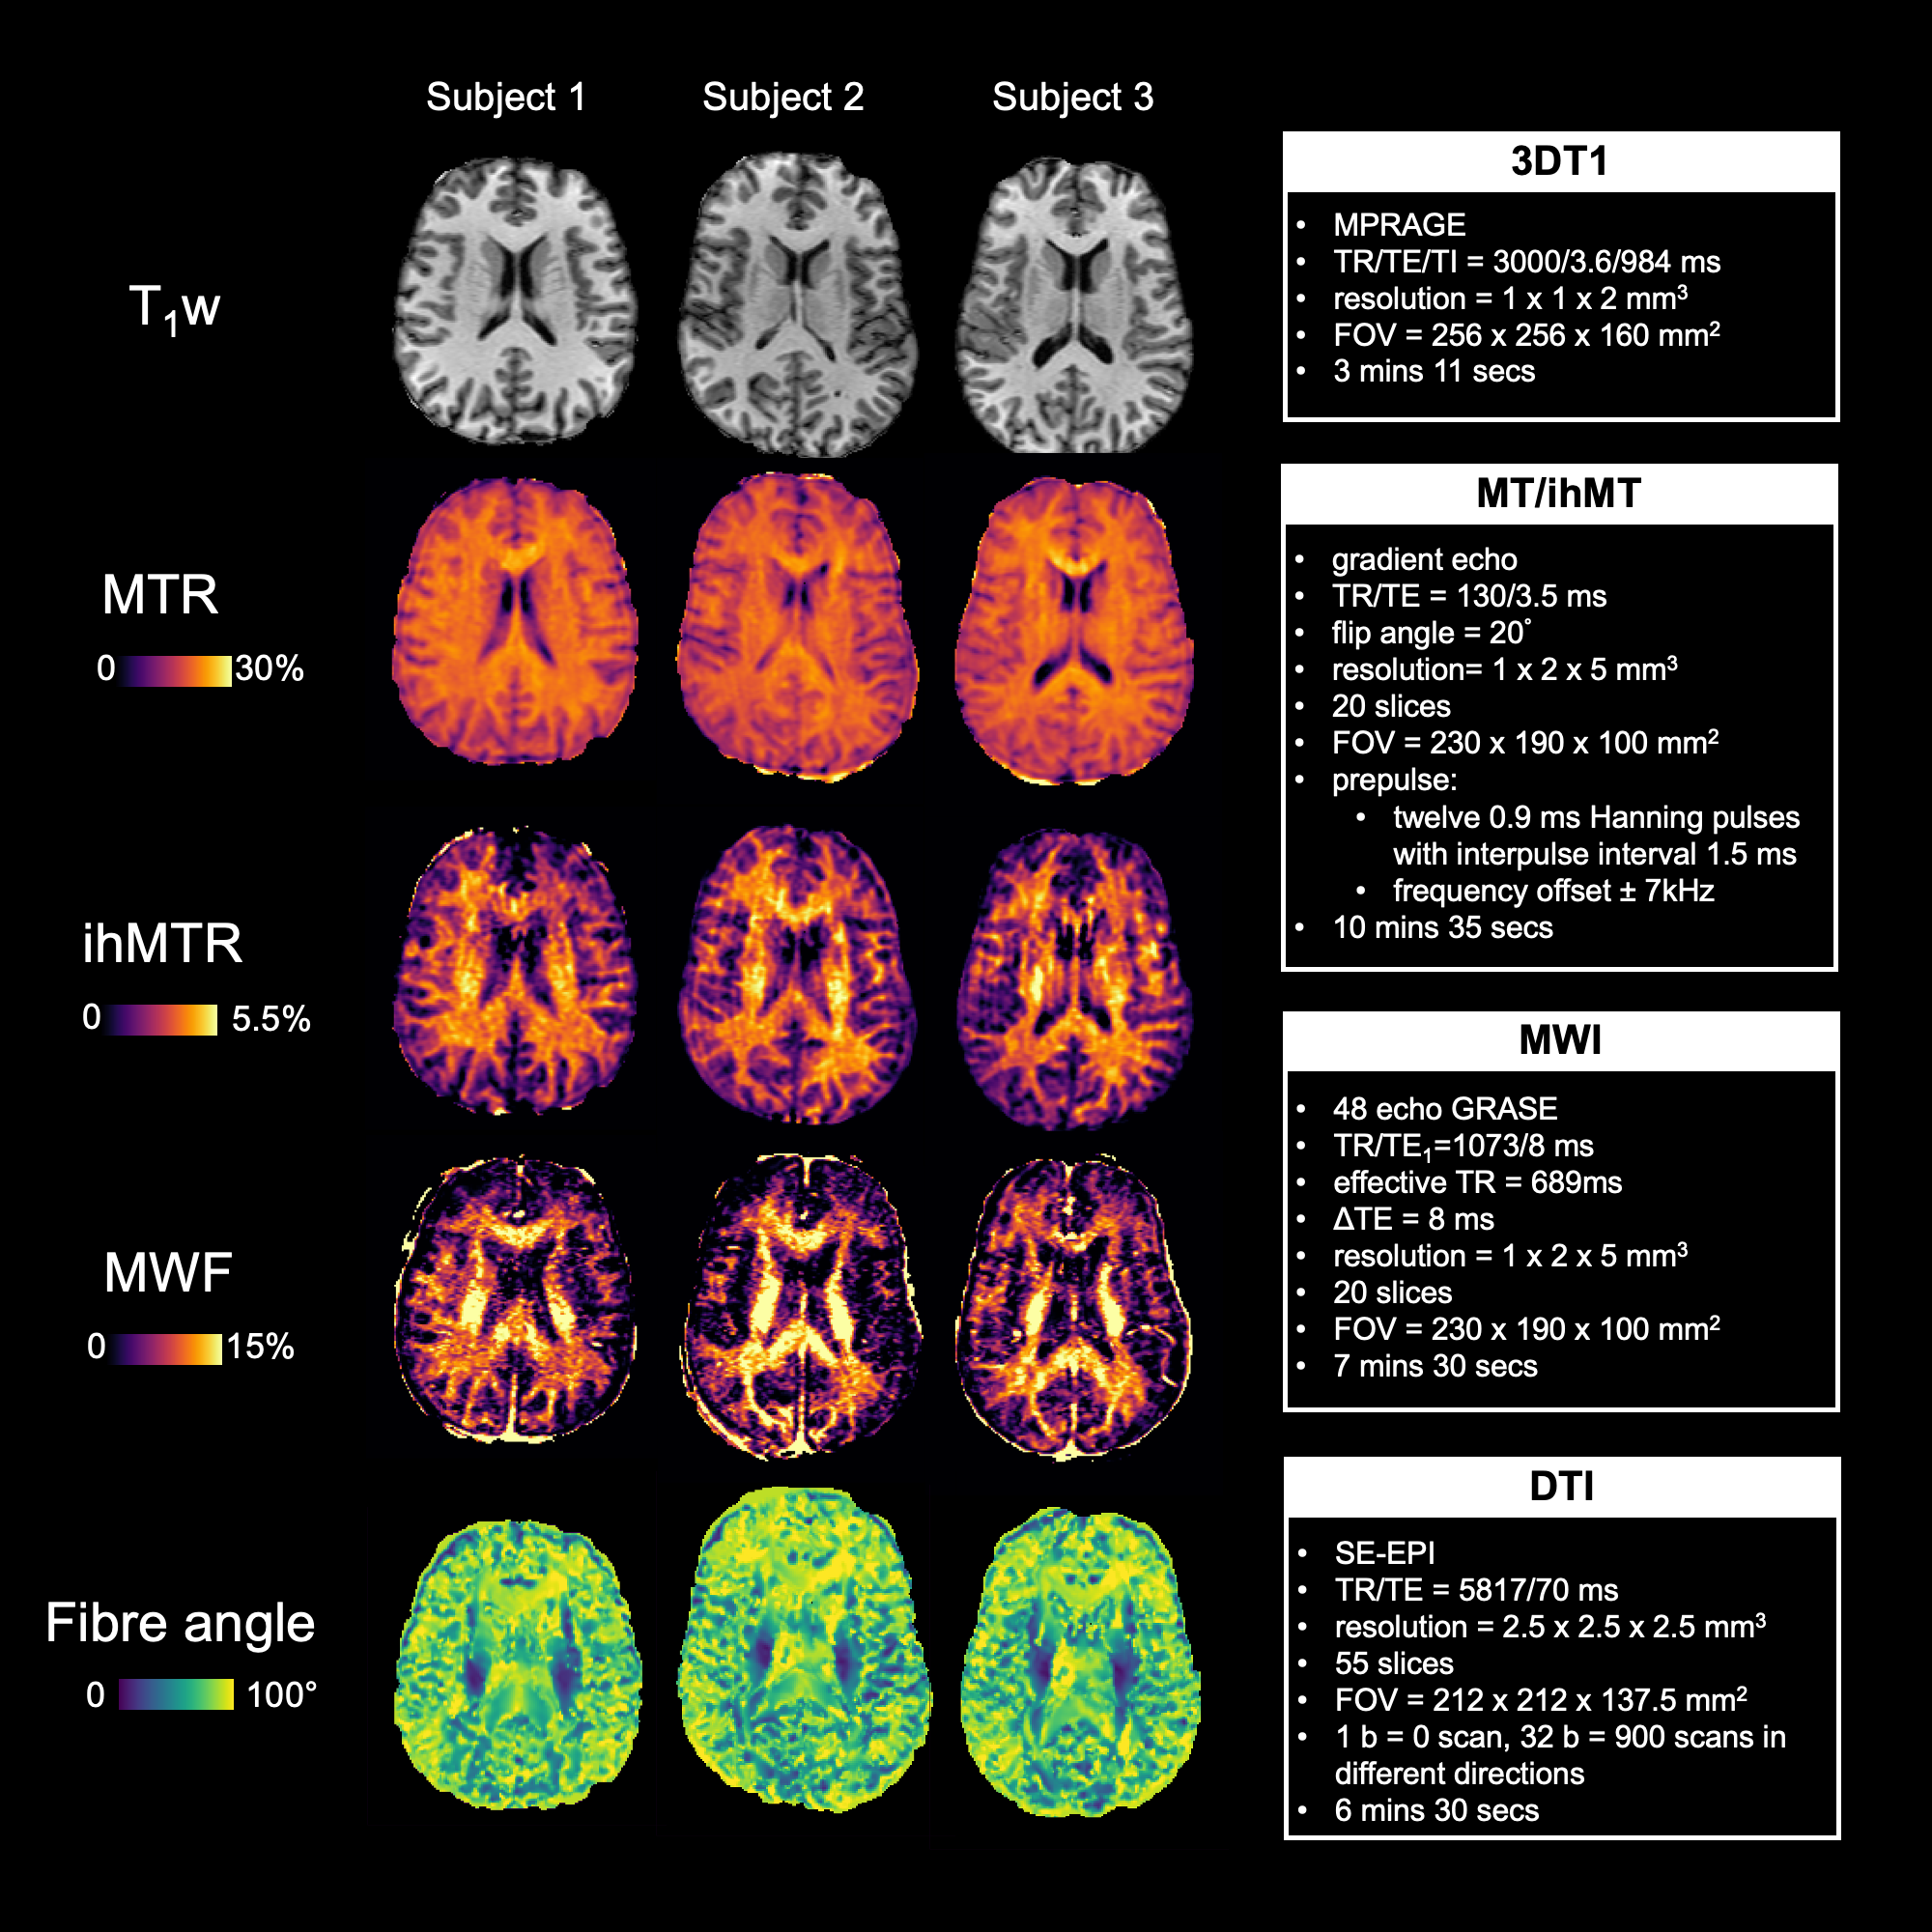
Acquisition: 17 healthy volunteers (5M/12F, mean age=26yrs, range=21-48yrs) were scanned at 3T (Philips Achieva) with an 8-channel head-coil (scan parameters in Fig.1).Analysis: $$MTR=\frac{S_0-S_+}{S_0}$$ $$ihMTR=\frac{S_{+}+S_{-}-S_{+-}-S_{-+}}{2S_0}$$ MWF = signal fraction with T2<40ms after T2 decay curve analysis using NNLS.11,12 DTI data was eddy corrected (FSL-EDDY with outlier replacement)13,14 and fit (FSL-DTIFIT). Fibre angle to B0 for each WM voxel was calculated from the first eigenvector of the fitted tensor. echo1 (GRASE) and S0 (ihMT) were brain extracted (FSL-BET)15 and registered to 3DT1 (FSL-FLIRT).16 3DT1 scans were registered to MNI space (FSL-FNIRT).16 Warp produced was used to register 17 regions from the JHU WM Labels atlas17 to 3DT1. WM masks (FSL-FAST)18 were thresholded at 0.9. Fibre angle and metric data were read out from WM voxels with FA>0.5, restricting the analysis to voxels less affected by crossing fibres. Angle bins containing <100 voxels were excluded.
Results
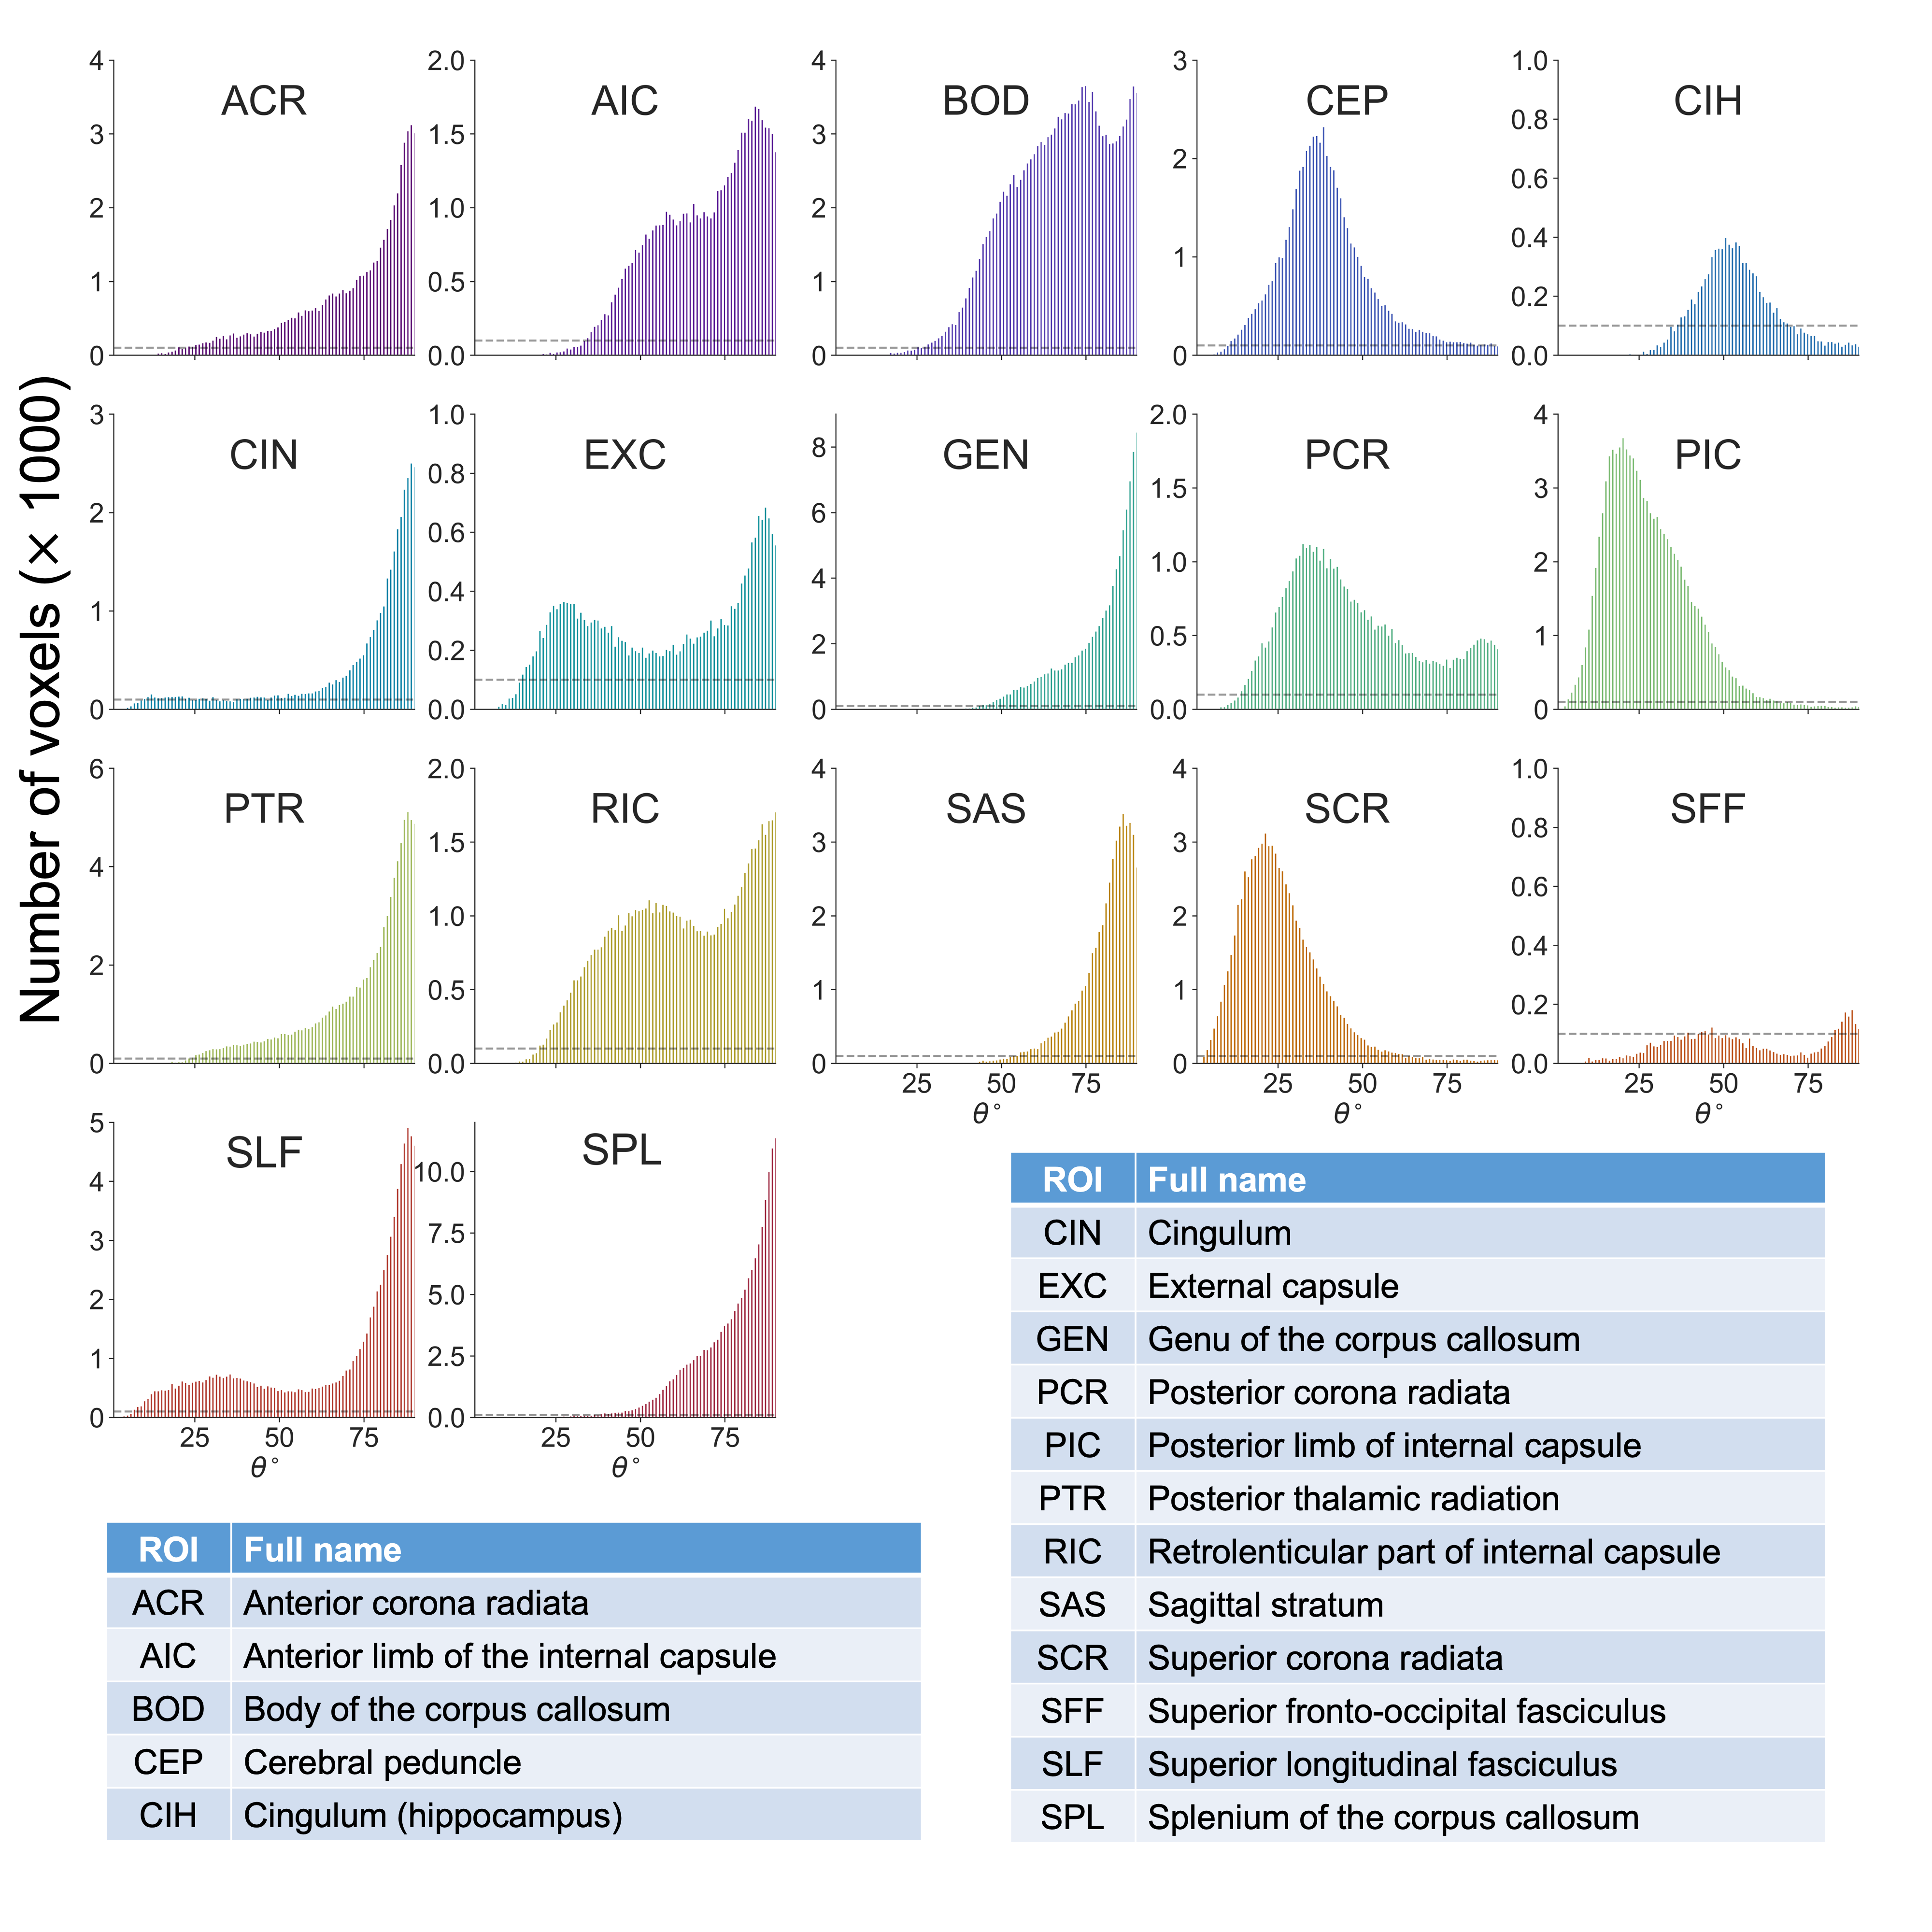
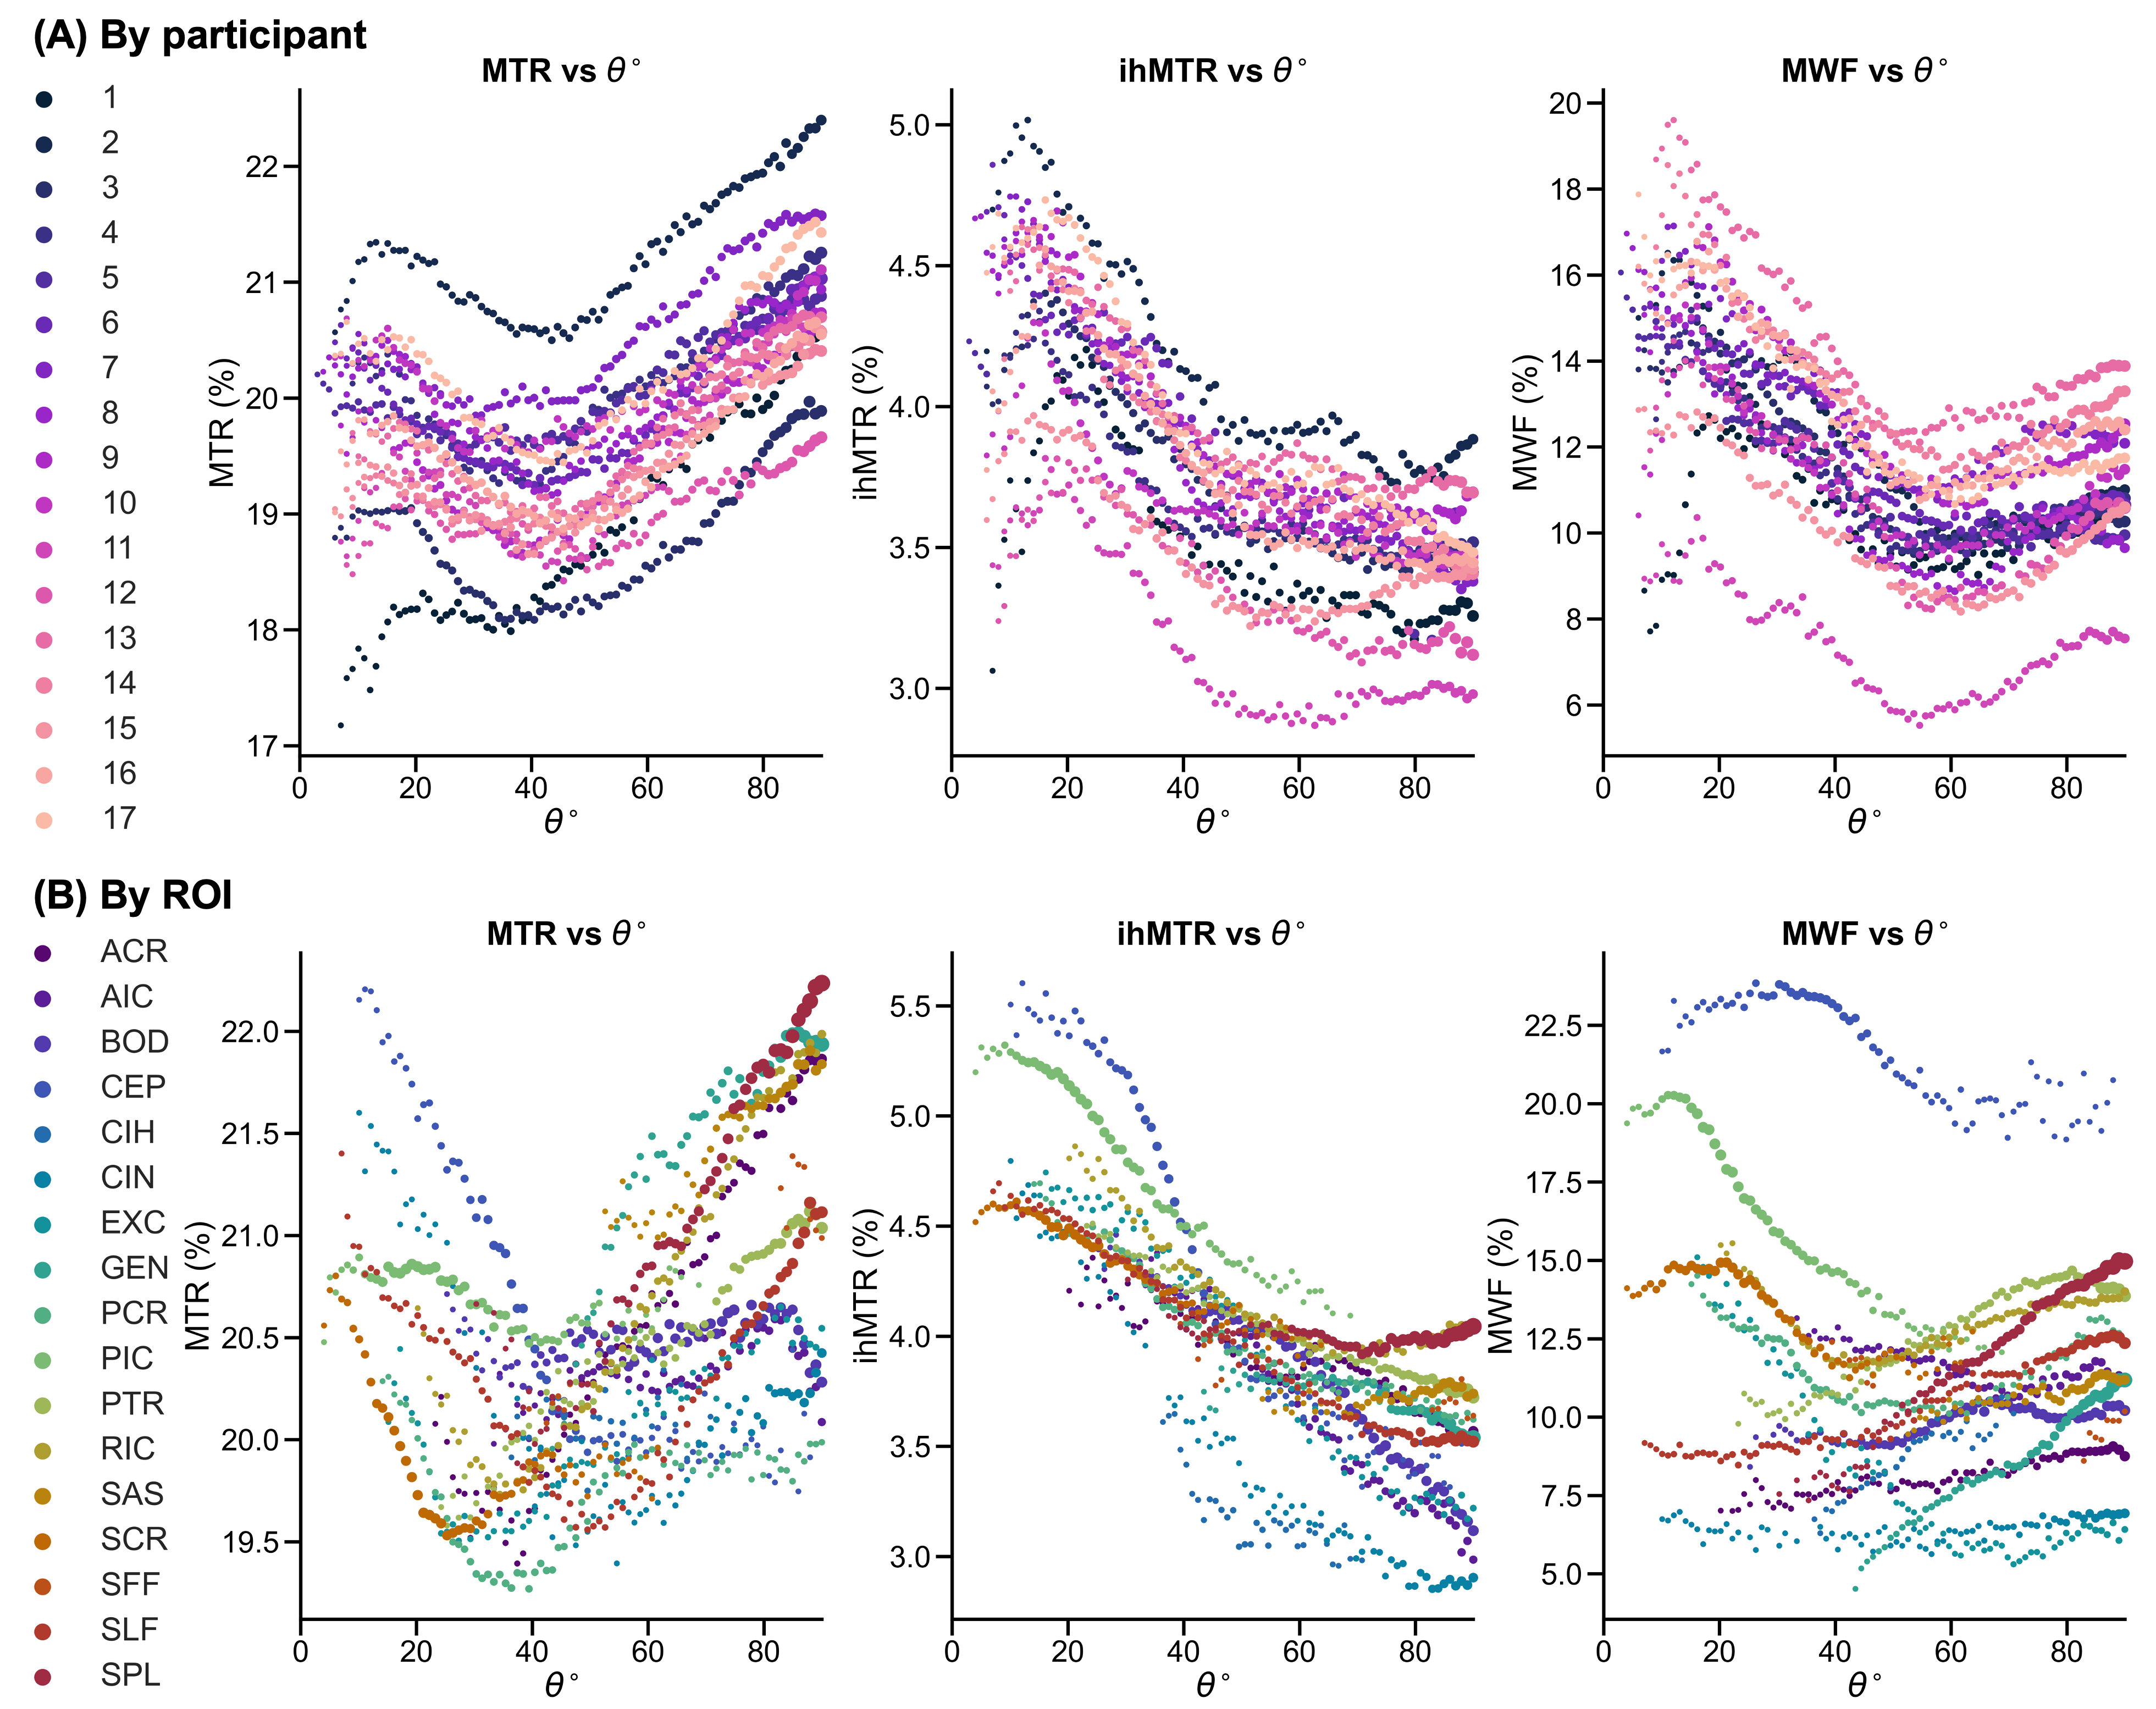
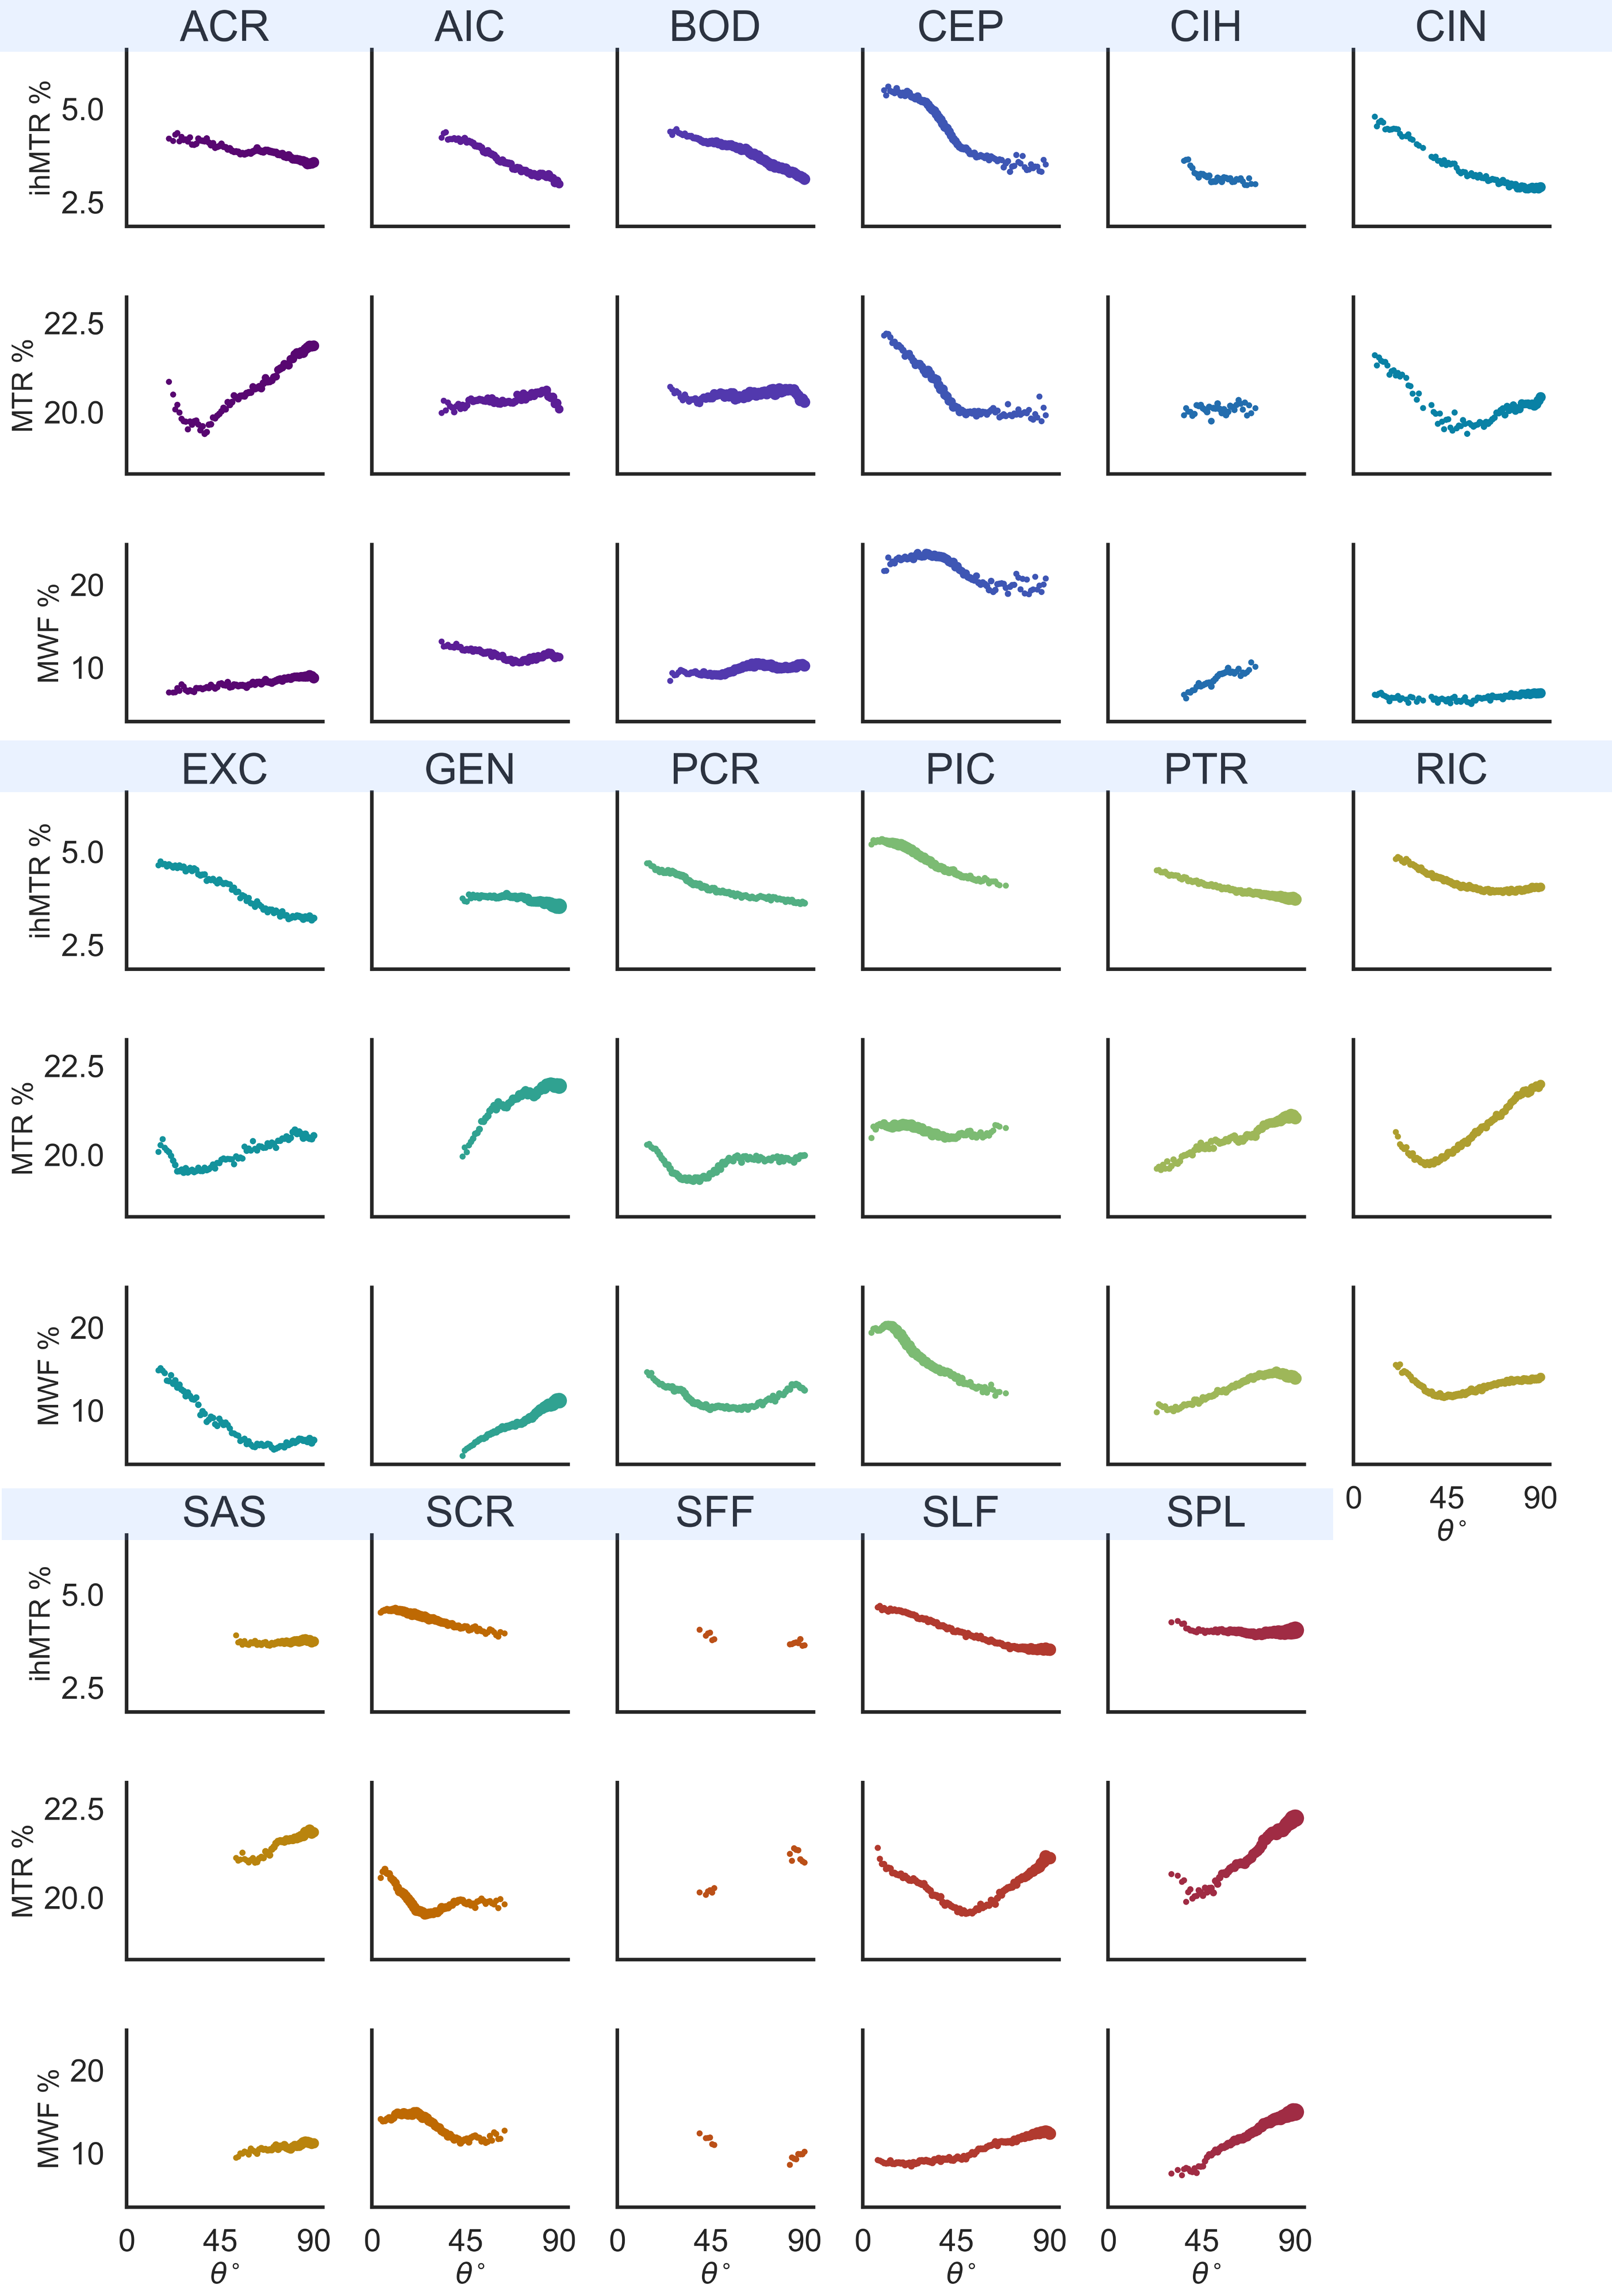
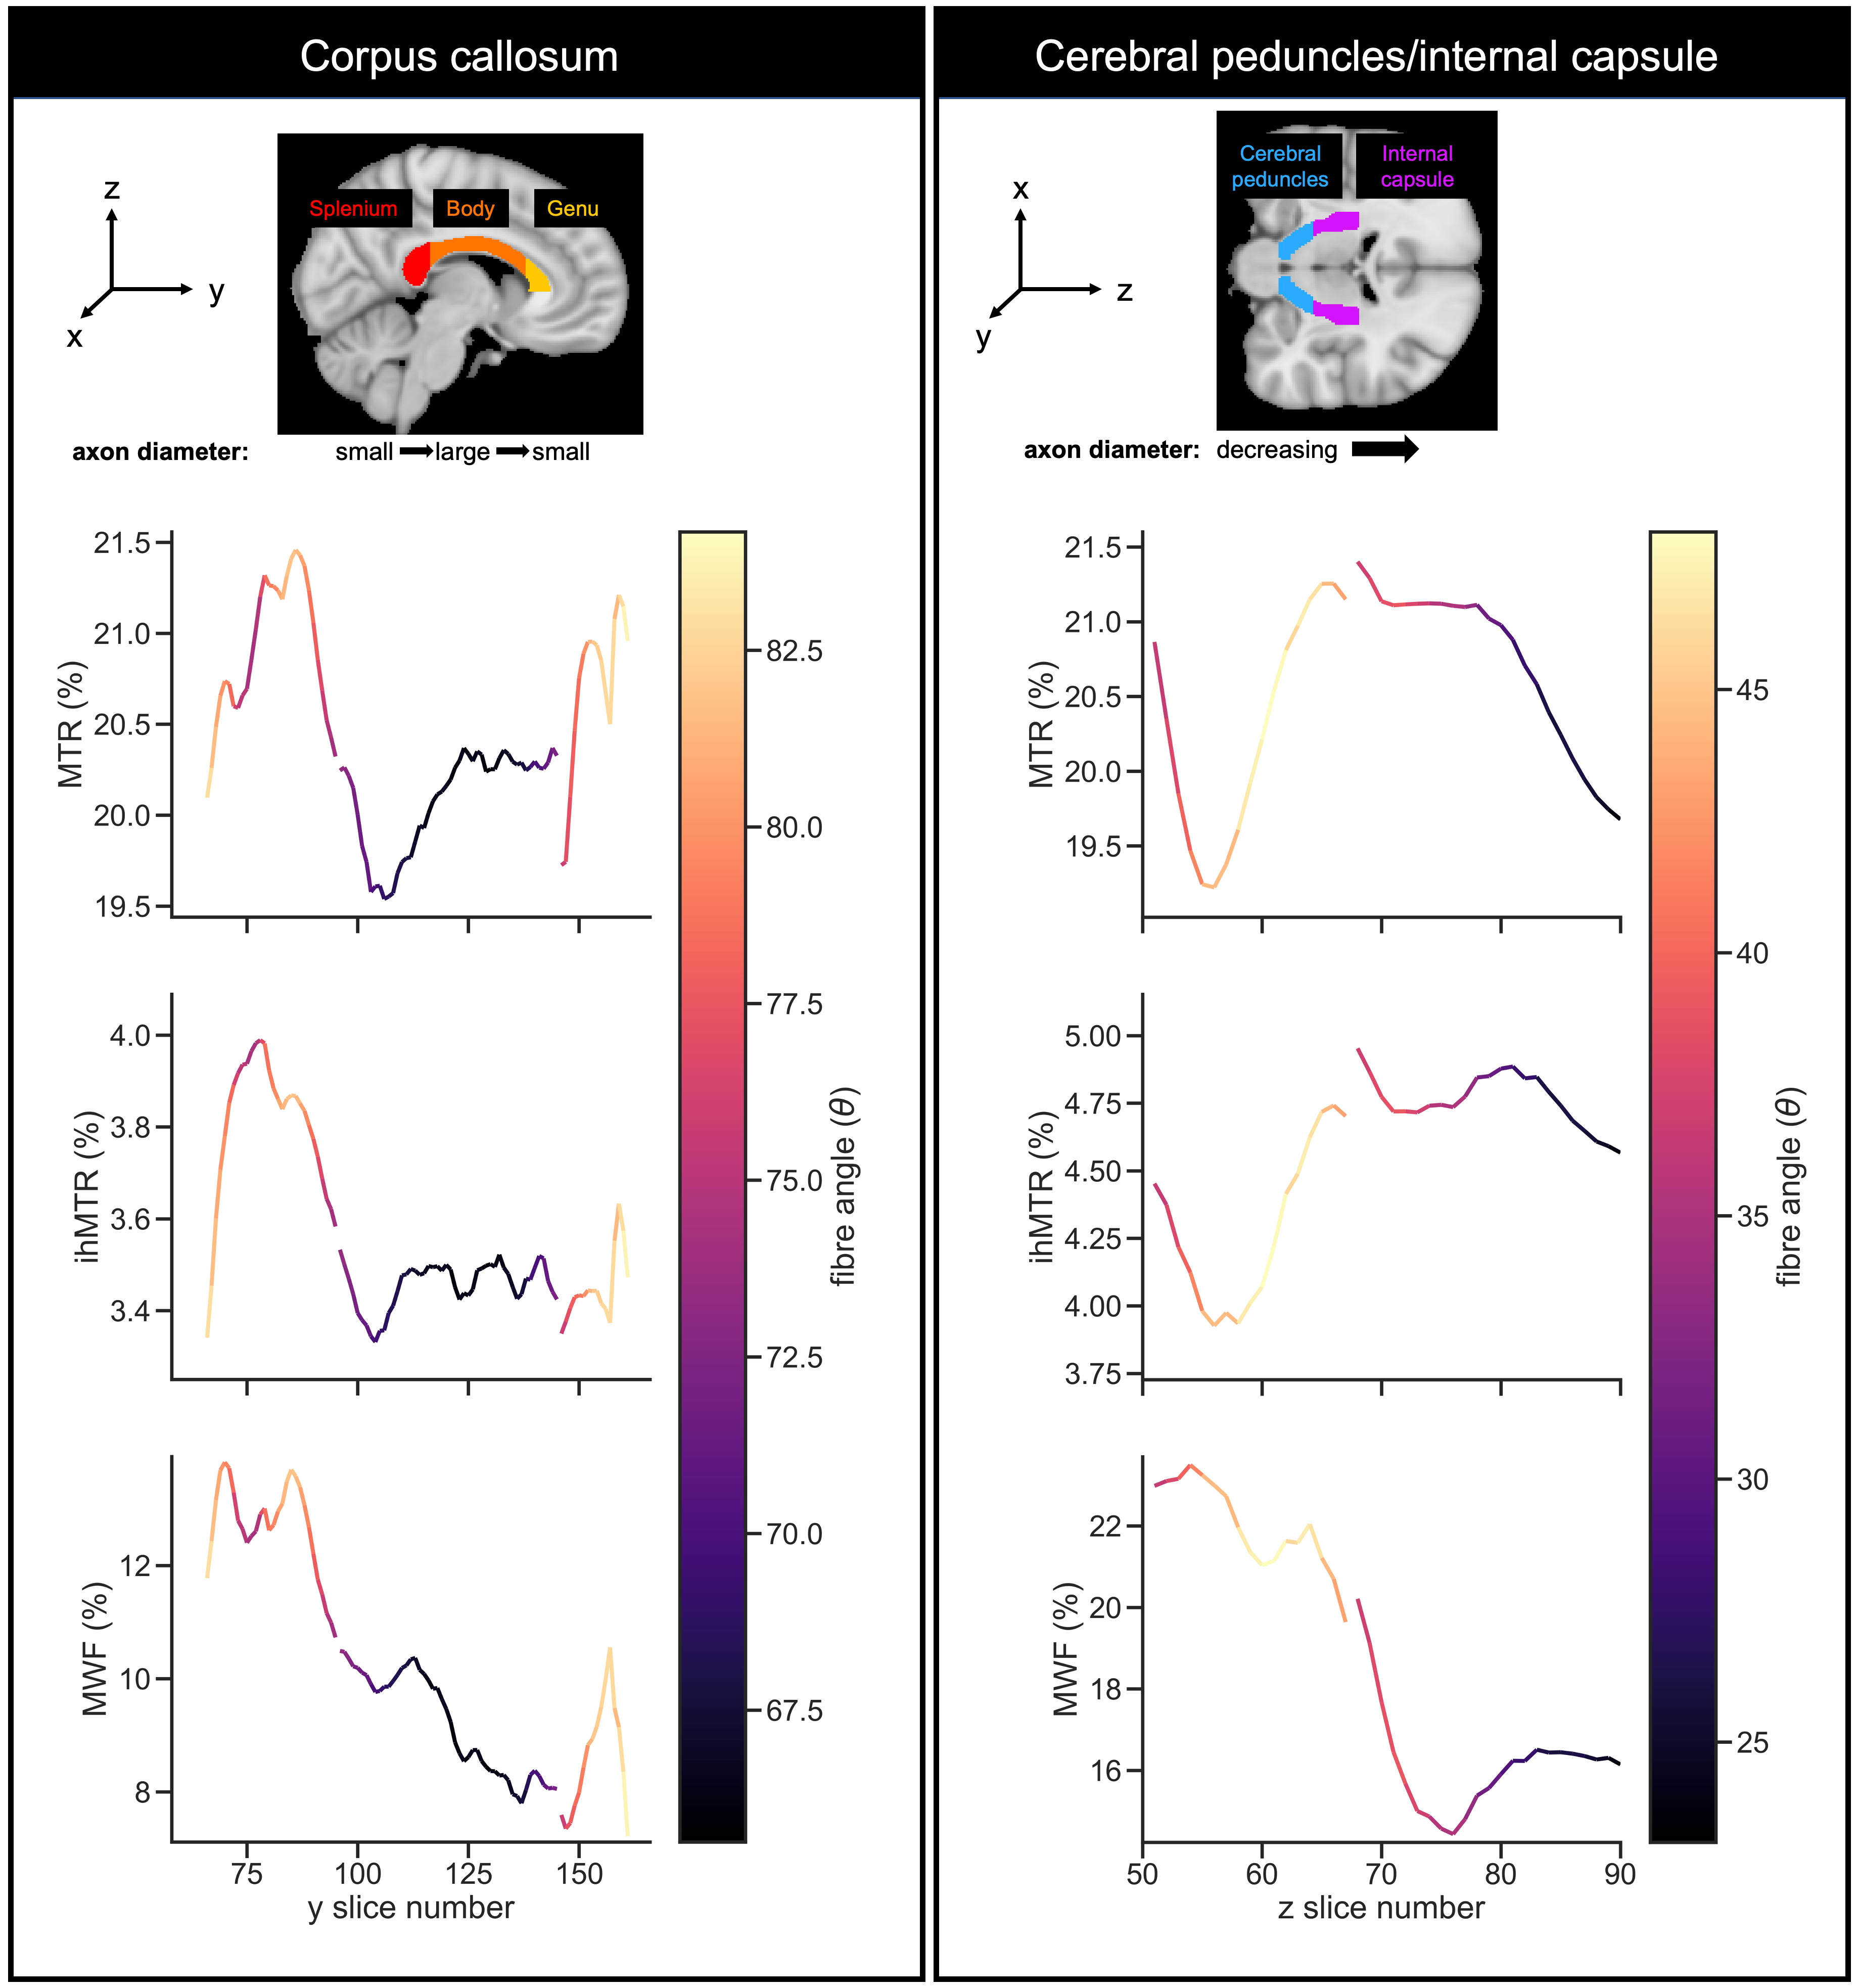
Representative metric maps are shown in Fig.1. Each WM region had a distinct range and distribution of angles (Fig.2). All metrics varied with fibre angle, across participants (Fig.3A) and regions (Fig.3B). MWF and ihMTR were lower at 90° by 6% and 1% (metric units) respectively compared to 0°. MTR had a decrease of 0.5% at 40°, and higher values at 90°. Apparent OD varied between fibres with the same angle ranges, and between metrics in the same fibres (Fig.4). The contributions of fibre angle and axon diameter to MTR, ihMTR and MWF were qualitatively investigated in the corpus callosum and the internal capsules using relative axon diameter information from histology and diffusion (Fig.5).19,20Discussion
The curves for each participant followed the same trend but were offset (Fig.3A), due to each participant’s innate myelination, which can vary with factors such as age and education.21 The apparent OD agreed with previous ihMTR6,7 and MWF9 measurements. MTR varied with fibre angle less, perhaps because MTR signal includes non-myelin macromolecules without the same coherent alignment as lipid bilayers in myelin. OD in T2 has been extensively reported and contributing mechanisms including susceptibility effects due to myelin, vasculature, iron and dipole-dipole or magic angle effects are still under investigation.9,22-25 Similarities in apparent OD between metrics hint at underlying microstructural properties in common. ihMT and MWF have similar apparent OD in Fig.3A, suggesting that myelin content is a contributing factor.The most commonly-used method to measure OD involves pooling data from all WM voxels by fibre angle and averaging like in Fig.3A.6,7,9 Microstructural parameters including axon diameter, density and alignment, myelin volume and thickness, vasculature and iron content vary considerably across WM. If these parameters had no correlation with fibre orientation, then pooling could average the effect of microstructural differences. However, this is not the case in the brain where many microstructural parameters are different between projection fibres (e.g. corticospinal tracts, parallel to B0) and association fibres (e.g. superior longitudinal fasciculus, mostly ~perpendicular to B0). For example, axon diameters are substantially larger in the corticospinal tracts.26 Thus when data is averaged, an apparent OD is measured which is a combination of OD of the MRI metric and the effect of heterogeneity of microstructure within and between regions. This heterogeneity may affect the MRI metric directly (e.g., higher myelin volume increases MWF) or change the shape of the OD curve (e.g. iron contributing to susceptibility effects).
By separating the apparent OD into regions we restrict each curve to a smaller range of microstructural parameters, although there is also variation within regions.19,27 We observed very different apparent ODs between WM regions spanning the same angles. This was seen in all three metrics, but most distinctly in MWF. ihMTR decreased more consistently with angle suggesting that ihMT has a greater true OD. Myelin content measurements using ihMTR should include a correction for OD effects.
Future experiments to determine true OD should focus on rotating the WM fibres inside the magnet.10,22 Alternatively, gold standard measurements of microstructural parameters from histological studies or orientation-independent diffusion models could be used to model confounding contributions to the apparent OD in WM.
Conclusion
MTR, ihMTR and MWF showed variation with fibre angle. Separating the orientation behaviour by WM region revealed a large discrepancy between the apparent OD of WM regions with voxels in the same angle range. This suggests that real differences in myelination and other microstructural properties within WM confound the apparent OD measured using this method in vivo in the brain.Acknowledgements
We would like to thank the participants and technologists at the UBC MRI Research Centre. This study was funded by the Natural Sciences and Engineering Research Council (NSERC) of Canada. This work was conducted on the traditional, ancestral, and unceded territories of Coast Salish Peoples, including the territories of the xwməθkwəy̓əm (Musqueam), Skwxwú7mesh (Squamish), Stó:lō and Səl̓ílwətaʔ/Selilwitulh (Tsleil- Waututh) Nations.References
1. Varma, G., Duhamel, G., de Bazelaire, C. & Alsop, D. C. Magnetization Transfer from Inhomogeneously Broadened Lines: A Potential Marker for Myelin. Magn. Reson. Med. 73, 614–622 (2015).
2. Girard, O. M. et al. Magnetization transfer from inhomogeneously broadened lines (ihMT): Experimental optimization of saturation parameters for human brain imaging at 1.5 Tesla. Magn. Reson. Med. 73, 2111–2121 (2015).
3. Zhang, L. et al. A comparison study of inhomogeneous magnetization transfer (ihMT) and magnetization transfer (MT) in multiple sclerosis based on whole brain acquisition at 3.0 T. Magn. Reson. Imaging 70, 43–49 (2020).
4. Manning, A. P., Chang, K. L., MacKay, A. L. & Michal, C. A. The physical mechanism of ‘inhomogeneous’ magnetization transfer MRI. J. Magn. Reson. 274, 125–136 (2017).
5. Mackay, A. et al. In vivo visualization of myelin water in brain by magnetic resonance. Magn. Reson. Med. 31, 673–677 (1994).
6. Ercan, E. et al. Microstructural correlates of 3D steady-state inhomogeneous magnetization transfer (ihMT) in the human brain white matter assessed by myelin water imaging and diffusion tensor imaging. Magn. Reson. Med. 80, 2402–2414 (2018).
7. Geeraert, B. L. et al. A comparison of inhomogeneous magnetization transfer, myelin volume fraction, and diffusion tensor imaging measures in healthy children. NeuroImage 182, 343–350 (2018).
8. Morris, S. R., Frederick, R., MacKay, A. L., Laule, C. & Michal, C. A. Orientation dependence of inhomogeneous magnetization transfer and dipolar order relaxation rate in phospholipid bilayers. J. Magn. Reson. 338, 107205 (2022).
9. Birkl, C., Doucette, J., Fan, M., Hernández-Torres, E. & Rauscher, A. Myelin water imaging depends on white matter fiber orientation in the human brain. Magn. Reson. Med. 85, 2221–2231 (2021).
10. Alderson, H. E. & Does, M. D. Orientation Dependence of Myelin Water Fraction as Measured by MET2. in Proc. Intl. Soc. Mag. Reson. Med. 30 (2022).
11. Prasloski, T., Mädler, B., Xiang, Q.-S., MacKay, A. & Jones, C. Applications of stimulated echo correction to multicomponent T2 analysis. Magn. Reson. Med. 67, 1803–1814 (2012).
12. Whittall, K. P. & MacKay, A. L. Quantitative interpretation of NMR relaxation data. J. Magn. Reson. 1969 84, 134–152 (1989).
13. Andersson, J. L. R. & Sotiropoulos, S. N. An integrated approach to correction for off-resonance effects and subject movement in diffusion MR imaging. NeuroImage 125, 1063–1078 (2016).
14. Andersson, J. L. R., Graham, M. S., Zsoldos, E. & Sotiropoulos, S. N. Incorporating outlier detection and replacement into a non-parametric framework for movement and distortion correction of diffusion MR images. NeuroImage 141, 556–572 (2016).
15. Smith, S. M. Fast robust automated brain extraction. Hum. Brain Mapp. 17, 143–155 (2002).
16. Jenkinson, M., Beckmann, C. F., Behrens, T. E. J., Woolrich, M. W. & Smith, S. M. FSL. NeuroImage 62, 782–790 (2012).
17. Mori, S., Wakana, S., Zijl, P. C. M. van & Nagae-Poetscher, L. M. MRI Atlas of Human White Matter. (Elsevier, 2005).
18. Zhang, Y., Brady, M. & Smith, S. Segmentation of brain MR images through a hidden Markov random field model and the expectation-maximization algorithm. IEEE Trans. Med. Imaging 20, 45–57 (2001).
19. Aboitiz, F., Scheibel, A. B., Fisher, R. S. & Zaidel, E. Fiber composition of the human corpus callosum. Brain Res. 598, 143–153 (1992).
20. Veraart, J., Raven, E. P., Edwards, L. J., Weiskopf, N. & Jones, D. K. The variability of MR axon radii estimates in the human white matter. Hum. Brain Mapp. 42, 2201–2213 (2021).
21. Dvorak, A. V. et al. An atlas for human brain myelin content throughout the adult life span. Sci. Rep. 11, 269 (2021).
22. Tax, C. M. W. et al. Measuring compartmental T2-orientational dependence in human brain white matter using a tiltable RF coil and diffusion-T2 correlation MRI. NeuroImage 236, 117967 (2021).
23. Gil, R. et al. An in vivo study of the orientation-dependent and independent components of transverse relaxation rates in white matter. NMR Biomed. 29, 1780–1790 (2016).
24. Knight, M. J., Dillon, S., Jarutyte, L. & Kauppinen, R. A. Magnetic Resonance Relaxation Anisotropy: Physical Principles and Uses in Microstructure Imaging. Biophys. J. 112, 1517–1528 (2017).
25. Oh, S.-H., Kim, Y.-B., Cho, Z.-H. & Lee, J. Origin of B0 orientation dependent R2* (=1/T2*) in white matter. NeuroImage 73, 71–79 (2013).
26. Fan, Q. et al. Axon diameter index estimation independent of fiber orientation distribution using high-gradient diffusion MRI. NeuroImage 222, 117197 (2020).
27. Baumeister, T. R., Kolind, S. H., MacKay, A. L. & McKeown, M. J. Inherent spatial structure in myelin water fraction maps. Magn. Reson. Imaging 67, 33–42 (2020).
Figures