1127
3D volumetric myelin water phase mapping via short-TR adiabatic inversion recovery (STAIR) MRI1Department of Radiology, University of California, San Diego, La Jolla, CA, United States, 2Department of Bioengineering, University of California, San Diego, La Jolla, CA, United States, 3GE Healthcare, San Diego, CA, United States, 4Radiology Service, Veterans Affairs San Diego Healthcare System, La Jolla, CA, United States
Synopsis
Keywords: White Matter, Contrast Mechanisms
Demyelination is a common hallmark of neurodegenerative diseases such as multiple sclerosis. Thus, selective imaging of myelin will greatly enhance the diagnosis of such diseases. Here, we demonstrate the feasibility of acquiring whole-brain 3D myelin water phase maps via short-TR adiabatic inversion recovery (STAIR) MRI. The phase of proton density-weighted (PD) images was subtracted from the phase of STAIR images to remove the background field. The overall positive frequency shift, with a larger shift in the splenium of the lower slice, matches the white matter fiber orientation.Introduction
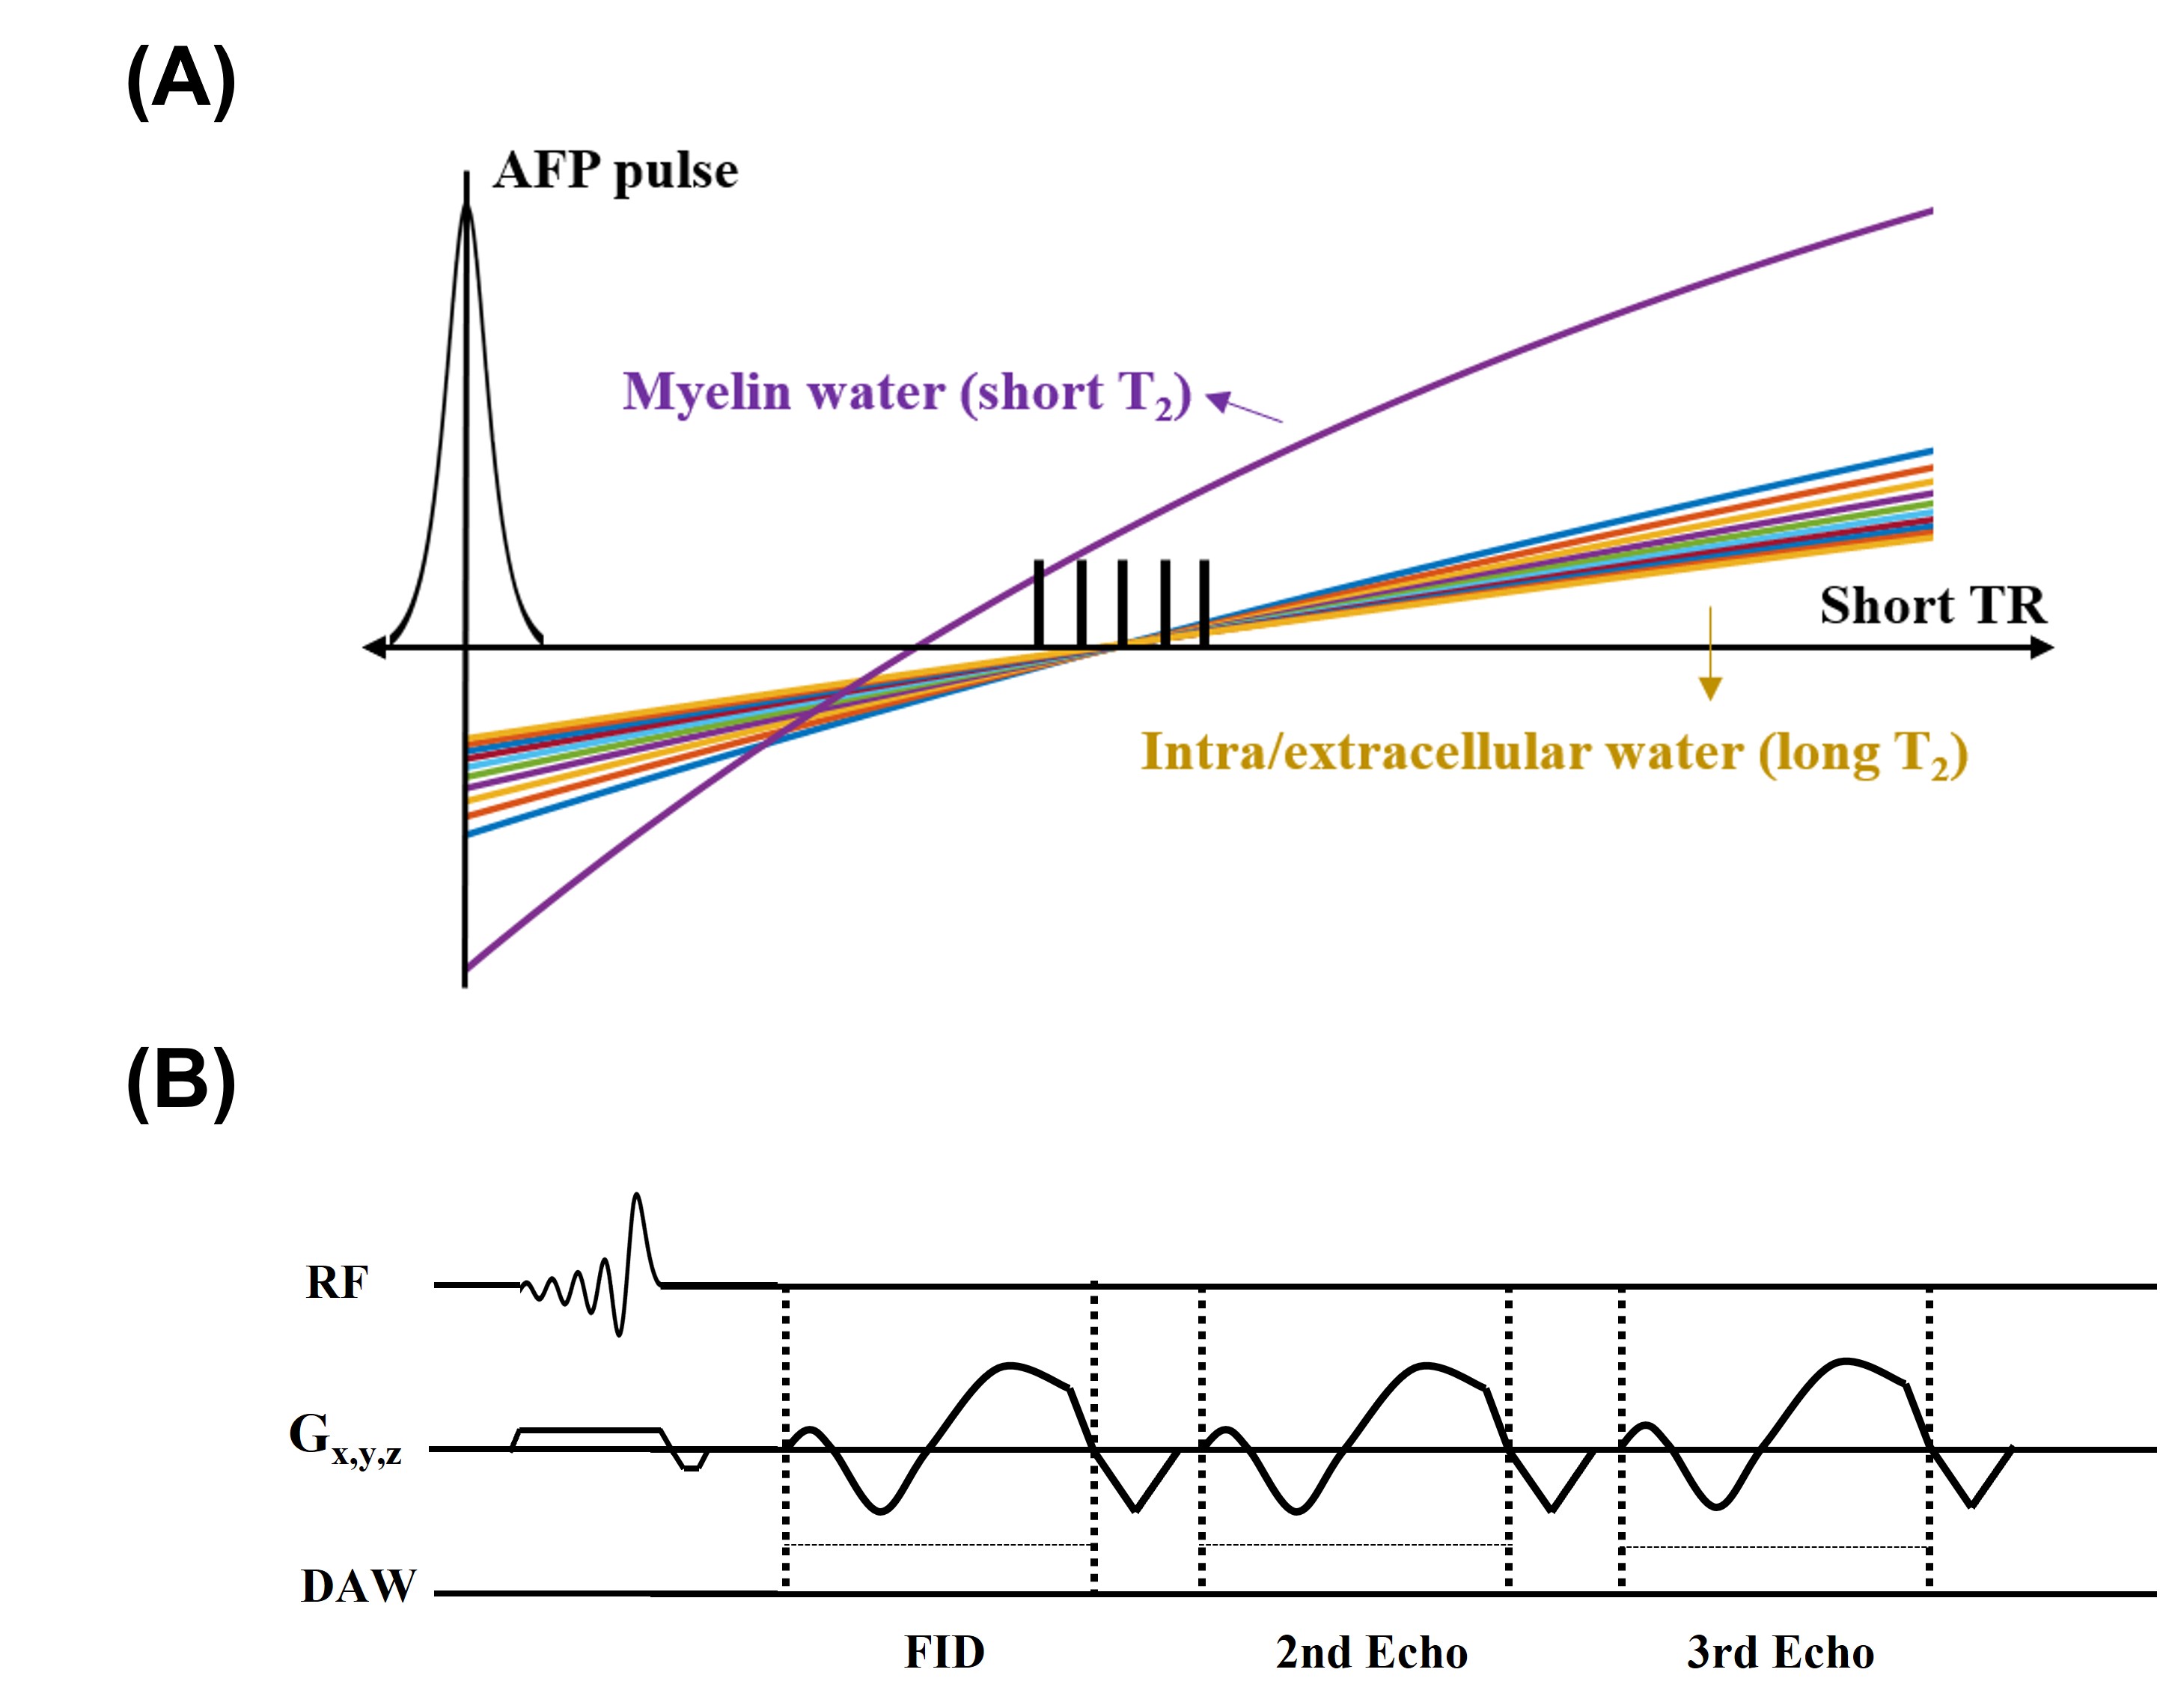
Selective imaging of myelin water has been of great interest as demyelination is a common hallmark of neurodegenerative diseases such as multiple sclerosis. Several MR approaches have been developed for this purpose, and the magnitude of the myelin water signals was shown to be well correlated to the myelination level1. The phase of the myelin water signal may also be an insightful imaging marker as it reflects the orientation of tissue fiber2. Most recently, we developed a short-TR adiabatic inversion recovery (STAIR) technique for selective myelin water imaging and quantification. It uses an adiabatic full passage (AFP) pulse and a short repetition time (TR) to effectively suppress MR signals from all the long T2 water (i.e., intra/extracellular water) components3. This STAIR technique has also been shown to incorporate 3D acquisition, covering the whole brain in a reasonable scan time. Here, we demonstrate that the STAIR approach can also be used to selectively acquire phase information of the whole-brain myelin water.Methods
A healthy subject was recruited and scanned in a 3T scanner (GE, Milwaukee, WI) with an eight-channel head coil for signal reception. The inversion recovery was achieved by applying an AFP pulse (Figure 1A). The optimal inversion time (TI) was set to 114 ms to null long T2 components. The readout was performed via 3D UTE cone sequence with the following parameters: TR = 250 ms, TE = 0.8, 4, and 7.2 ms. FOV = 220 mm × 220 mm × 144 mm, matrix = 140 × 140 × 36, number of spokes per TR = 3. For comparison, proton density (PD)-weighted images were also acquired without inversion pulses (Figure 1B). To extract the pure myelin water phase, the phase subtraction of PD from STAIR images (i.e., STAIR-PD) was performed to remove the background B0 field from the STAIR phase images. This process also assumes that the total water phase is negligible compared to the myelin water phase, especially when the TEs are relatively short4. Linear fitting of phase evolution over three TEs was performed to generate the frequency shift map. The phase and frequency shift maps from STAIR, PD, and STAIR-PD were compared in the upper and lower slices of the brain to investigate the phase variation based on the fiber orientation.Results
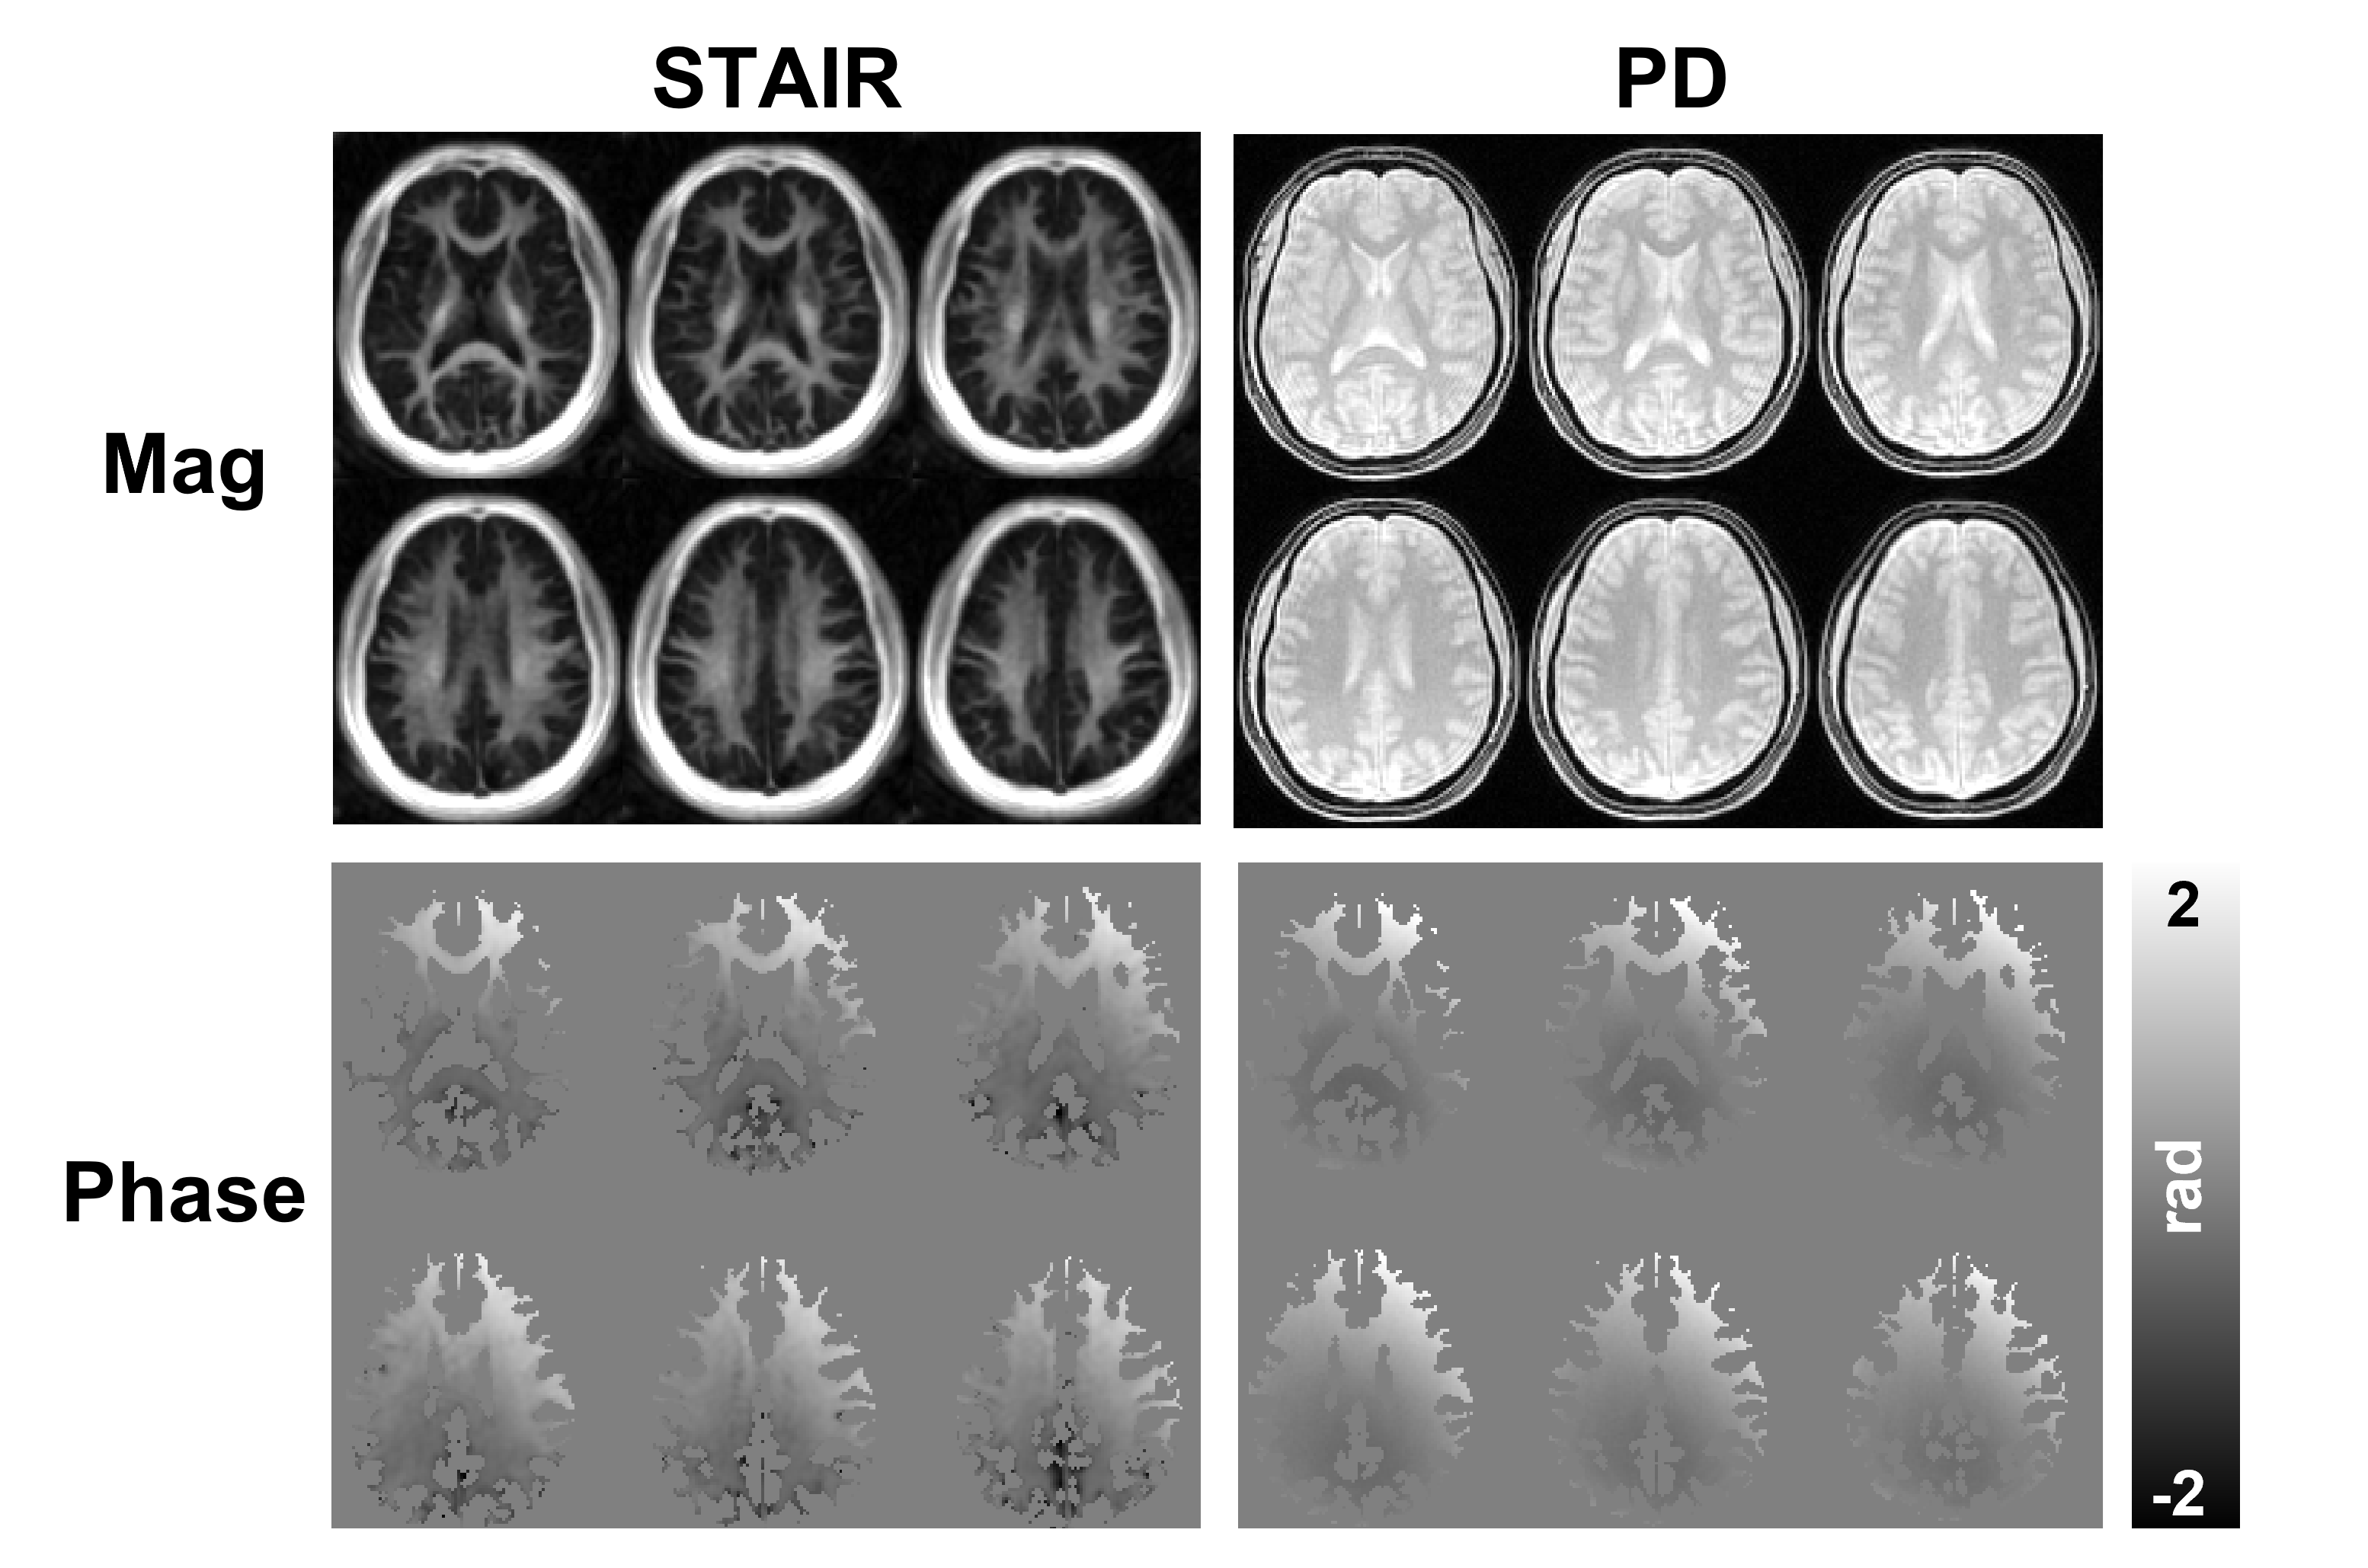
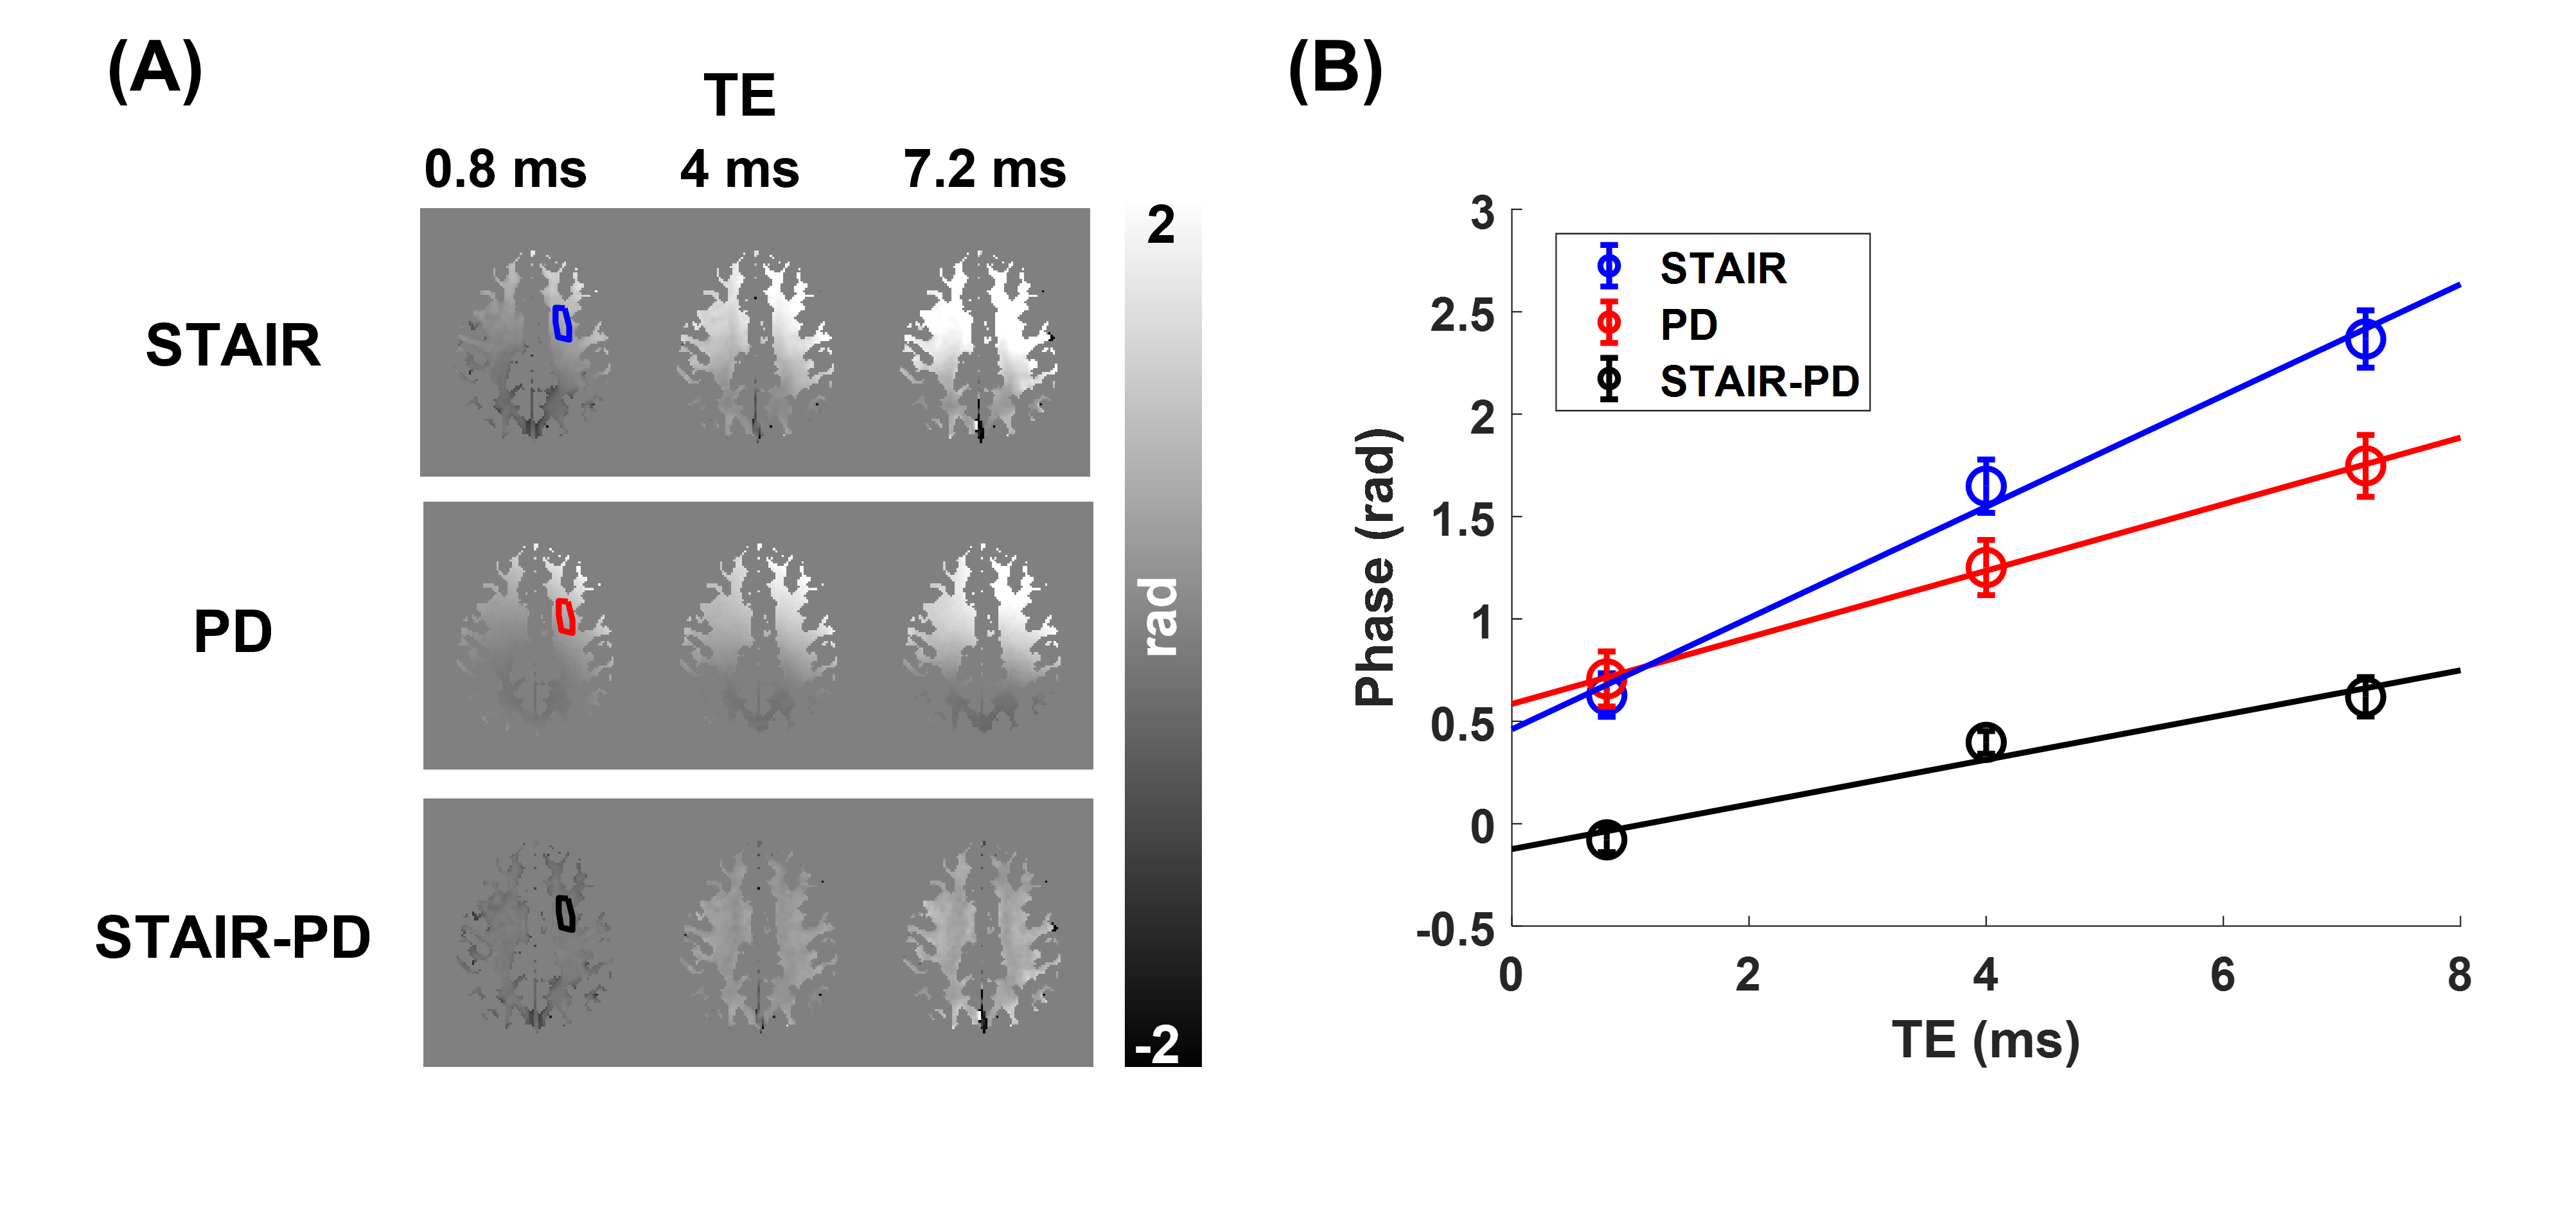
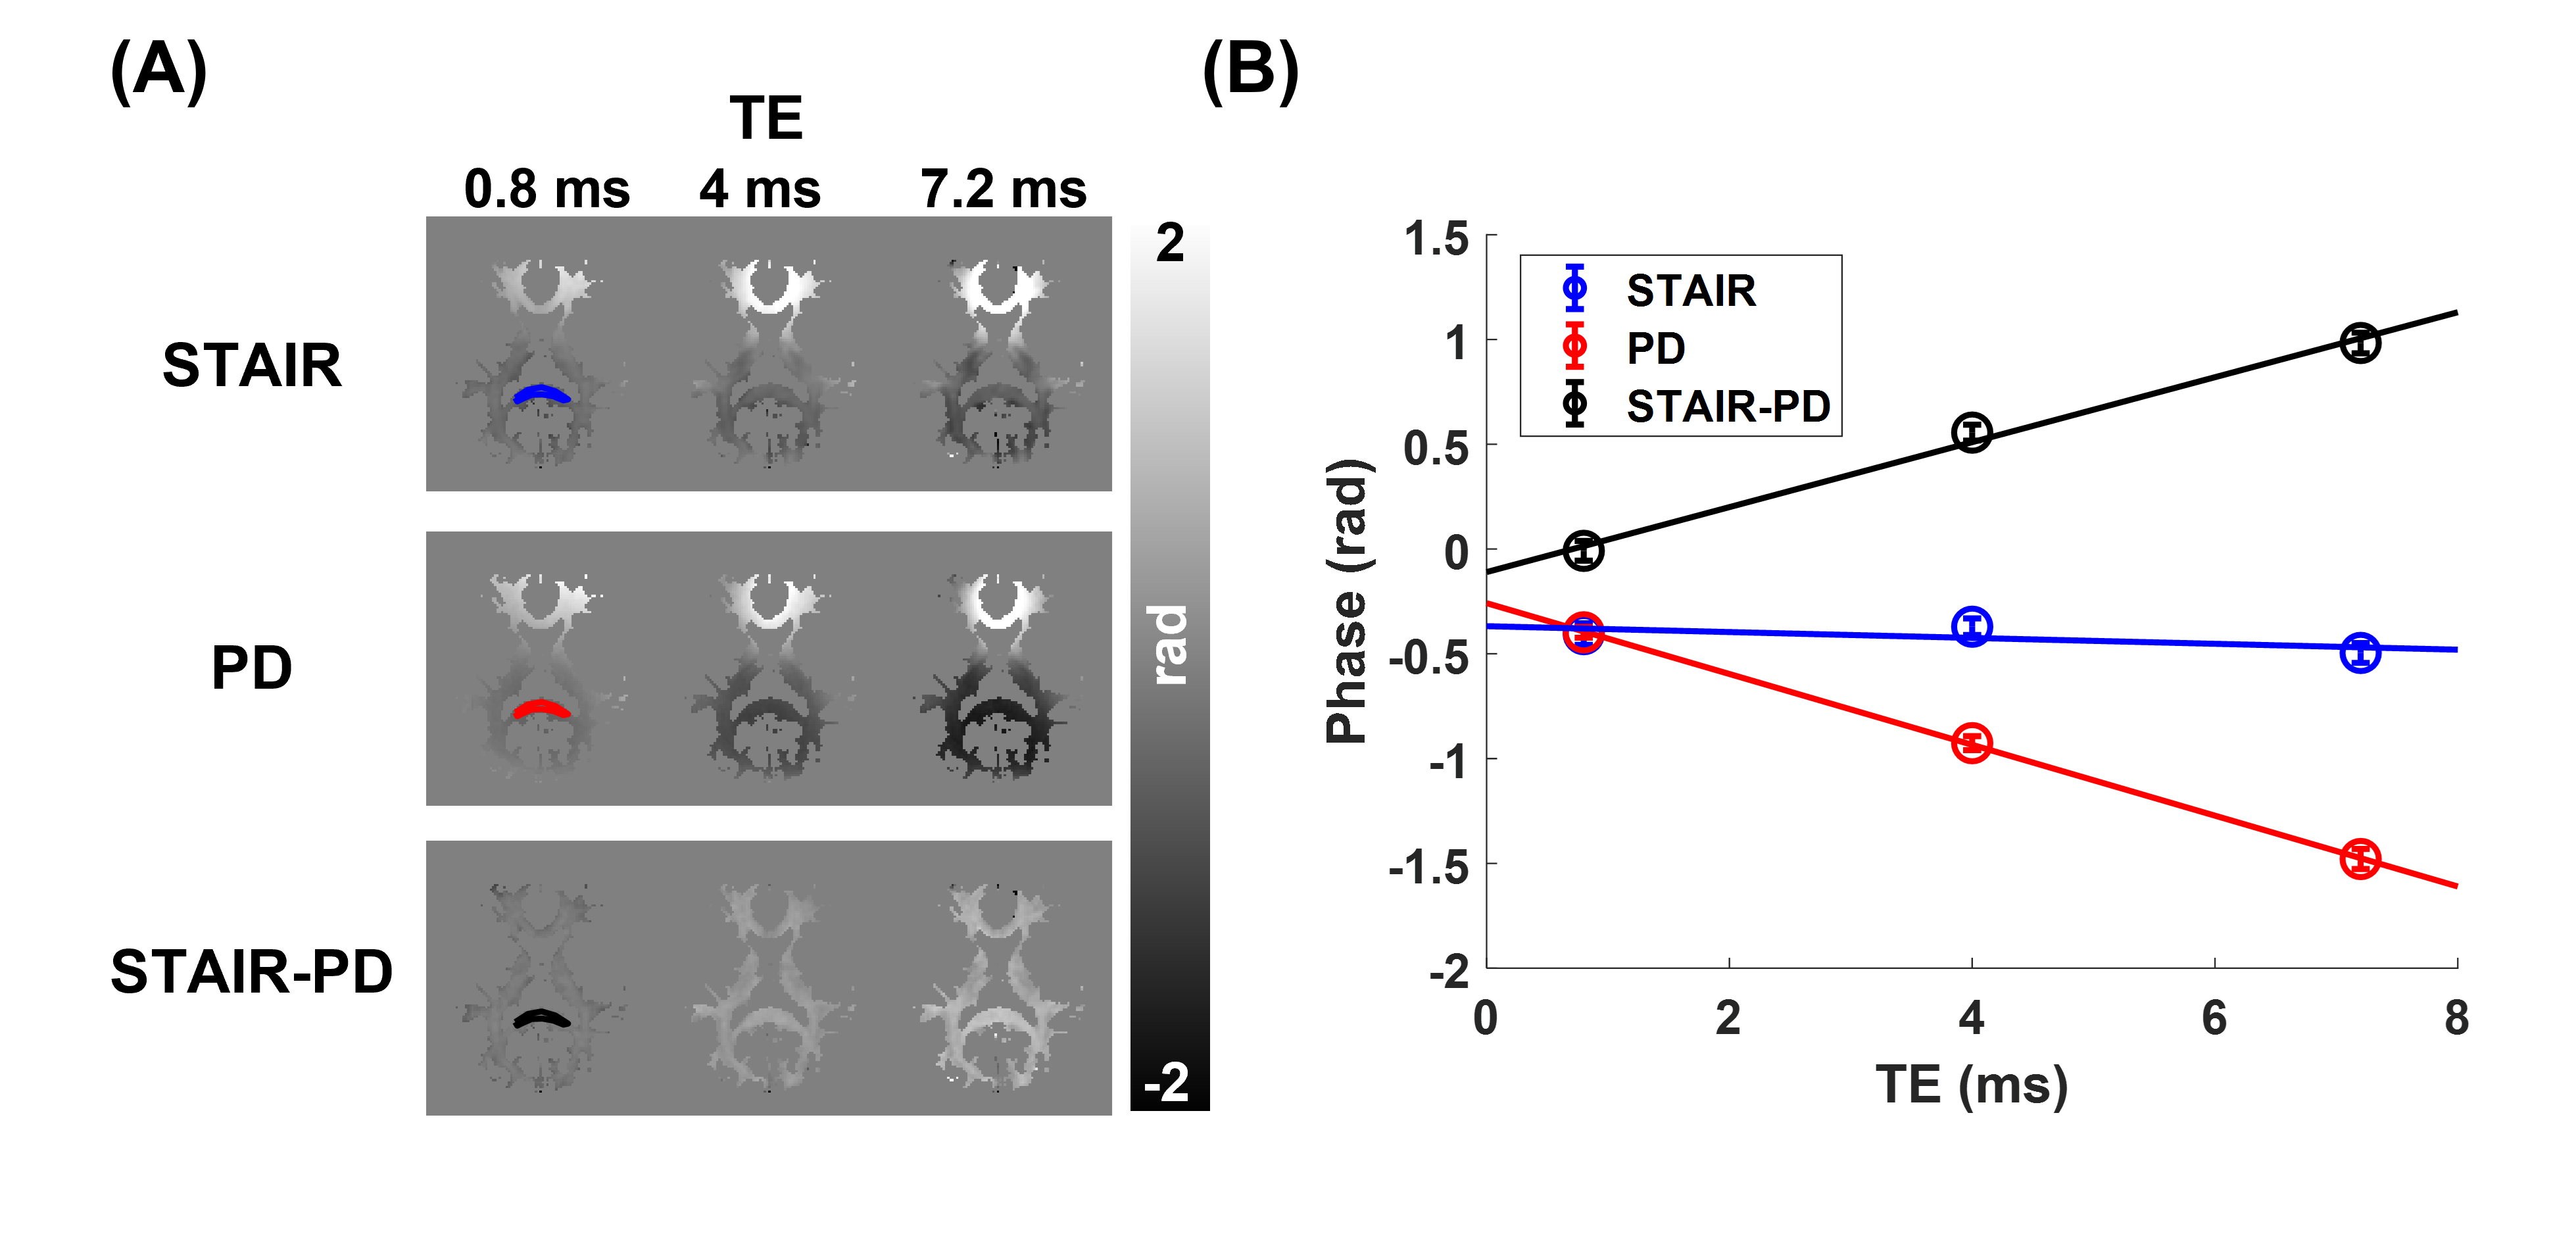
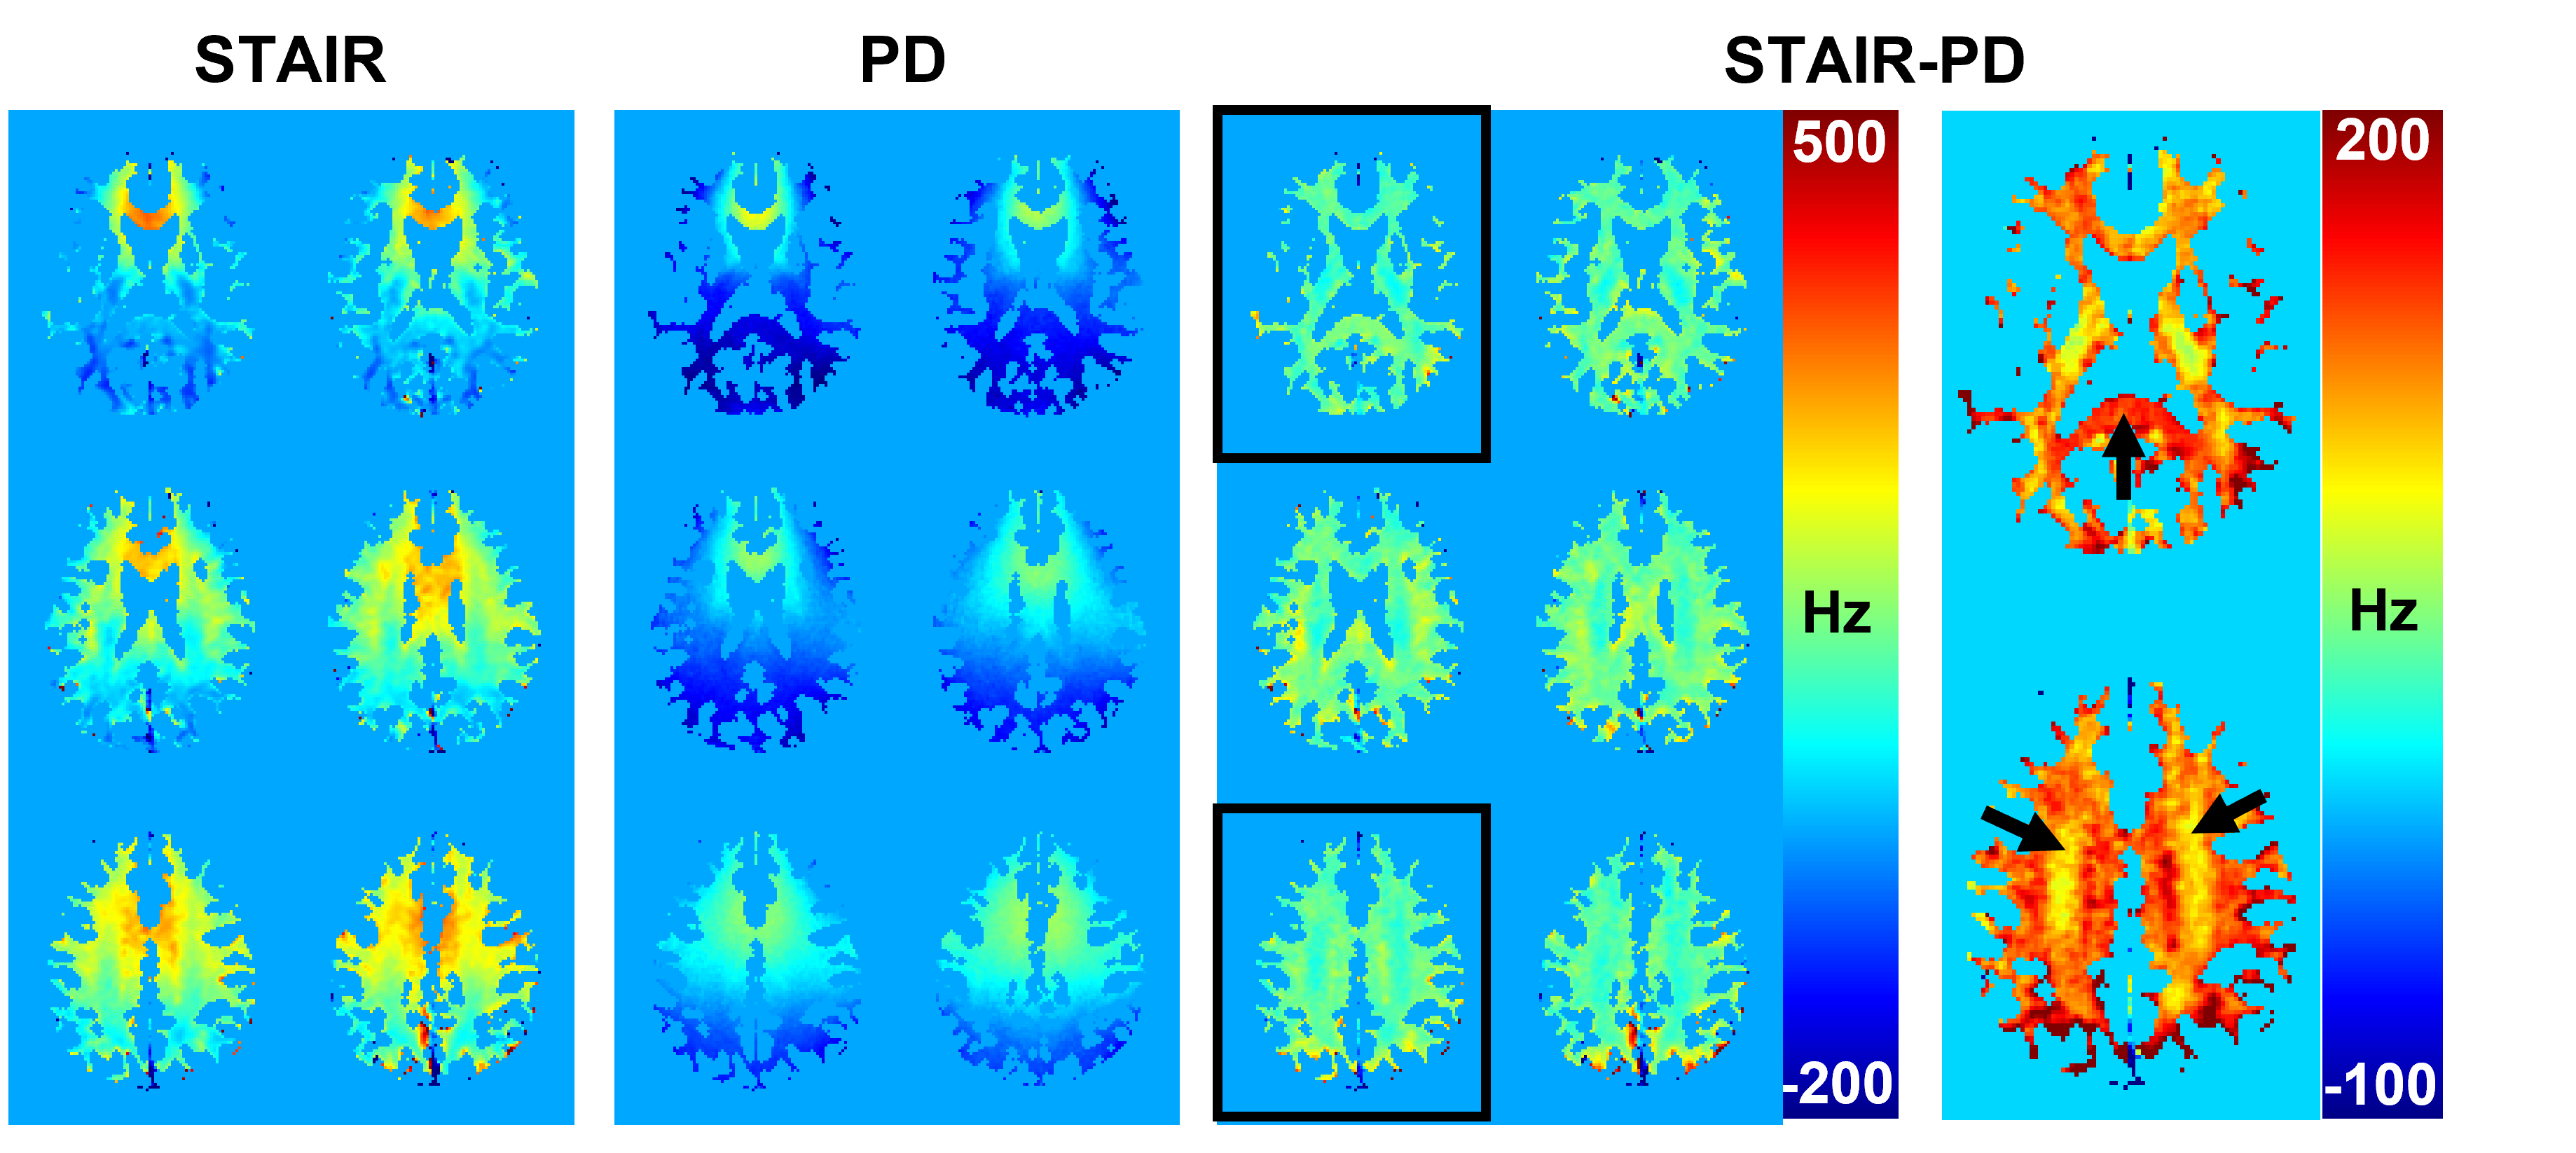
The magnitude images from the STAIR sequence reveal that signals from the gray matter are largely suppressed, and mainly signals from the white matter are acquired (Figure 2). The PD-weighted images show signals from both white and gray matter, with lower intensities in the white matter. Phase maps from both sequences show spatial variations, mainly induced by the background field, with a positive phase in the anterior region and a negative phase in the posterior region. The measurement of phase changes over TEs reveals an increase of phase in the upper slice of the brain from the phase maps acquired via STAIR, PD, and STAIR-PD (Figure 3). The lower brain slice, on the other hand, shows little phase change from the STAIR sequence, and negative phase change from the PD phase map (Figure 4A). STAIR-PD shows an increase in the phase that is comparable to the one observed from the upper slice (Figure 4B). The linear fitting of phase changes generated frequency shift maps from STAIR, PD, and STAIR-PD (Figure 5). Similar to the phase maps, a large spatial variation of frequency shift is observed from STAIR and PD field maps. This spatial variation of the field is removed from the STAIR-PD field map. Most interestingly, the subtracted field maps show regional variations that match the different white matter fiber orientations.Discussion
Here, we demonstrate the feasibility of acquiring 3D phase maps of myelin water by using the STAIR sequence. We also measured the frequency shift via linear fitting of phases over different TEs. While previous myelin water phase maps showed an overall positive frequency shift4, our STAIR phase maps showed no frequency shift in the splenium of the lower slice of the brain. This may be due to the highly negative background field at the splenium, supported by the observation of the frequency shift map from the PD images (Figure 5). As a simple way of removing the background field, we subtracted the PD phase from the STAIR phase (STAIR-PD) based on the assumption that the background fields are the same for the two acquisitions. After the subtraction, the huge spatial variation of the frequency shift was removed (Figure 5). In addition, both the upper and lower slices showed a positive frequency shift, with more shift at the splenium from the lower slice (Figures 3 and 4). This observation matches the fiber orientation of the splenium (perpendicular to the B0 field) and the corticospinal and corpus callosal tracts of the upper slice (parallel to the B0 field)4,5. To be more precise, however, the actual fiber orientation should also be measured6, and a validated background removal method should be applied7,8.Conclusion
The STAIR sequence can image the myelin water phase of the whole brain. Upon simple background field removal by subtracting the phase from PD images, the measured frequency shift matches the fiber orientation of the myelin water.Acknowledgements
The authors acknowledge grant support from the National Institutes of Health (R01AR062581, R01AR068987, R01AR075825, R01AR079484, R01AR078877, RF1AG075717, and R21AR075851), VA Clinical Science and Rehabilitation Research and Development Services (Merit Awards I01CX001388, I01CX002211, and I01RX002604), and GE Healthcare.References
1. C Laule, E Leung, DKB Li et al., Myelin water imaging in multiple sclerosis: quantitative correlations with histopathology. Mult Scler, 2006;12:747-753.
2. Wharton S, Bowtell R. Fiber orientation-dependent white matter contrast in gradient echo MRI. Proc Natl Acad Sci. 2012;109:18559-18564.
3. Y-J Ma, H Jang, AF Lombardi et al., Myelin water imaging using a short-TR adiabatic inversion-recovery (STAIR) sequence. Magn Reson Med. 2022;88:1156-1169.
4. D Kim, HM Lee, S-H Oh, J Lee. Probing signal phase in direct visualization of short transverse relaxation time component (ViSTa). Magn Reson Med. 2015;74:499-505.
5. Sati P, Gelderen Pv, Silva AC et al., Micro-compartment specific T2* relaxation in the brain. NeuroImage. 2013;77:268-278.
6. A Seehaus, A Roebroeck, M Bastiani et al., Histological validation of high-resolution DTI in human post mortem tissue. Front neuroanat. 2015;9:98.
7. T Liu, I Khalidov, L de Rochefort et al. A novel background field removal method for MRI using projection onto dipole fields (PDF). NMR Biomed. 2011;24:1129-1136.
8. H Sun, AH Wilman. Background field removal using spherical mean value filtering and Tikhonov regularization. Magn Reson Med. 2014;71:1151-1157.
Figures