1126
Morphological comparison of deep white matter bundles between the human and chimpanzee brain using a geometrical approach
Maelig Chauvel1, Ivy Uszynski1, Marco Pascucci1, Bastien Herlin1, Yann Leprince2, Jean-François Mangin1, William Hopkins3, and Cyril Poupon1
1Université Paris-Saclay, CEA, CNRS, UMR 9027, BAOBAB, NeuroSpin , Gif-sur-Yvette, France, Saclay, France, 2UNIACT, NeuroSpin, Université Paris-Saclay, CNRS, CEA, Gif-sur-Yvette, France, Saclay, France, 3Michele E Keeling Center for Comparative Medicine and Research, The University of Texas MD Anderson Cancer Center, Bastrop, Texas, TX, United States
1Université Paris-Saclay, CEA, CNRS, UMR 9027, BAOBAB, NeuroSpin , Gif-sur-Yvette, France, Saclay, France, 2UNIACT, NeuroSpin, Université Paris-Saclay, CNRS, CEA, Gif-sur-Yvette, France, Saclay, France, 3Michele E Keeling Center for Comparative Medicine and Research, The University of Texas MD Anderson Cancer Center, Bastrop, Texas, TX, United States
Synopsis
Keywords: White Matter, Brain Connectivity, chimpanzee, white matter atlas
Humans and chimpanzees are related by a common ancestor that lived around 6 to 7 millions years ago. From then, a cascade of acquired brain features have occurred and the scientific community has tried for years to capture them. Providing measures of the hominin brain divergences or conserved characters can be challenging considering the multitude of variables involved. We propose here a study relying on an intuitive and yet innovative morphological analysis of the deep white matter (DWM) bundles of the human and chimpanzee brain using isomap algorithm.Introduction
Humans and chimpanzees are related by a common ancestor that lived around 6 to 7 millions years ago1. Providing measures of the hominin brain divergences or conserved characters can be challenging considering the cascade of acquired brain features that have occurred. We propose here a study relying on an intuitive and yet innovative morphological analysis of the deep white matter (DWM) bundles of the human and chimpanzee brain. We used an isomap algorithm2 to capture the features traducing the belonging of DWM bundles to the two species, allowing us to : identify the mean morphology of each species bundle and assess the degree of divergence between them by providing bundles geometrical measures.Methods
The chimpanzee atlas considered is the one presented in Chauvel et al. 2022 (10.5281/zenodo.7147789) (see figure 1). The atlas was built upon a cohort of 39 healthy in vivo chimpanzees from the Yerkes primates center. Each individual was scanned using a 3 Tesla MRI system with a dedicated imaging protocol. Anatomical and diffusion data were processed using a dedicated pipeline using the Ginkgo toolbox (https://framagit.org/cpoupon/gkg). All T1w and diffusion images were matched to a chimpanzee template 3. A 2-step clustering strategy similar to that proposed in Guevara et al. 20114 was used to build up bundles relevant at the population level. The deep fascicle bundles were then manually extracted.The human atlas considered for this article is the one from Chauvel et al. 2022 (see figure 1) (10.5281/zenodo.7308510). It relies on a cohort intentionally matching the one of the chimpanzee atlas, from the Human Connectome Project ( http://www.humanconnectomeproject.org/). Anatomical and diffusion data were processed using a dedicated pipeline following the same steps as for the chimpanzee atlas, adjusting the parameters for humans. All subjects’ MRI data were registered on the MNI space. As for the chimpanzee, the fascicle bundles were clustered and manually extracted.
Both chimpanzee and human atlases were applied to each 39 subjects respectively to obtain each individual’s deep white matter bundles. Each individual bundles are reduced to meshes and then into point clouds to capture their shapes (see figure 2).
We used the BRAINVISA DISCO and DARTEL registration toolbox (https://brainvisa.info/web/publications.html) to bring the species' brains to a common space. For each pair of point clouds we did the following: align the two point clouds and calculate a geometrical distance that is small if the shapes are similar, big if they are different.
The alignment procedure is PCA-based: we extracted the three principal directions from the point-clouds and aligned these axes by calculating the optimal transformation matrix5. Then, we computed the mean pairwise distance between each point. The map of the distances between all the fiber pairs is a NxN matrix, that can be seen as a set of N points in a N-dimensional space, each representing a particular fiber. We applied a dimensionality reduction of the N-dimensional space using the isomap algorithm6. We then kept the dimension depicting the best classification between the two species.
Results
The arcuate, the cortico-spinal (CST), the inferior longitudinal (ILf) displayed an elevated morphological diversity between humans and chimpanzees (see figure 3). The distance measures from the embedding showed that even if some of these bundles visually look alike at first glance, geometrical features identified by the algorithm led to their identification as belonging to humans or chimpanzees. Indeed, for the ILf, a difference can hardly be spotted visually, however, the trajectory of the bundles contains an insight detected by the algorithm, showing that in chimpanzee the ILf tends to be flatter and more twisted than for humans. Concerning the arcuate fasciculus, only the dorsal part seems to be present in the chimpanzee brain, which makes it easily identified by the algorithm. The CST differences between the two species relies mostly on the fact that the foramen magnum is not similarly placed, so the differences observed concerning its shape could be interpreted as a signature for human bipedalism.The algorithm also provided the mean shapes of the bundles giving an idea of the expected aspect of the bundles in each individual. Other bundles such as the uncinate or the IFOF showed less diversity in their morphologies between humans and chimpanzees, indeed the two species bundles’ shapes overlap along the isomap axis. Some bundles also showed a high diversity of shapes for one species and not the other, as for the frontal aslants which depicted a high degree of diversity along the isomap axis in chimps while the humans’ were restricted to the beginning of the axis. This could be linked to the higher degree of variability in the frontal lobe cortical folding for the chimpanzee compared with human.
Discussion
The work proposed here could provide an insight concerning the proper evolution of each species and the conserved and divergent morphological features from our common ancestor . We propose a study rid of anatomical preconceptions, rigorously replicable between different species providing morphological measures of their similarities and differences in regard to the different DWM bundles.Acknowledgements
We thank the Blaise Pascal International Chairs of Excellence from Ile-de-France Region, dedicated to Pr. W. Hopkins for the funding of this workReferences
1. D. Goldman et al., PNAS, 1987 ; 84(10):3307‑112. Github link : https://github.com/neurospin/point-cloud-pattern-mining
3. S. Vickery et al. bioRxiv, 2020 ; 10.1101/2020.04.20.04
4. P. Guevara et al., Neuroimage, 2012 ; 61(4), 1083-1099
5. B. Bellekens et al., AMBIENT, August 24-28, 2014, Rome, Italy (pp. 8-13)
6. J.B.Tenenbaum et al., Science, 2000 ; 10.1126/science.290.5500.2319
Figures
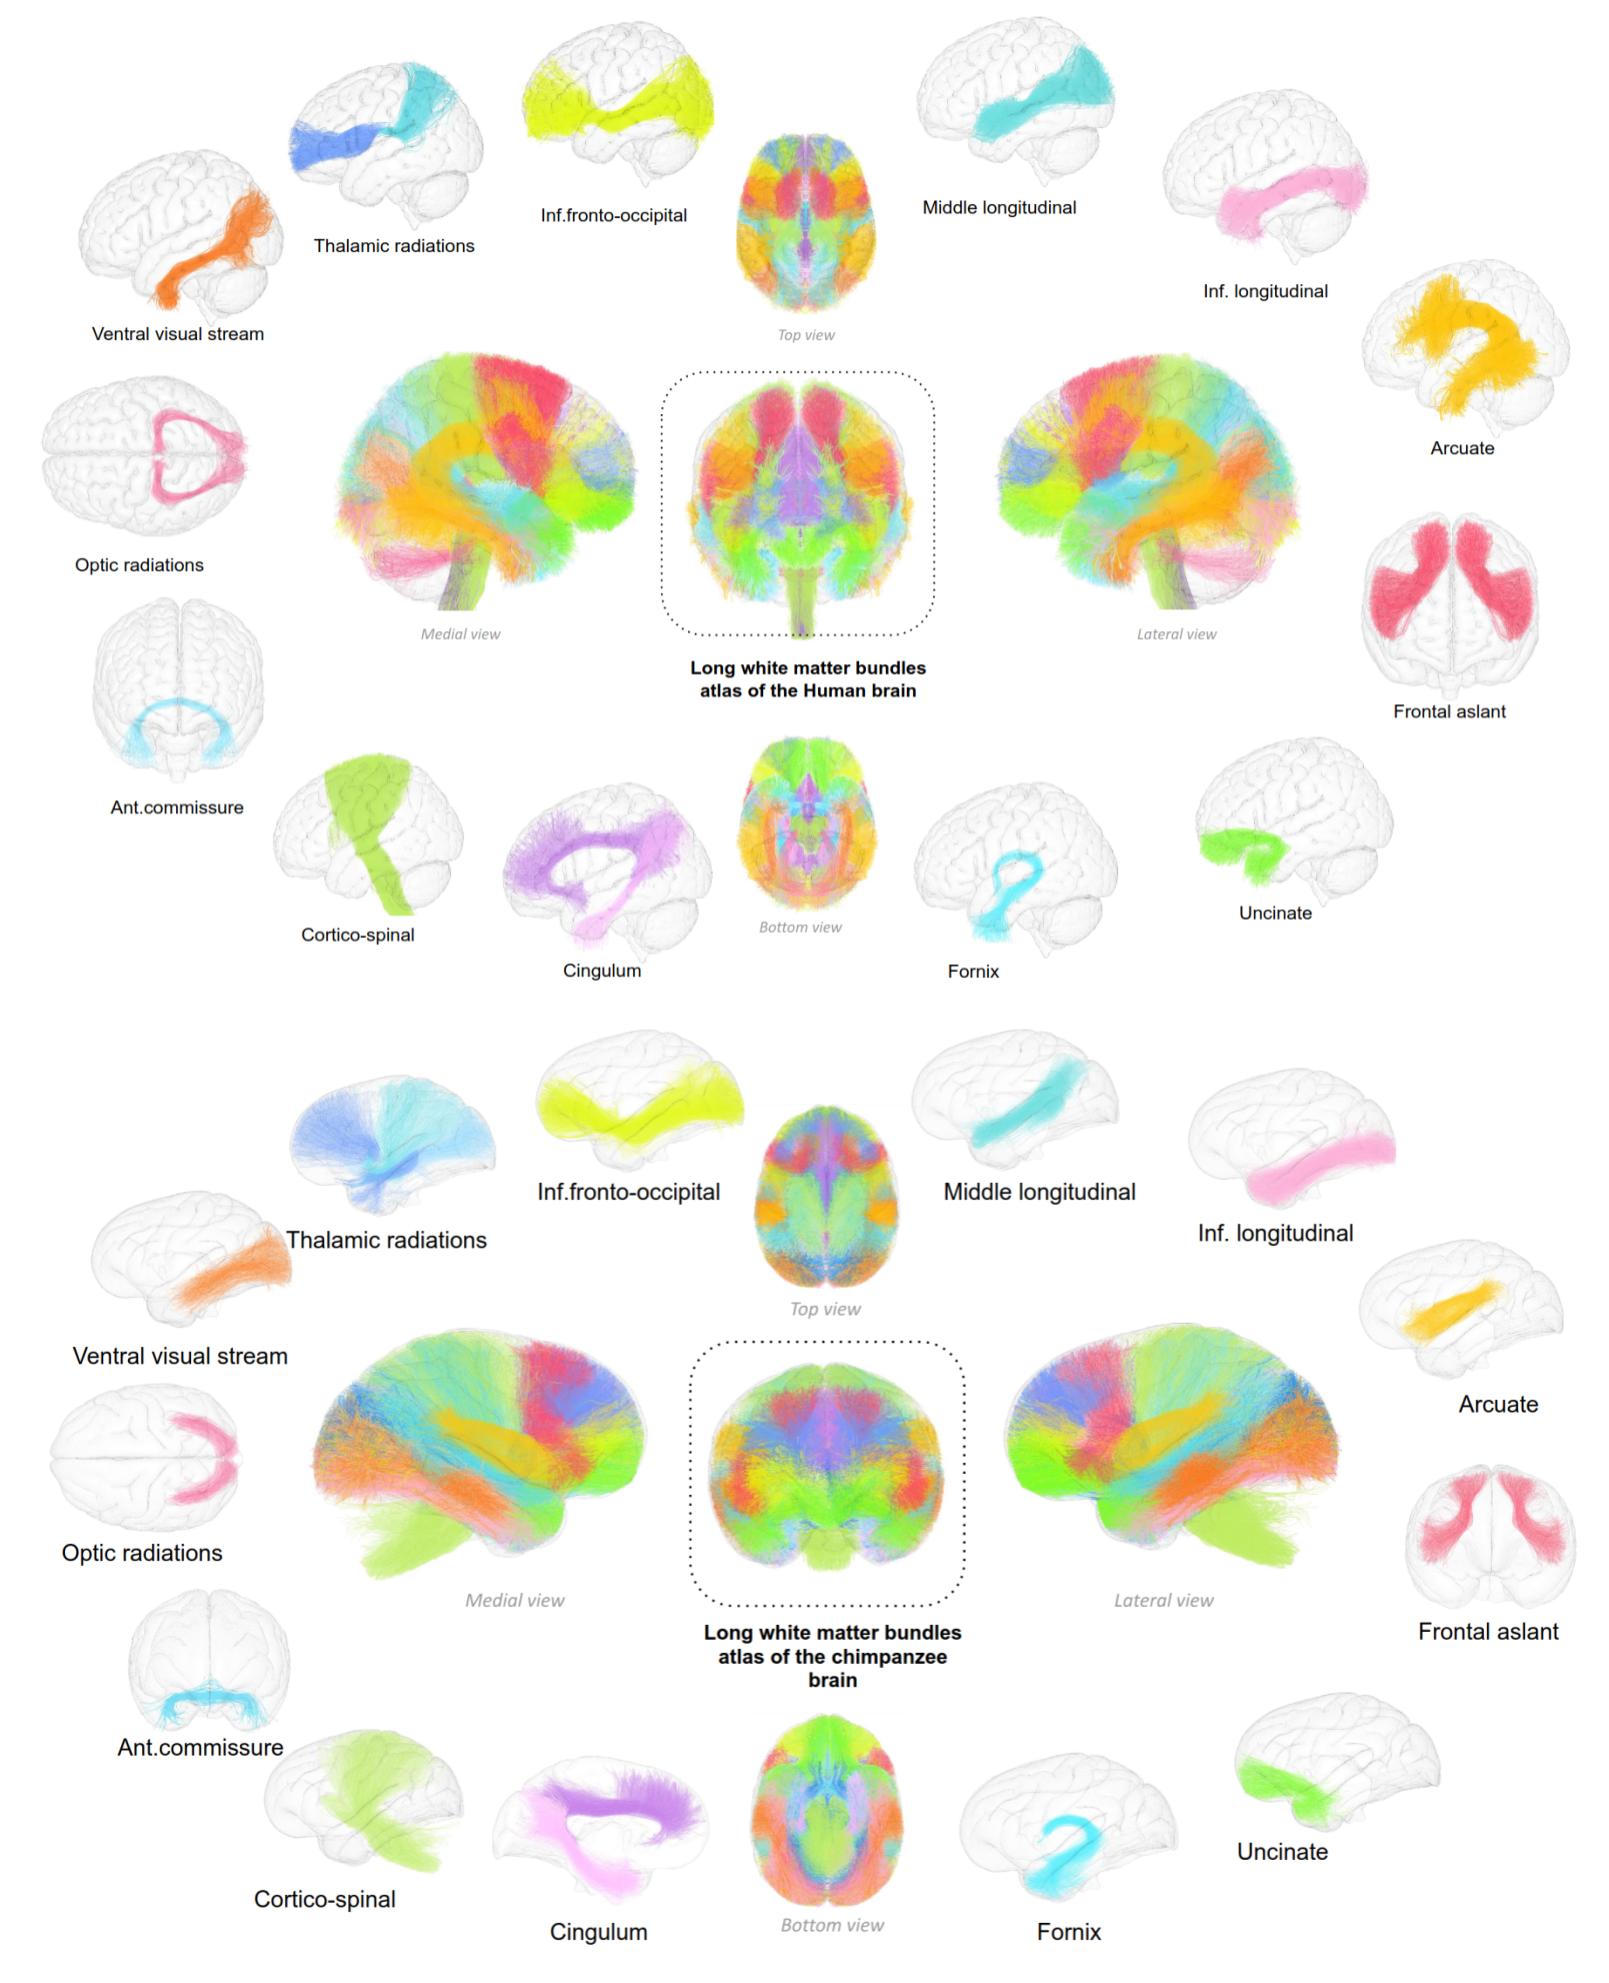
Figure 1: Human and chimpanzee deep white matter (DWM) connectivity atlases. Top : DWM bundles atlas of the human brain ; bottom : DWM bundles atlas of the chimpanzee brain. These atlases are composed of : the thalamic radiations, inferior fronto-occipital fascicle, the middle longitudinal fascicle, the inferior longitudinal fasciculus, the arcuate, the frontal aslants, the uncinate fascicle, the fornix, the dorsal and ventral cingulum, the cortico-spinal tract, the anterior commissure, the optic radiations and the visual occipito-temporal fibers (visual streams).
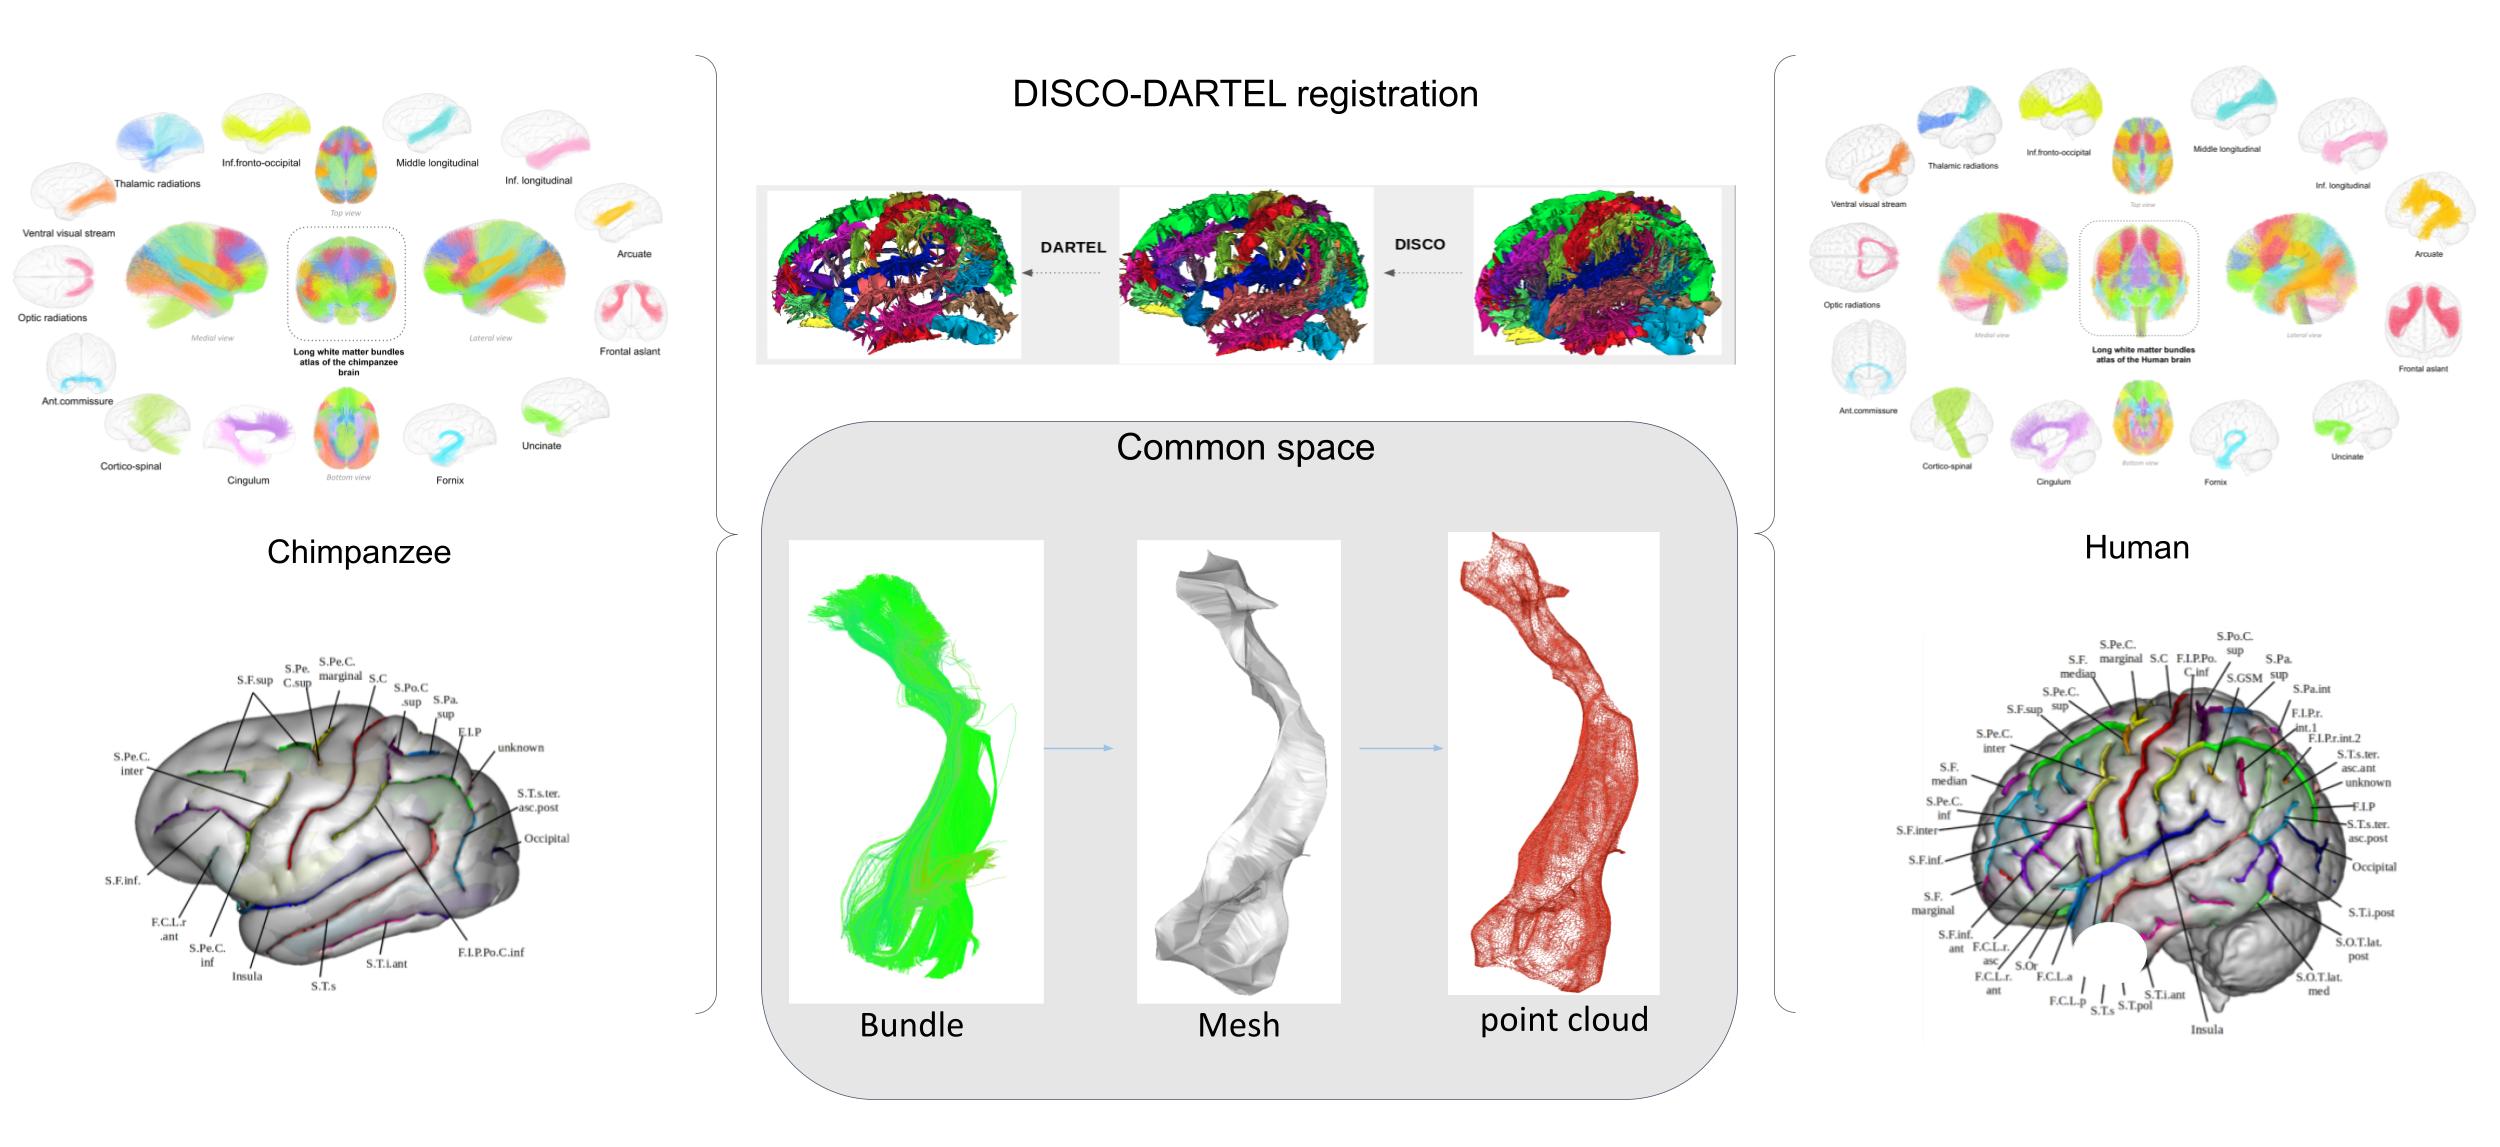
Figure 2 : Pre-processing procedure for the obtention of the fiber bundles point clouds. After selecting sulci relevant for the DISCO and DARTEL registration, we launched the algorithm and obtained the transformation leading from each species individual space to the common space. We applied the atlases respectively on each species and the bundles were projected in the common space for morphological analysis.
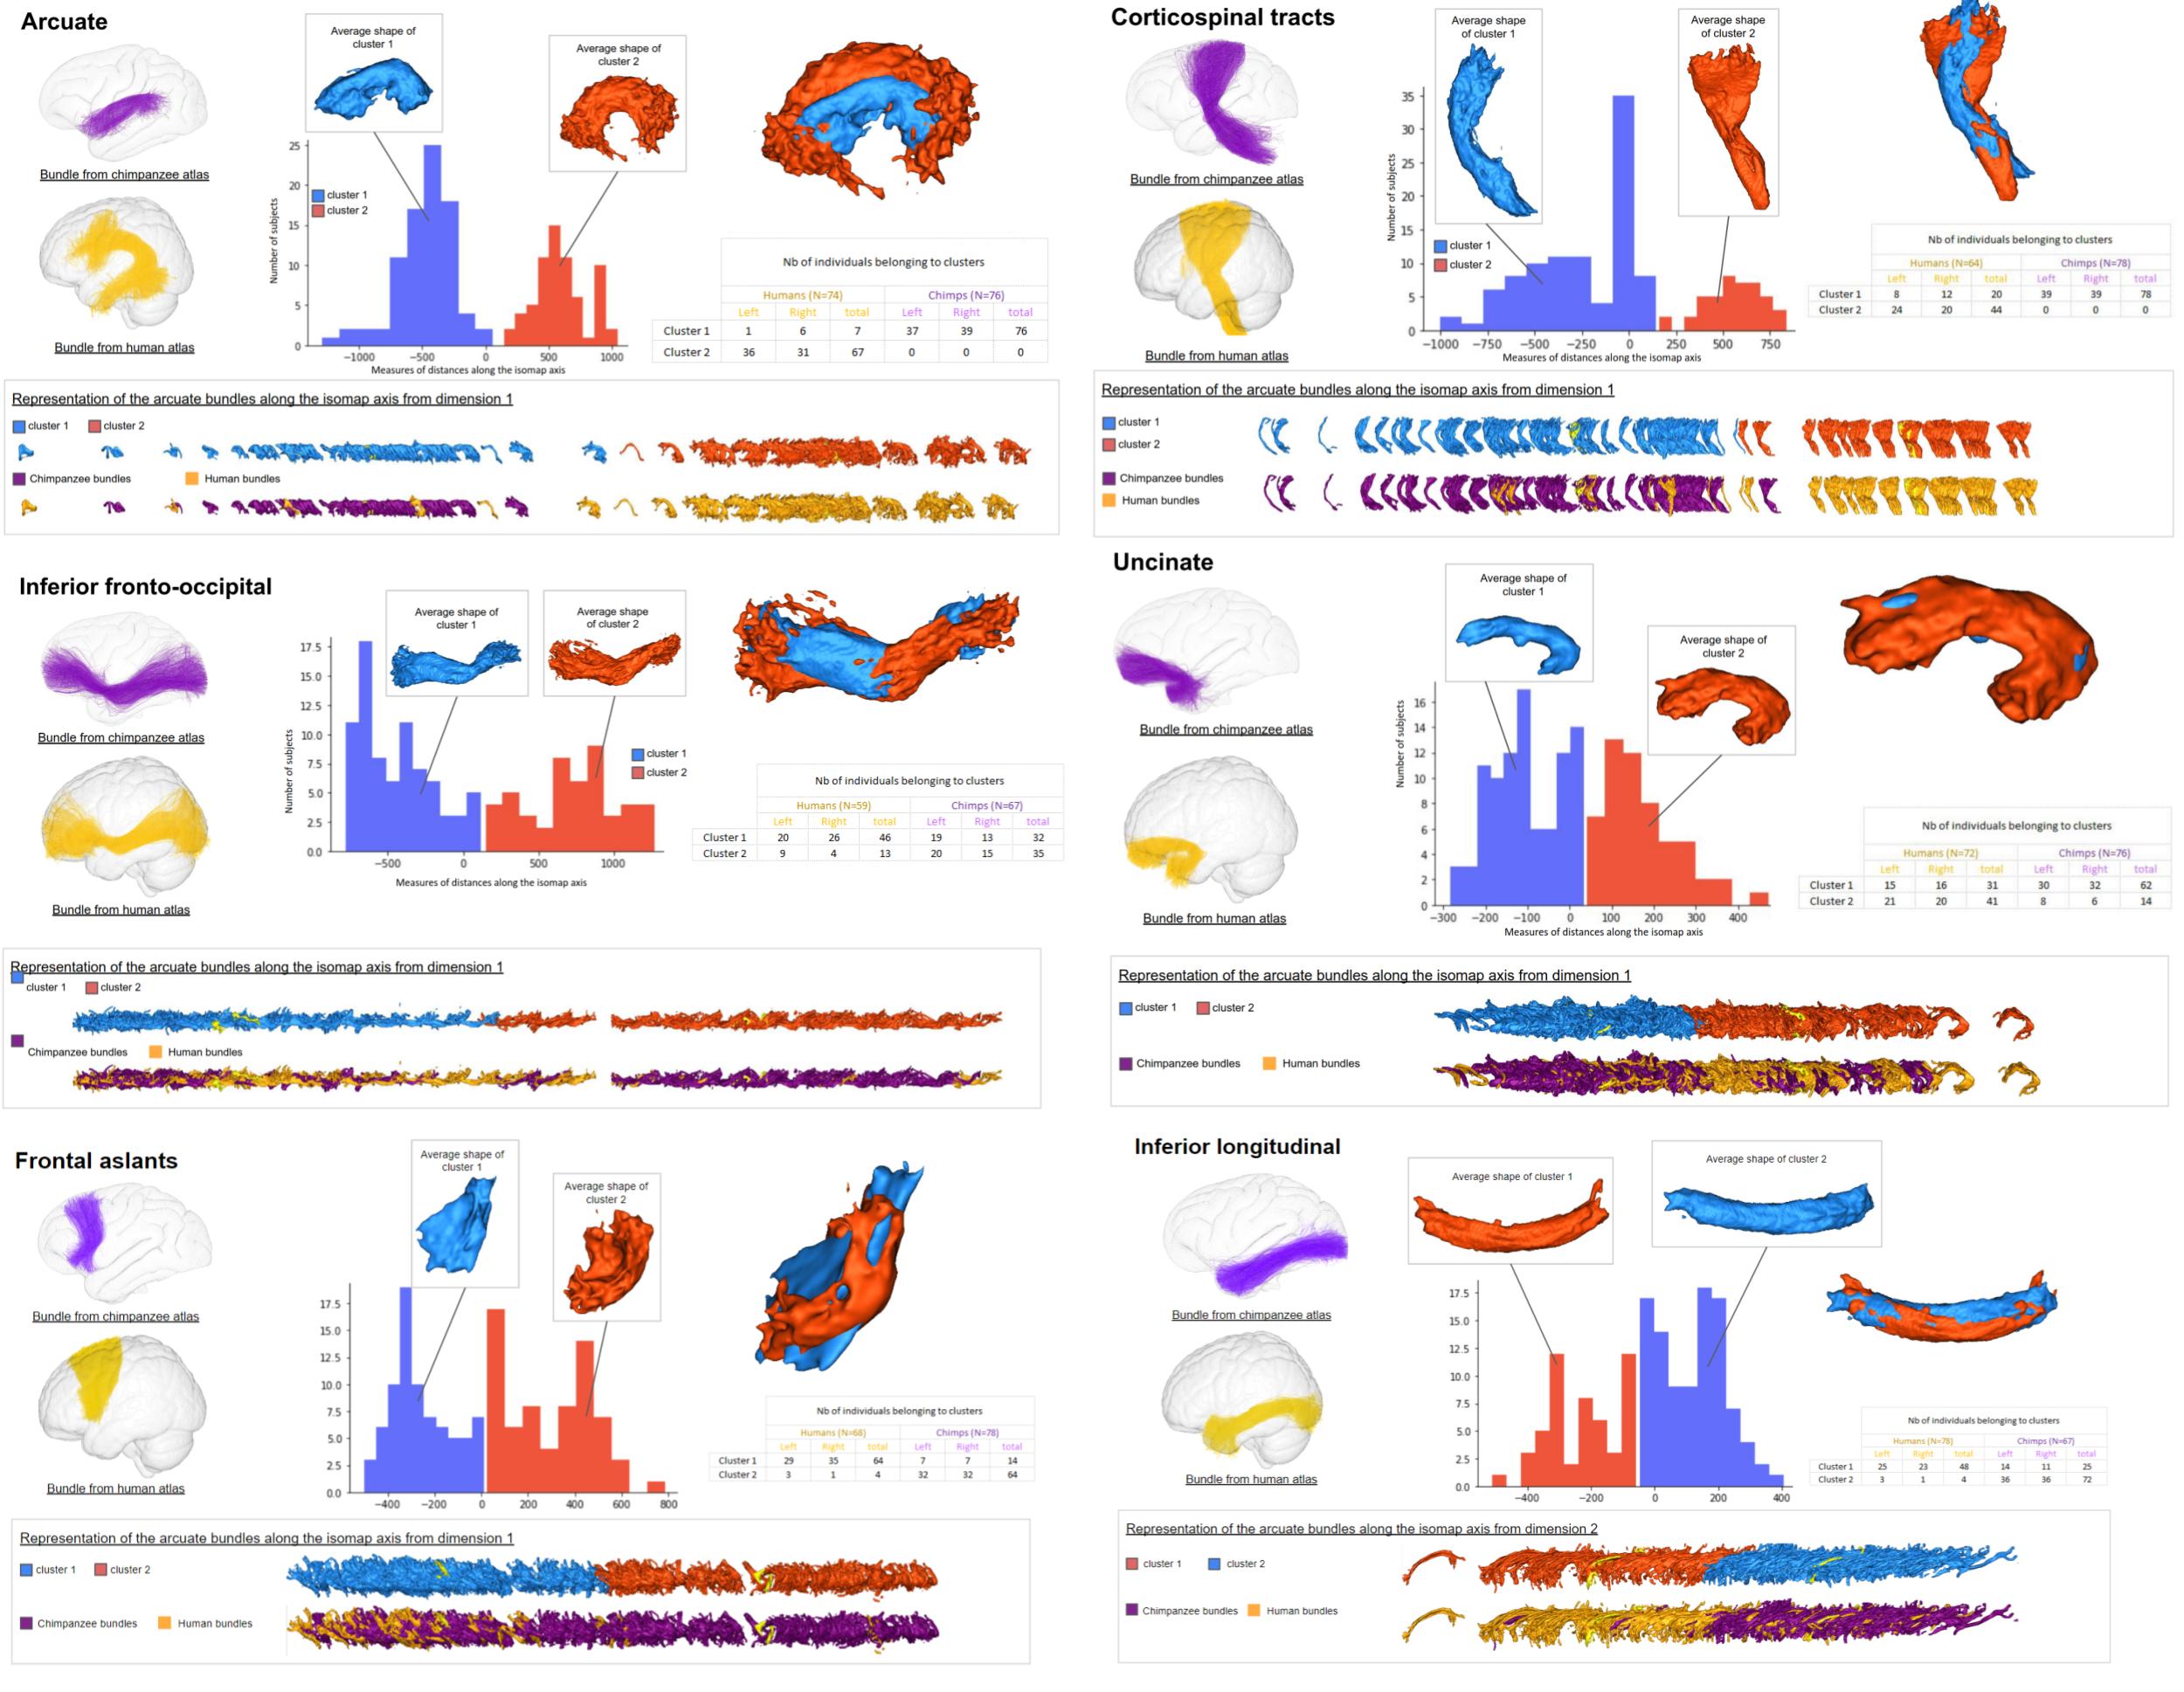
Figure 3 : Examples of results coming out of the algorithm for the dimension that allowed the best separation between the two species. The analyzed bundles from the atlases are : the arcuate fasciculus, the cortico-spinal tract, the inferior fronto-occipital fasciculus, the uncinate fasciculus, the frontal aslants, the inferior longitudinal fasciculus.
DOI: https://doi.org/10.58530/2023/1126