1125
Direct visualization of small anisotropic brain structures using high resolution, multi-shell diffusion MRI1Radiology, Center for biomedical imaging, NYU Grossman School of Medicine, New York, NY, United States, 2Neurosurgery, NYU Grossman School of Medicine, New York, NY, United States
Synopsis
Keywords: White Matter, Data Analysis, high-resolution, visualization
In vivo visualization and quantitative assessment of small anisotropic brain structures is challenging with diffusion MRI because of signal-to-noise limitations. We show that direct visualization of small structures, like the fornix or stria medullaris, dramatically improves using denoised 1-mm isotropic resolution complex-valued dMRI data. This approach also reduces the bias and variance of diffusion parameter estimations for small structures. Increased resolution with denoising decreases parameter variance due to thermal noise and partial volume effects – these data also can be used to better estimate the true biological variance in a structure by extrapolating the data to the infinite SNR limit.
Introduction
Direct in vivo visualization of 1-2 mm diameter anisotropic structures can improve functional neurosurgery targeting and expand the utility of MRI for characterizing several diseases in neuropsychiatry (e.g. medial forebrain bundle). High-resolution postmortem MRI microscopy demonstrates the ultimate potential for high resolution diffusion MRI (dMRI) to detect these structures1. However, in vivo high resolution dMRI is not currently practical clinically owing to cripplingly low SNR at resolution less than 2-mm isotropic.We demonstrate that MPPCA denoising1 of complex dMRI2 results in direct visualization of multiple small white matter pathways including the stria medullaris, perforant pathway and dentatorubrothalamic tract. We use repeated acquisitions from 2mm to 0.8mm isotropic resolution to also validate the accuracy and variability of dMRI parameter estimations using MPPCA denoising. Finally, we demonstrate the possibility of using varying SNR data to extrapolate to the infinite SNR limit and thus estimate the true biological variability within specific structures across different healthy individuals.
Methods
After informed consent, 10 healthy volunteers (5 female, age 33.3+/-13.04 years) underwent non-contrast brain MRI on a Siemens Magnetom Prisma 3T. The protocol included 1-mm isotropic resolution FGATIR (TR/TE/TI = 3/0.019/0.41s, 256x256 matrix, 144 sagittal slices), and 5 axial dMRI sequences all with b = 0(6), 1000(20 dirs), 2000(64 dirs) s/mm2, using different isotropic resolutions (in-plane x slices)- 2.0mm (TR/TE: 4.0/0.073s, 110x110x68, 6:46min)
- 1.5mm (TR/TE: 5.8/0.073s, 138x138x94, 9:56min)
- 1.2mm (TR/TE: 9.0/0.080s, 174x174x120, 15:15min)
- 1.0mm (TR/TE: 9.7/0.088s, 210x210x126, 16:39min)
- 0.8mm (TR/TE: 12/0.105s, 256x256x126, 20:36min)
- Complex-valued MPPCA2: First, smooth image phase $$$\phi_{\textrm{smooth}}$$$ was estimated with MPPCA on a 15x15 2D box-shaped kernel, and unwound: $$$S_{\textrm{real}} = \textrm{Re}(S_{\textrm{complex}}e^{-i\phi_{\textrm{smooth}}})$$$, then the phase-unwound signal $$$S_{\textrm{real}}$$$ was MPPCA-denoised again using a nonlocal moving patch of 125 voxels in 3D.
- Magnitude MPPCA1: MPPCA cutoff as in Cordero-Grande et al.3, nonlocal patch (125 voxels in 3D), eigenvalue shrinkage.
- Non-denoised magnitude dMRI data.
For validation, the effect of the noise floor at different denoising and resolution levels was compared in the fornix. Quantitative comparisons were performed for mean diffusivity (MD), mean kurtosis (MK) and fractional anisotropy (FA).
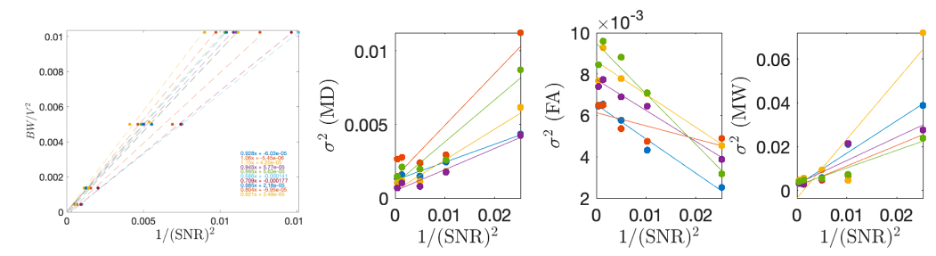
To quantify biological variability, we use the knowledge that parameter variance depends linearly on the additive noise variance $$$\sigma^2(r)$$$ (i.e., 1/SNR2): $$$\sigma_{\theta}^2(r)=\sigma_{\theta,0}^2+\alpha\sigma^2(r)$$$ for a parameter $$$\theta$$$. In this experiment $$$\sigma^2$$$ is a function of image resolution and echo-time. MPPCA reduces $$$\alpha$$$, by lowering the contribution of thermal noise. Therefore, the intercept $$$\sigma_{\theta,0}^2$$$ is determined only by the intrinsic biological variability within an ROI. We used this unique varying resolution dataset to measure the amount of biological variability within the posterior limb of internal capsule (PLIC).
Results
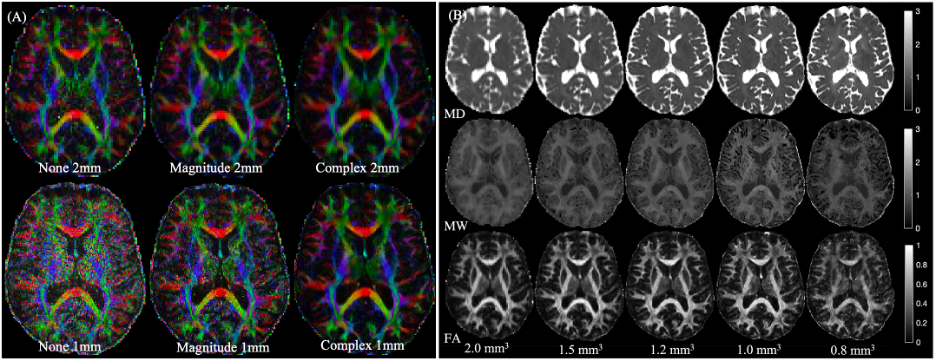
Figure 1 shows relative bias in FA-maps for no-denoising, magnitude denoising, and denoising complex-valued data at 1mm and 2mm isotropic resolution, along with parameter maps for FA, MD, and MK at all acquired resolutions after MP-complex denoising.Figure 2 shows fiber tracking of several important subcortical white matter tracts, demonstrating decreased partial volume effects on the fornix (Fig. 2A), improved visibility of the nigrostriatal pathway (Fig. 2B) along with visualization of pathways stemming from the red nucleus (including the dentarubrothalamic tract) after denoising high resolution images (Fig 2C).
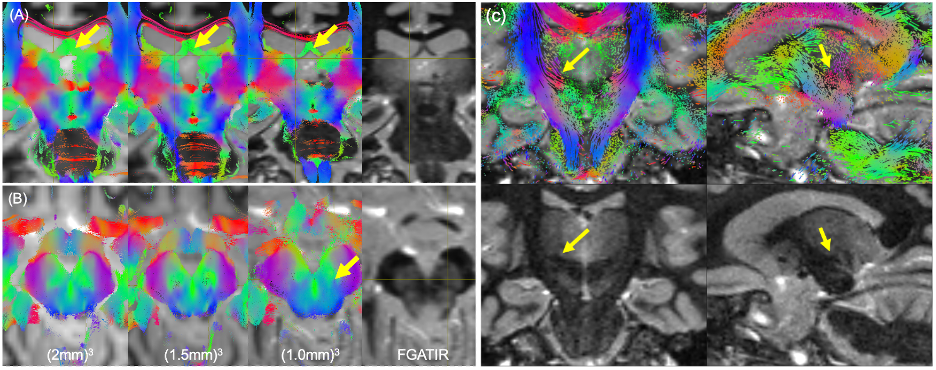
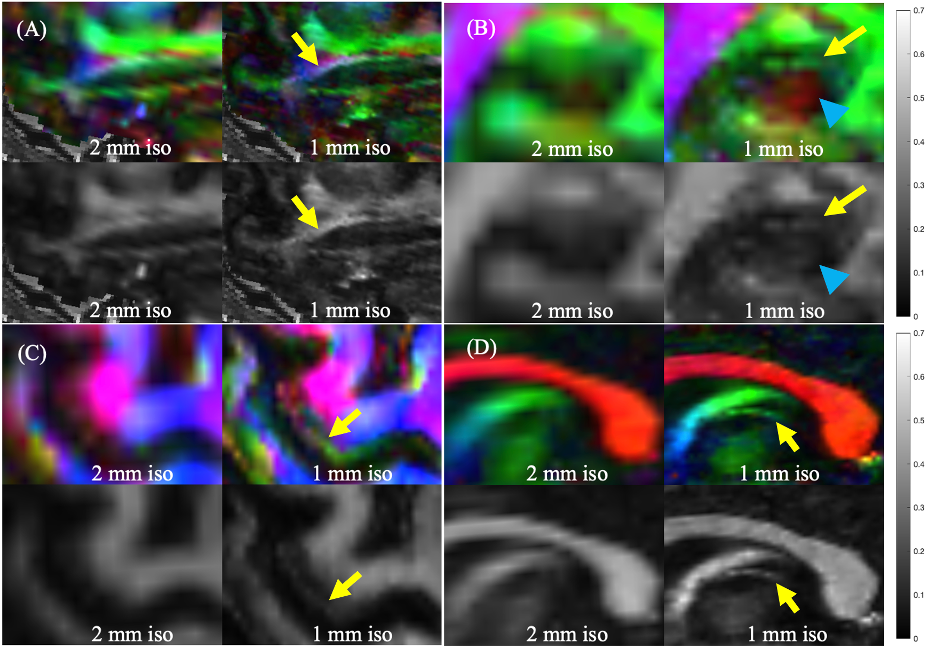
Figure 3 shows selected clinically-important small anisotropic structures not well visualized at 2-mm isotropic resolution that become directly visible at 1-mm isotropic resolution. Similar results were observed for other structures like the medial forebrain bundle.
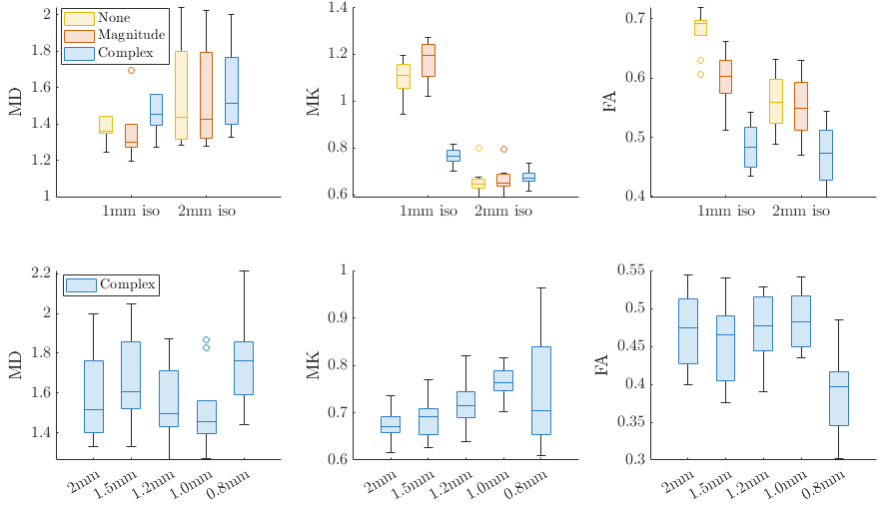
Figure 4 shows box plots comparing MD, MK, and FA over all subjects in the fornix at 1 and 2mm isotropic resolution: Partial volume effects are visible in MD at low resolution. In FA, complex denoising led to a bias of <2% compared to 13.5% for magnitude denoising and 15.5% for no-denoising, using 2mm data as the reference. Figure 4B Shows that bias and variance are stable at all resolution levels (except for 0.8mm iso. resolution).
Figure 5 shows how biological variability was probed as a function of image SNR. MK was found to have 4-7% intrinsic biological variability in PLIC.
Discussion
MP-Complex denoising at 1mm isotropic resolution generates parametric maps with minimal bias and variance (Fig. 4) and enables direct visualization of many clinically-important small anisotropic brain structures (Fig. 2-3). Conversely, we observed poor accuracy for 0.8mm iso. data, owing to such low SNR that the images could not be properly reconstructed from k-space.This study further demonstrated that complex denoising reduces parameter bias up to 14% in FA, along with decreasing parameter variance caused by noise or partial volume. We also hypothesize that we can estimate the amount of true biological variability in a region using varying SNR data – this may be helpful for recognizing subtle pathologic changes in future studies.
Conclusion
State-of-art clinical practices often use 2-mm isotropic resolution. We show that 1mm isotropic resolution along with denoising facilitates accurate parameter estimates and sensitivity to small deep-gray anatomy, potentially paving the way for high-resolution dMRI in the clinic.Acknowledgements
This work was supported by NIH R21 NS081230 and R01 NS088040 and was performed at the Center of Advanced Imaging Innovation and Research, an NIBIB Biomedical Technology Resource Center (NIH P41 EB017183).References
- Veraart, J. et al. Denoising of diffusion MRI using random matrix theory. Neuroimage 142, 394-406 (2016).
- Ades-Aron, B. et al. in In Proc ISMRM (Vol. 2105).
- Cordero-Grande, L., Christiaens, D., Hutter, J., Price, A. N. & Hajnal, J. V. Complex diffusion-weighted image estimation via matrix recovery under general noise models. Neuroimage 200, 391-404 (2019).
- Ades-Aron, B. et al. Evaluation of the accuracy and precision of the diffusion parameter EStImation with Gibbs and NoisE removal pipeline. Neuroimage 183, 532-543 (2018).
- Lee, H. H., Novikov, D. S. & Fieremans, E. Removal of partial Fourier‐induced Gibbs (RPG) ringing artifacts in MRI. Magnetic Resonance in Medicine 86, 2733-2750 (2021).
- Andersson, J. L., Skare, S. & Ashburner, J. How to correct susceptibility distortions in spin-echo echo-planar images: application to diffusion tensor imaging. Neuroimage 20, 870-888 (2003).
- Andersson, J. L. & Sotiropoulos, S. N. An integrated approach to correction for off-resonance effects and subject movement in diffusion MR imaging. Neuroimage 125, 1063-1078 (2016).
- Veraart, J., Sijbers, J., Sunaert, S., Leemans, A. & Jeurissen, B. Weighted linear least squares estimation of diffusion MRI parameters: strengths, limitations, and pitfalls. Neuroimage 81, 335-346 (2013).
- Shepherd, T., Ades-Aron, B., Bruno, M., Schambra, H. & Hoch, M. Direct in vivo MRI discrimination of brain stem nuclei and pathways. American Journal of Neuroradiology 41, 777-784 (2020).
Figures