1124
Detecting crossing fibers in animal and human brain using small angle X-ray scattering and comparison to diffusion MRI1Stanford University School of Medicine, Stanford, CA, United States, 2ETH Zurich, Zurich, Switzerland, 3Forschungszentrum Jülich, Jülich, Germany, 4Delft University of Technology, Delft, Netherlands, 5Paul Scherrer Institute, Villigen, Switzerland, 6SLAC National Accelerator Laboratory, Menlo Park, CA, United States
Synopsis
Keywords: White Matter, Tractography & Fibre Modelling
Mapping neuronal trajectories requires accurate determination of fiber crossings. Diffusion MRI detects fiber orientations but is affected by multiple brain structures and requires constant validation. Small-angle X-ray scattering (SAXS) can specifically image myelinated axons exploiting myelin’s periodic nanostructure. However, its capability to detect crossing fibers is still unexplored. We show that SAXS detects multiple crossing fibers using human corpus callosum strips, and in white and gray matter of mouse, vervet monkey, and human brain. We compare results to polarized light and tracer experiments and show that SAXS more sensitively detects fiber crossings compared to diffusion MRI on the same samples.Introduction
Generating detailed maps of neuronal orientations is necessary to determine accurate neuronal trajectories, and neuronal crossings pose a particular challenge. Diffusion MRI is extensively used to map these trajectories and crossings, but its signal is influenced by multiple brain structures, and hence requires validation. Due to its specificity in probing myelinated axons by exploiting myelin periodicity, Fig. 1, small-angle X-ray scattering (SAXS) has emerged as a potential reference method for quantifying fiber directions [1], also when combined with microscopy methods such as scattered light imaging [2]. However, SAXS’ capabilities in detecting crossing fibers have not been explored to date. Here, we scan artificial crossings created from human corpus callosum strips, as well as mouse, vervet monkey and human brain samples, and compare outputs in mouse and human brain with diffusion MRI-derived orientations.Methods
Samples: For the artificial crossings, a formalin-fixed corpus callosum was sectioned with a vibratome and cut into thin strips. The vervet monkey brain was obtained as in [3], namely fixed, embedded in glycerin and cut with a cryotome. The mouse brain, partly analyzed for primary orientations in [1], was paraformaldehyde (PFA)-perfused and -fixed, and cut using a vibratome. The human hippocampus of a donor with a low Alzheimer’s disease diagnosis was formalin-fixed and vibratome-cut. Other sample details are in Fig. 1.dMRI: The mouse brain was diffusion MRI-scanned ex vivo using a receive cryo-coil at a 9.4T Bruker scanner at 200 diffusion directions (20@b-value=1ms/μm², 40@2ms/μm², 60@3ms/μm², 80@4ms/μm²) and 20@b=0ms/μm2, with TE=42ms, TR=500ms, δ=5.5ms, Δ=12ms, isotropic voxel size 75μm.
The human hippocampus was scanned at a 7T Bruker scanner with TR=400ms, TE=40ms, δ=7ms, Δ=40ms, 100 q-space directions (10@b=1ms/μm2, 20@b=2ms/μm2, 30@b=5ms/μm2, 40@b=10ms/μm2) and 10@b=0ms/μm2.
For both datasets, after denoising and degibbsing [4], [5], fiber responses and orientation distributions were computed using the dwi2response and dwi2fod functions in mrtrix3, using multi-tissue, multi-shell algorithms, and visualized in mrview.
Polarized Light Imaging (3D-PLI): A second C57BL/6 mouse brain was PFA-fixed, embedded in glycerol and cryosectioned at 60μm. Polarimetric measurements were performed using the LMP-1 polarizing microscope (Taorad GmbH, Germany), pixel size=1.3μm. The modulation of pixel intensity with polarizing filter angle (10o steps) provided axon orientations according to [6].
X-ray scattering: Experiment principle and scan details for all samples are presented in Fig. 1. The myelin-specific signal was isolated using procedures in [7]. To quantify and visualize axon orientations by detecting the azimuthal peaks and identifying their position, Fig. 1, SLIX software [8] was used. SLIX was developed for scattered light imaging [9], where photons also scatter off the sample depending on nano/microstructure orientation and generate angle-dependent azimuthal profiles and associated peaks [10].
More detailed information on the methods can be found in [11].
Results
The artificial 3-fiber-crossings (Fig. 2A) show that SAXS accurately detects at least three crossing fiber tracts within a pixel. The fiber orientations have an average of 60o between them, with the respective peaks clearly distinguishable, Fig. 2B.SAXS’ capabilities in detecting crossing fibers are also clearly shown in the vervet monkey brain sample, Fig. 2C. In the zoomed-in parts of the corona radiata, fibers from the corpus callosum, the internal, external, and extreme capsules, and U-fibers, are seen crossing.
Mouse brain axon orientations and crossing fibers are shown in Fig. 3. SAXS detects intricate fiber crossings: fibers connecting the caudoputamen (CPu) and the cortex cross the corpus callosum (A-iii, also see Fig. 4B). These crossings can be inferred from the 3D-PLI image (Fig. 3B-i,ii) but are clearly visualized in Allen Mouse Brain Connectivity Atlas tracer experiments [12] (C-i,ii,iii). However, in the diffusion-MRI-derived fiber orientations (D-i,ii) these crossings are not visible.
Gray matter mouse brain crossings are depicted in Fig. 4, where SAXS sensitively detects both the radial fibers from the corpus callosum to the cortex, and the tangential fibers running almost parallel to the corpus callosum (A,C). Diffusion MRI can recover some of these fiber orientations (D).
In the human hippocampus, Fig. 5, SAXS detects the main fiber tracts (A-C), but also axon orientations from subtle secondary fiber tracts, such as the perforant pathway crossing parahippocampal gyral fibers (D). Diffusion MRI of the same region (E) does not recover these secondary orientations within the white matter voxels.
Discussion and Conclusion
We showed the capabilities of SAXS in detecting multiple crossings in the white and gray matter of mouse, vervet monkey and human brain samples. We also showed that in some instances, intricate crossings in mouse and human brain were not visible using diffusion MRI. Since diffusion MRI signal is not specific to myelinated axons, its determination of axon orientation needs validation [13]. Tracer injections, the gold standard, cannot be used for regular connectivity assessment. 3D-PLI provides exquisite micrometer-resolution orientation maps [14]–[16] but is limited in out-of-plane angle determination and within-pixel fiber crossings . Polarization-sensitive optical coherence tomography (PS-OCT) [17], [18] has similar limitations. Scattered light imaging [9], [10] seems very promising being able to resolve within-pixel crossings but still needs validation, especially for its out-of-plane angle [2]. SAXS, being specific to myelinated axons, able to quantify out-of-plane angles [1], and with a tomographic capability [7], could provide a gold-standard method for assessing fiber orientations, including fiber crossings, towards accurate structural connectivity maps.Acknowledgements
We thank all animal and human donors. The present work was supported by the National Institutes of Health (NIH), award numbers R01NS088040, P41EB017183, R01AG061120-01, R01MH092311, and 5P40OD010965, and by the European Union’s Horizon 2020 Research and Innovation Programme under Grant Agreement No. 945539 (“Human Brain Project” SGA3). SSRL, SLAC National Accelerator Laboratory, is supported by the U.S. Department of Energy, under Contract No. DE-AC02-76SF00515. The SSRL Structural Molecular Biology Program is supported by the DOE Office of Biological and Environmental Research, and by the National Institutes of Health, National Institute of General Medical Sciences (P30GM133894).References
[1] M. Georgiadis et al., “Retrieving neuronal orientations using 3D scanning SAXS and comparison with diffusion MRI,” Neuroimage, vol. 204, p. 116214, 2020.
[2] M. Menzel, D. Gräßel, I. Rajkovic, M. Zeineh, and M. Georgiadis, “Using light and X-ray scattering to untangle complex neuronal orientations and validate diffusion MRI,” bioRxiv, p. 2022.10.04.509781, Jan. 2022.
[3] M. Menzel et al., “Toward a High-Resolution Reconstruction of 3D Nerve Fiber Architectures and Crossings in the Brain Using Light Scattering Measurements and Finite-Difference Time-Domain Simulations,” Phys. Rev. X, vol. 10, no. 2, p. 21002, Apr. 2020.
[4] B. Ades-Aron et al., “Evaluation of the accuracy and precision of the diffusion parameter EStImation with Gibbs and NoisE removal pipeline,” Neuroimage, vol. 183, pp. 532–543, 2018.
[5] J. Veraart, D. S. Novikov, D. Christiaens, B. Ades-aron, J. Sijbers, and E. Fieremans, “Denoising of diffusion MRI using random matrix theory,” Neuroimage, vol. 142, no. Supplement C, pp. 394–406, 2016.
[6] M. Axer et al., “Estimating Fiber Orientation Distribution Functions in 3D-Polarized Light Imaging ,” Frontiers in Neuroanatomy , vol. 10. 2016.
[7] M. Georgiadis et al., “Nanostructure-specific X-ray tomography reveals myelin levels, integrity and axon orientations in mouse and human nervous tissue,” Nat. Commun., vol. 12, no. 2941, 2021.
[8] J. A. Reuter and M. Menzel, “SLIX: A Python package for fully automated evaluation of Scattered Light Imaging measurements on brain tissue,” J. Open Source Softw., vol. 5, no. 54, p. 2675, 2020.
[9] M. Menzel et al., “Scattered Light Imaging: Resolving the substructure of nerve fiber crossings in whole brain sections with micrometer resolution,” Neuroimage, vol. 233, p. 117952, 2021.
[10] M. Menzel, M. Ritzkowski, J. A. Reuter, D. Gräßel, K. Amunts, and M. Axer, “Scatterometry Measurements With Scattered Light Imaging Enable New Insights Into the Nerve Fiber Architecture of the Brain ,” Frontiers in Neuroanatomy , vol. 15. 2021.
[11] M. Georgiadis et al., “Imaging crossing fibers in mouse, pig, monkey, and human brain using small-angle X-ray scattering,” bioRxiv, p. 2022.09.30.510198, Jan. 2022.
[12] S. W. Oh et al., “A mesoscale connectome of the mouse brain,” Nature, vol. 508, p. 207, 2014.
[13] A. Yendiki, M. Aggarwal, M. Axer, A. F. D. Howard, A.-M. van C. van Walsum, and S. N. Haber, “Post mortem mapping of connectional anatomy for the validation of diffusion MRI,” Neuroimage, vol. 256, p. 119146, 2022.
[14] M. M. Zeineh et al., “Direct Visualization and Mapping of the Spatial Course of Fiber Tracts at Microscopic Resolution in the Human Hippocampus,” Cereb Cortex, vol. 27, no. 3, pp. 1779–1794, 2017.
[15] M. Axer et al., “A novel approach to the human connectome: Ultra-high resolution mapping of fiber tracts in the brain,” Neuroimage, vol. 54, no. 2, pp. 1091–1101, 2011.
[16] M. Stacho et al., “A cortex-like canonical circuit in the avian forebrain,” Science (80-. )., vol. 369, no. 6511, p. eabc5534, Sep. 2020.
[17] H. Wang et al., “Cross-validation of serial optical coherence scanning and diffusion tensor imaging: A study on neural fiber maps in human medulla oblongata,” Neuroimage, vol. 100, pp. 395–404, 2014.
[18] R. Jones et al., “Insight into the fundamental trade-offs of diffusion MRI from polarization-sensitive optical coherence tomography in ex vivo human brain,” Neuroimage, vol. 214, p. 116704, 2020.
Figures
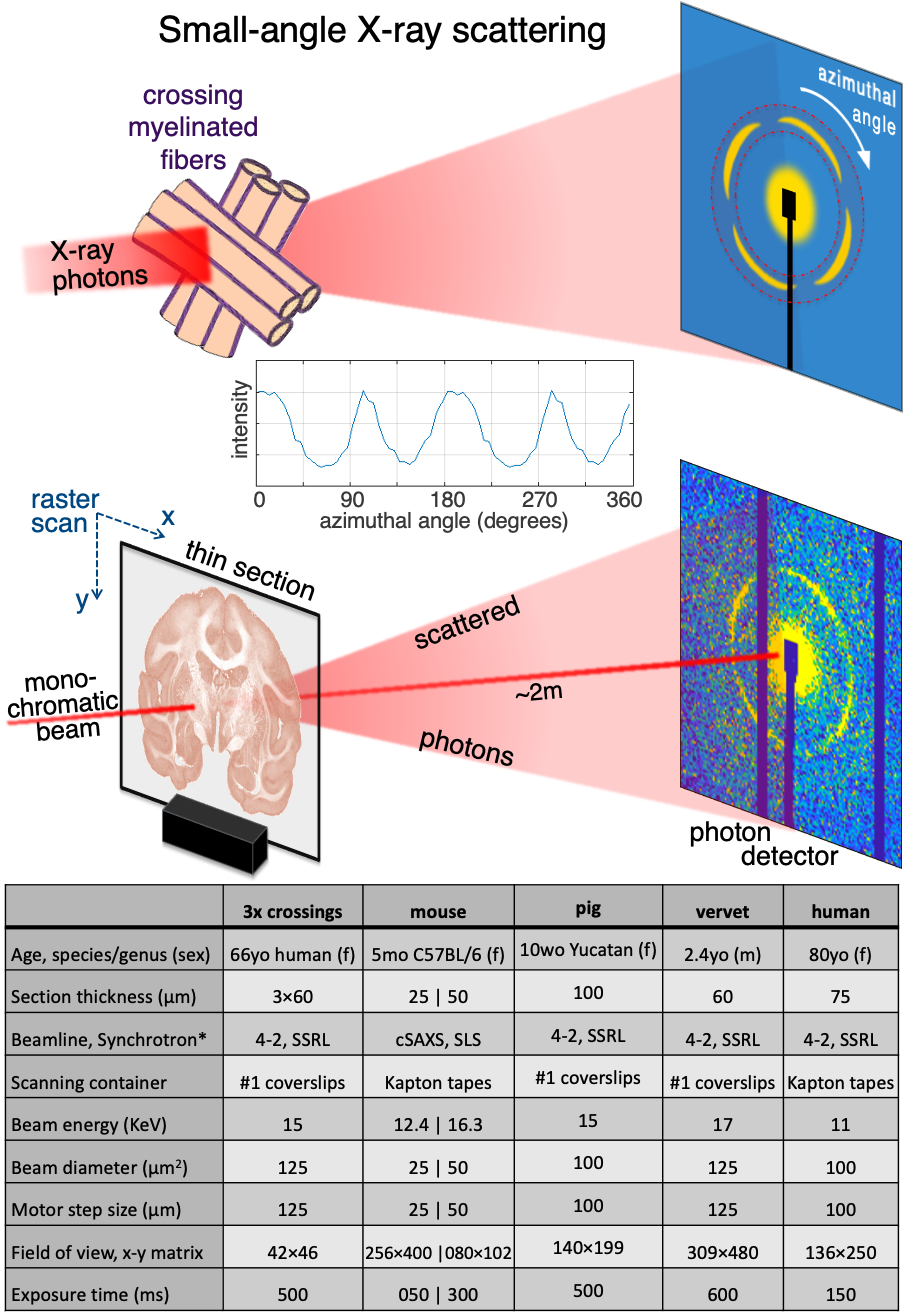
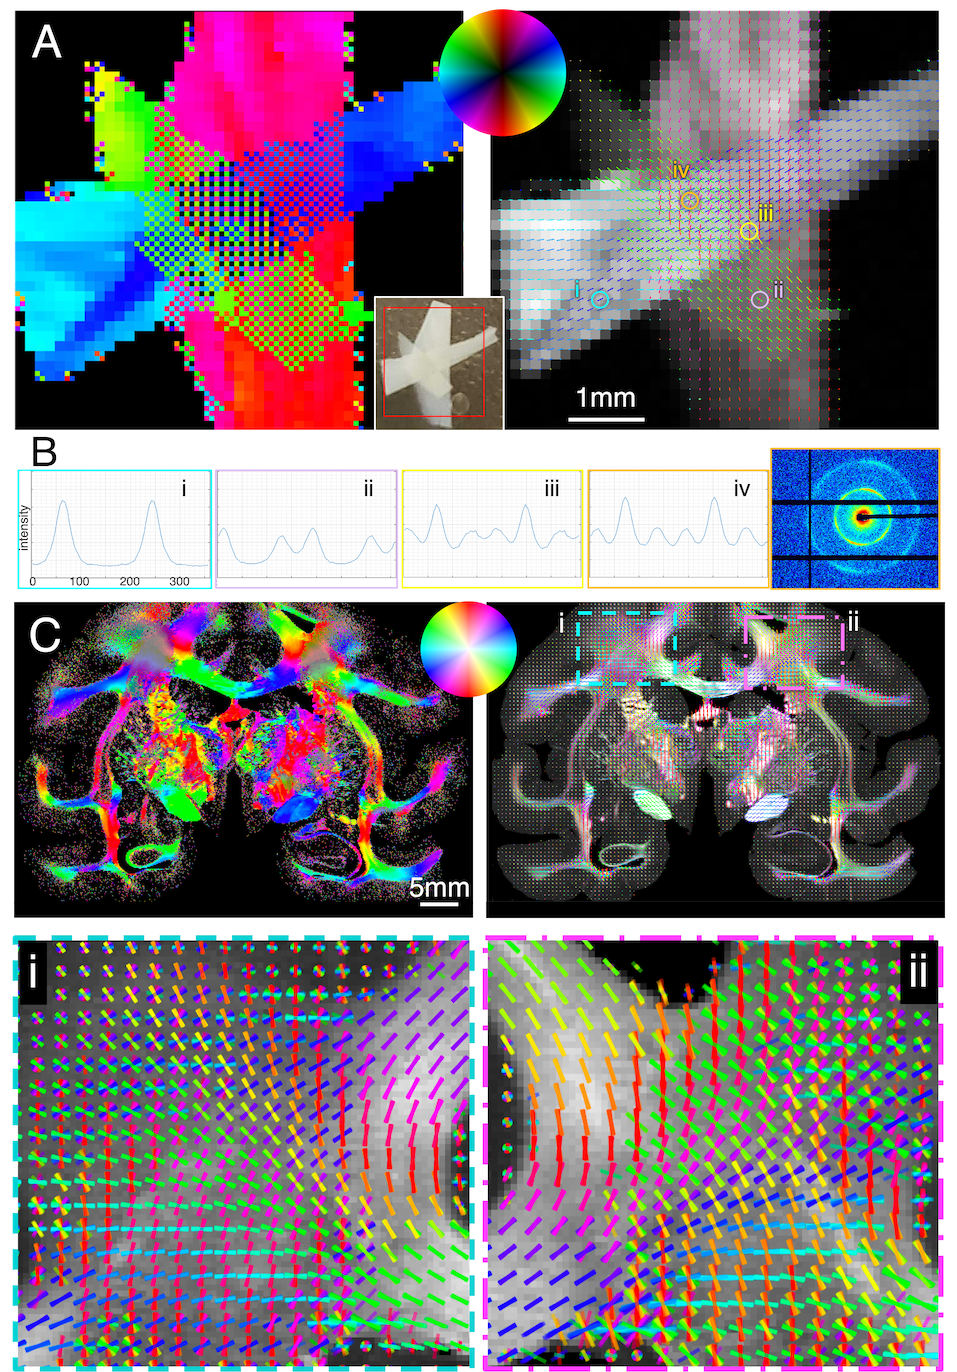
Figure 2. Detecting crossing fibers in artificial crossings and vervet brain. A) Axon orientation maps of 3 overlayed crossing fibers (cf inset). B) Azimuthal intensity profiles for 4 representative points in (A), showing single (i: 2 peaks), double (ii: 4 peaks) and triple (iii,iv: 6 peaks) axon orientations, and scattering pattern of point iv. C) Top: Axon orientation maps of vervet brain section, orientation encoded by colorwheel. Bottom: Zoom-in of left and right corona radiata, with multiple corpus callosum, U-fiber, internal, external, and extreme capsule fiber crossings.
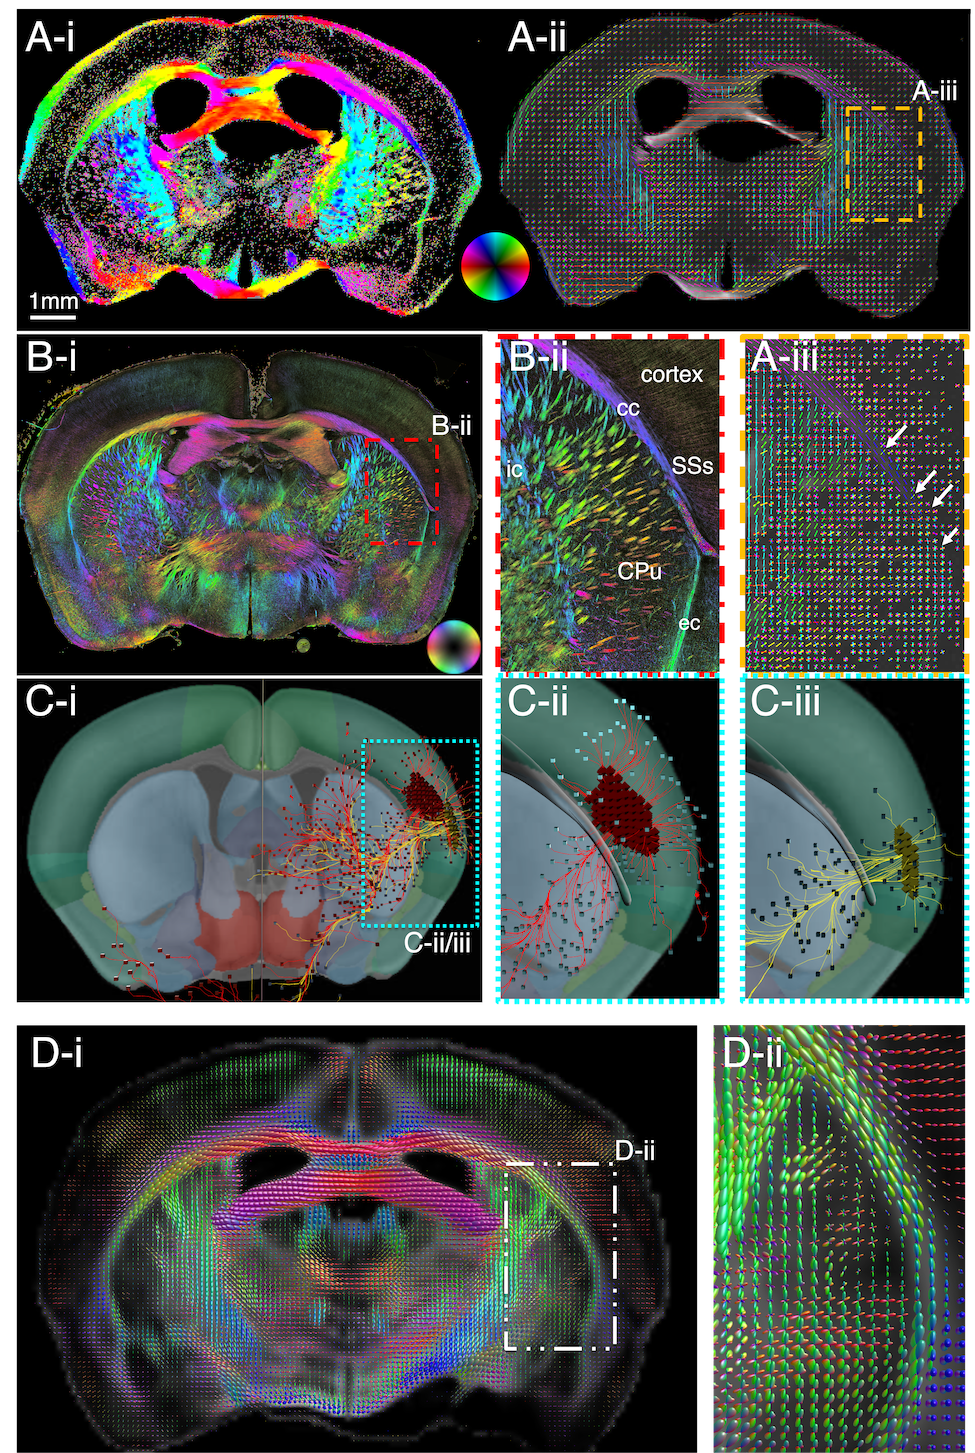
Figure 3. 4-modality orientation maps of mouse brain. A) Axon orientations using SAXS. In (iii), zoom-in at the fibers connecting the caudoputamen and the cortex crossing the corpus callosum. B) 3D-PLI orientation map of a different mouse at similar coronal section. In (ii), zoom-in at similar region as A-iii. C) Axon orientations connecting the caudoputamen and cortex through corpus callosum derived from Allen Institute tracer experiments 297945448-SSs and 266175461-SSs. D) Diffusion MRI orientations from same mouse as (A), without distinguishable corpus callosum crossings.
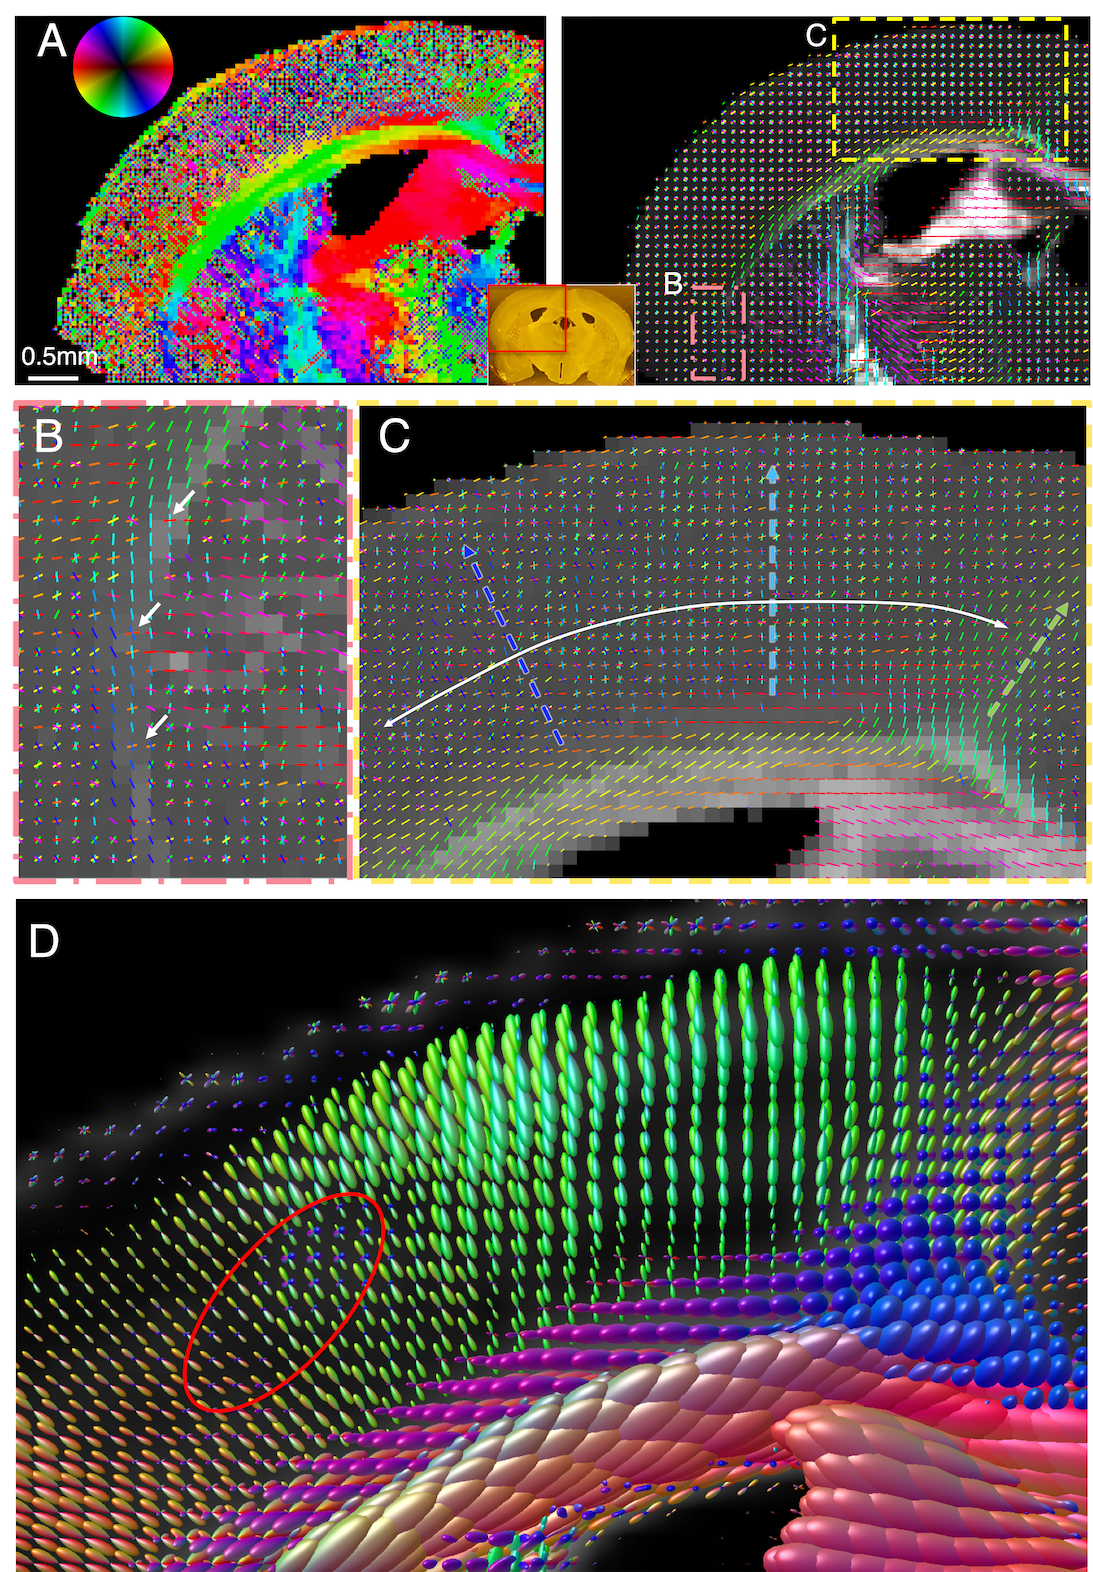
Figure 4. Axon orientations from a mouse brain section neighboring that of Fig. 3. A) SAXS-derived axon orientation map of mouse brain section (cf inset), orientations encoded by colorwheel. B-C) Zoom-ins from (A). B) The corpus callosum crossings highlighted in Fig. 3 are visualized here too (white arrows). C) Cortical crossings of radial fibers (colored arrows) and tangential fibers (white arrow). D) Diffusion MRI zoomed-in fiber orientation map of the same region as (C), showing mainly the radial fibers (green). Some tangential fibers are also seen (enclosed in red ellipse).
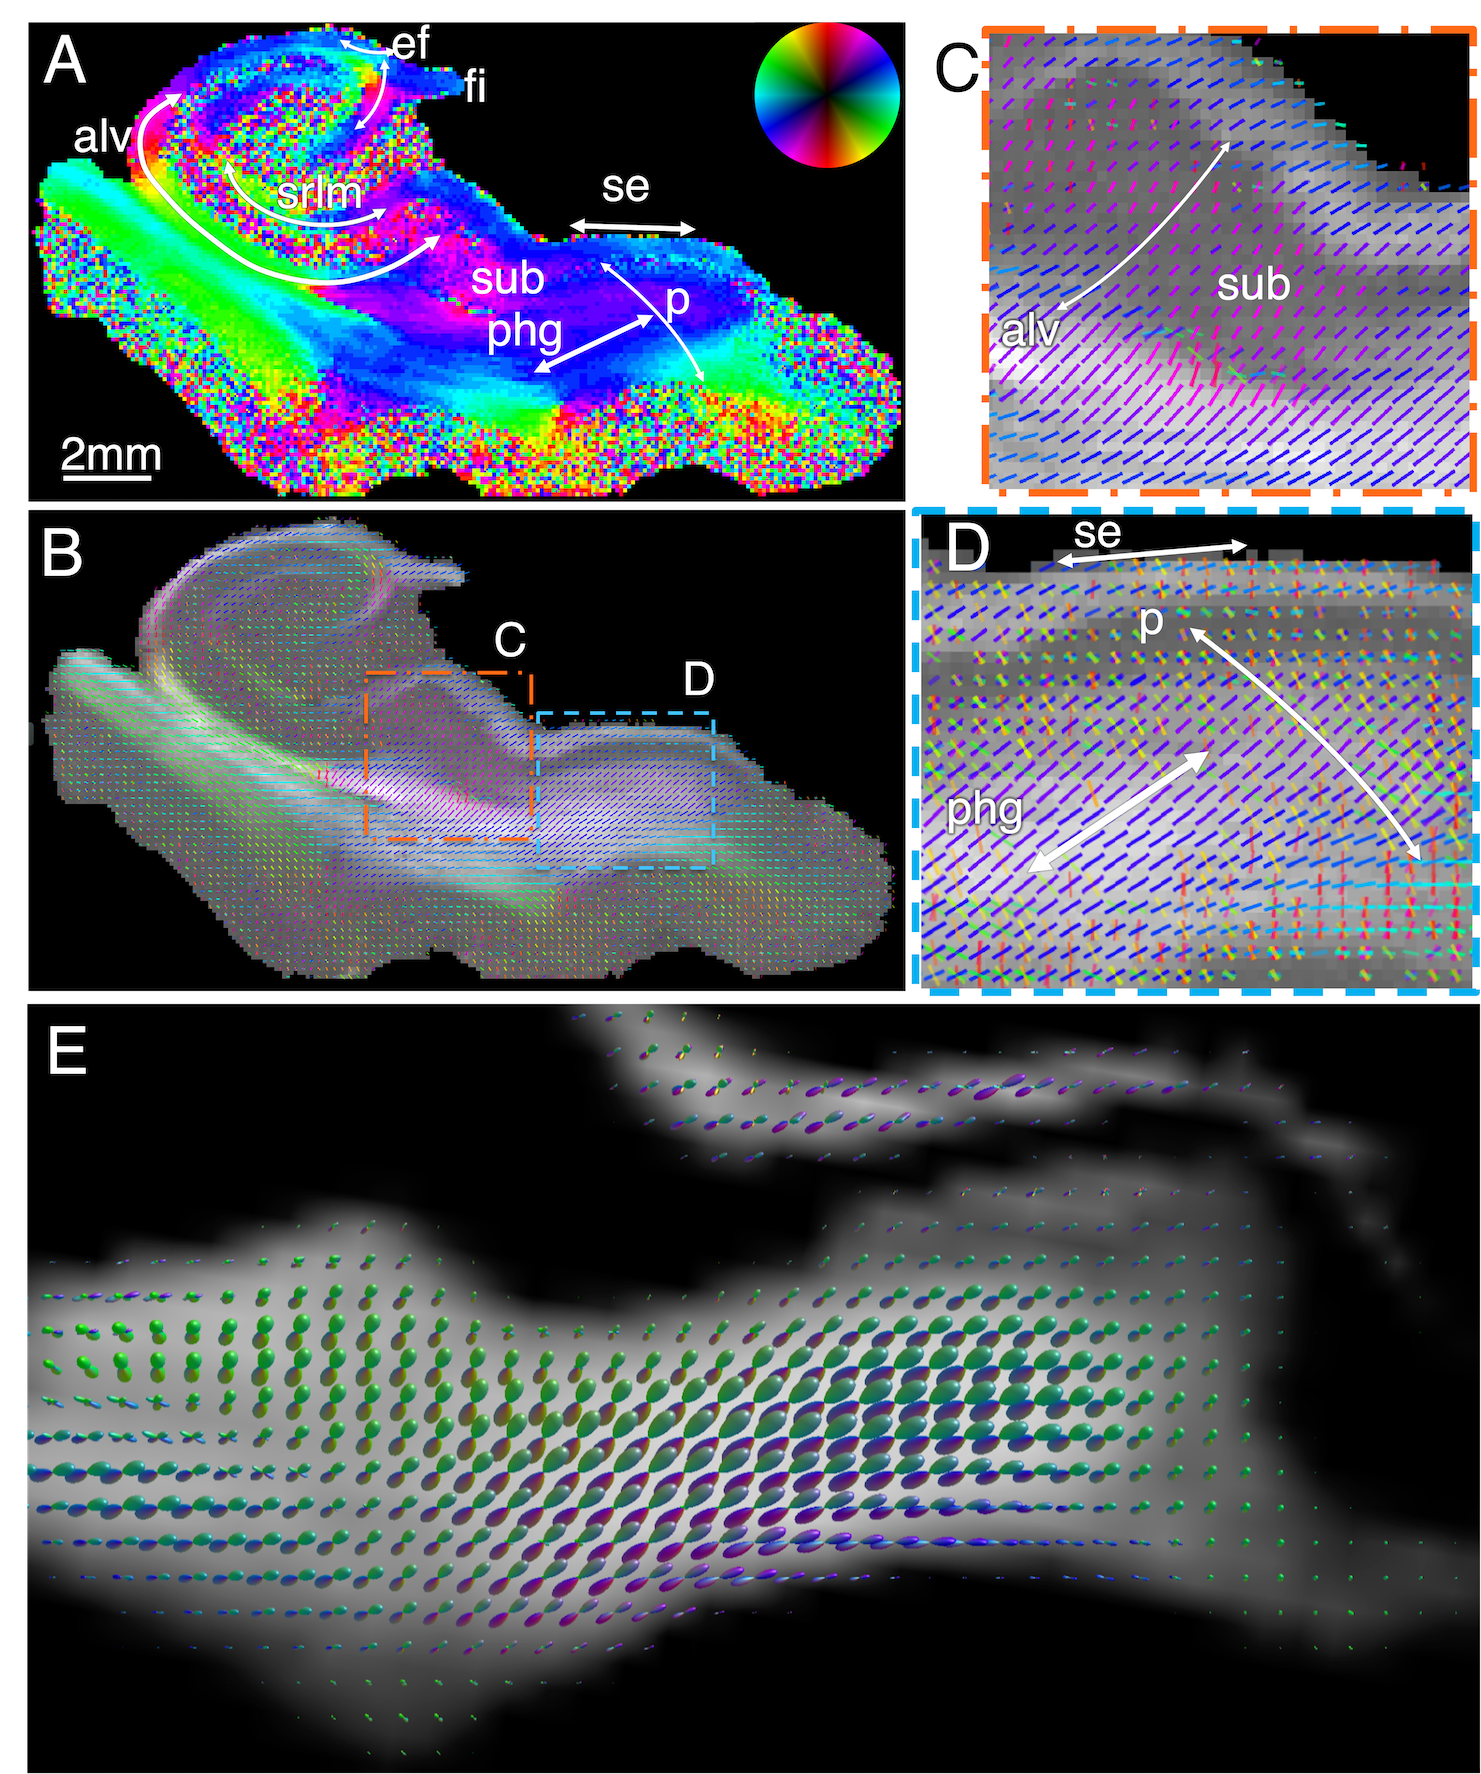
Figure 5. Axon orientation maps of human hippocampus. A-B) SAXS-derived axon orientation map including the main hippocampal tracts: p: perforant pathway, phg: parahipocampal gyral white matter, se: superficial entorhinal pathway, sub: subiculum, fo: forniceal path, srlm: stratum radiatum lacunosum and moleculare, ef: endfolial pathway, fi: fimbria. C-D) Zoom-ins from (B). C) Fibers running through subiculum towards the alveus. D) Perforant pathway fibers crossing the phg and subiculum. E) Diffusion MRI orientations of region similar to (D), without visible crossing fibers.