1121
3D Cluster Analysis for Cartilage T2 And T1ρ Mapping to Assess Focal Lesions in ACL-Injured Subjects1Bioengineering, Stanford University, Palo Alto, CA, United States, 2Radiology, Stanford University, Palo Alto, CA, United States, 3Mechanical Engineering, University of Victoria, Victoria, BC, Canada, 4Electrical Engineering, Stanford University, Palo Alto, CA, United States, 5Orthopaedic Surgery, Stanford University, Palo Alto, CA, United States, 6Radiology/Integrative Biomedical Imaging Informatics, Stanford University, Palo Alto, CA, United States
Synopsis
Keywords: Cartilage, Osteoarthritis, ACL-injury, cartilage, knee
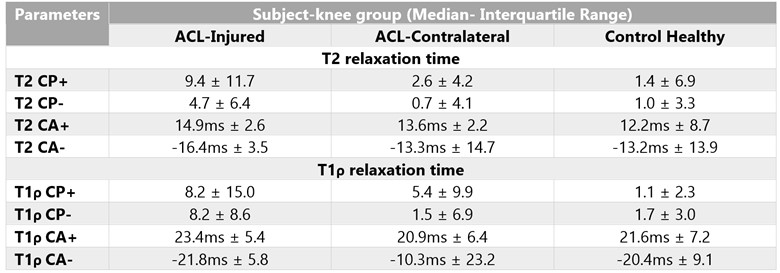
A 3D pipeline (longitudinal registration followed by cluster analysis) was developed to identify focal-lesions (clusters) of elevated T2 and T1ρ in femoral cartilage over 4-visits (3-weeks, 3, 9, and 18-months) post ACL-reconstruction surgery. Cluster Average (CA) and Cluster Percentage (CP) for T2 were significantly higher for ACL-inured when compared to ACL-contralateral and control-healthy knees. While the CP followed an increasing trend during subsequent visits, CA did not significantly vary across visits. Thus, our method could be effective for identifying and tracking quality (measured by CA) and quantity (measured by CP) of focal lesions in ACL-injured population.Introduction
Quantitative T1ρ and T2 relaxometry assessing biochemical composition of the cartilage has commonly been used to investigate OA1,2. Furthermore, variations in T1ρ and T2 values as early as six-months post anterior cruciate ligament (ACL) injury3 or reconstruction4 show promise for their use as effective metrics for detecting early changes in the cartilage. Studies thus far have reported mean differences or overall heterogeneity of these measures, which does not shed light on focal cartilage defects– a hallmark of OA manifestation. A cluster analysis approach based on T1ρ or T2 2D projection-maps allows quantification of cartilage lesion coverage5. While the generation of 2D projection-maps from 3D volume introduces averaging across angular bins, slices, and cartilage thickness, cluster analysis requires registration of these 2D projection maps between two timepoints which involves interpolation and causes blurring. The aim of this work was therefore to develop a method for 3D registration and cluster analysis across timepoints. We further evaluate this approach to identify variations in T1ρ and T2 data in ACL-injured and healthy subjects.Methods
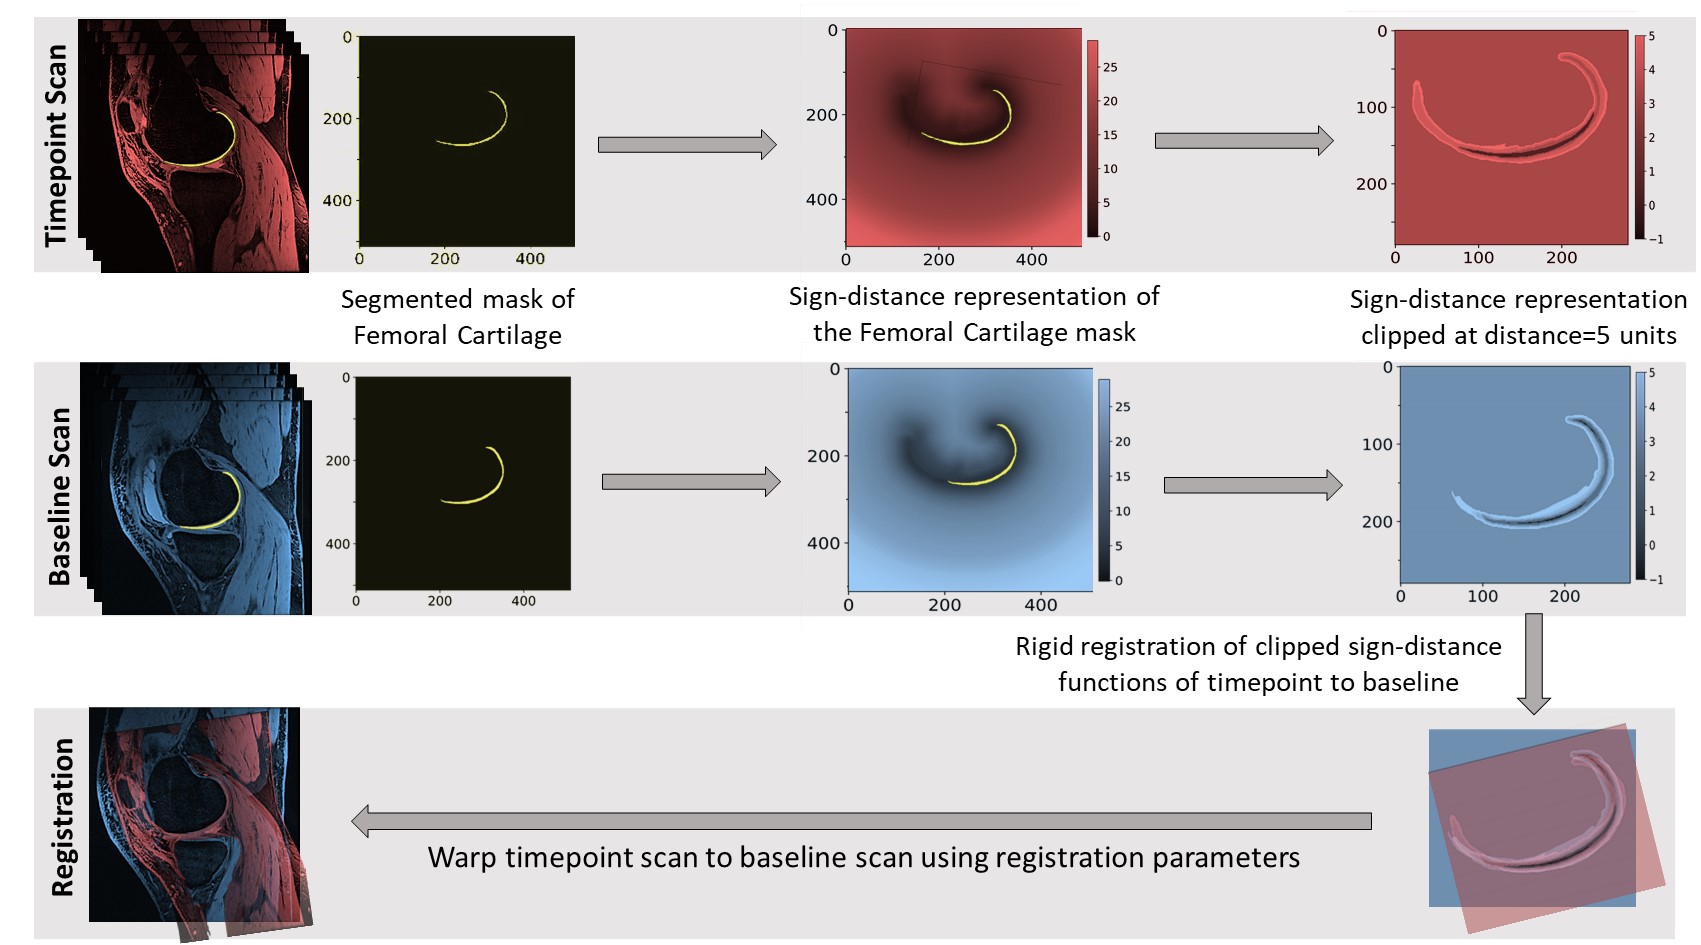
3T MRI scan data6 of injured and contralateral knees of 10 ACL-injured patients and healthy knees of 10 controls at 3-weeks (baseline), 3, 9, and 18-months following ACL-reconstruction surgery was used. 3D masks of the femoral cartilage were obtained from manual segmentation. To allow appropriate comparisons of the femoral cartilage region over time, a two-step registration pipeline was implemented (Figure 1). First, sign-distance representations of the 3D femoral cartilage mask of subsequent visits were rigidly registered to the baseline visit. Second, the registration parameters thus obtained were applied to warp scans from the subsequent visits to the baseline scan. T1ρ and T2 relaxation maps for the femoral cartilage region were computed on these registered scan volumes using DOSMA7. Cluster analysis was performed on these 3D maps to detect the size and intensity of focal changes overtime. To this end, difference maps were generated by subtracting the baseline-map from each timepoint-map. Thresholding for intensity followed by volume was applied to these difference maps to identify zones of focal lesions and to remove noise5. The intensity threshold value was set as the Mean of the Standard-Deviations of all the voxels from the difference maps representing the least change (visit at 3-months minus baseline) for the control group. A volume threshold of 150 voxels (22 mm3) was chosen from the findings of preliminary parametric analysis. A “cluster” is defined as any region that is larger than the volume threshold and has a magnitude higher (positive) or lower (negative) than the intensity threshold. Two metrics, cluster percentage (CP, percent volume of the cartilage voxels assigned to clusters) and cluster average (CA, Mean value of all the cluster voxels identified) were computed for positive (+) and negative (-) clusters of both T1ρ and T2 maps. CP+, CP-, CA+, and CA- were the outcome measures in the study. For each outcome measure, ACL-injured knees were compared with ACL-contralateral and control-healthy knees using paired and unpaired Wilcoxon tests, respectively, adjusted for clustering within knee and pooled over visits (α<0.05). Statistical analysis was performed using package ‘clusrank’ (version 1.0-3)8 in R (version 4.1.3)9.Results
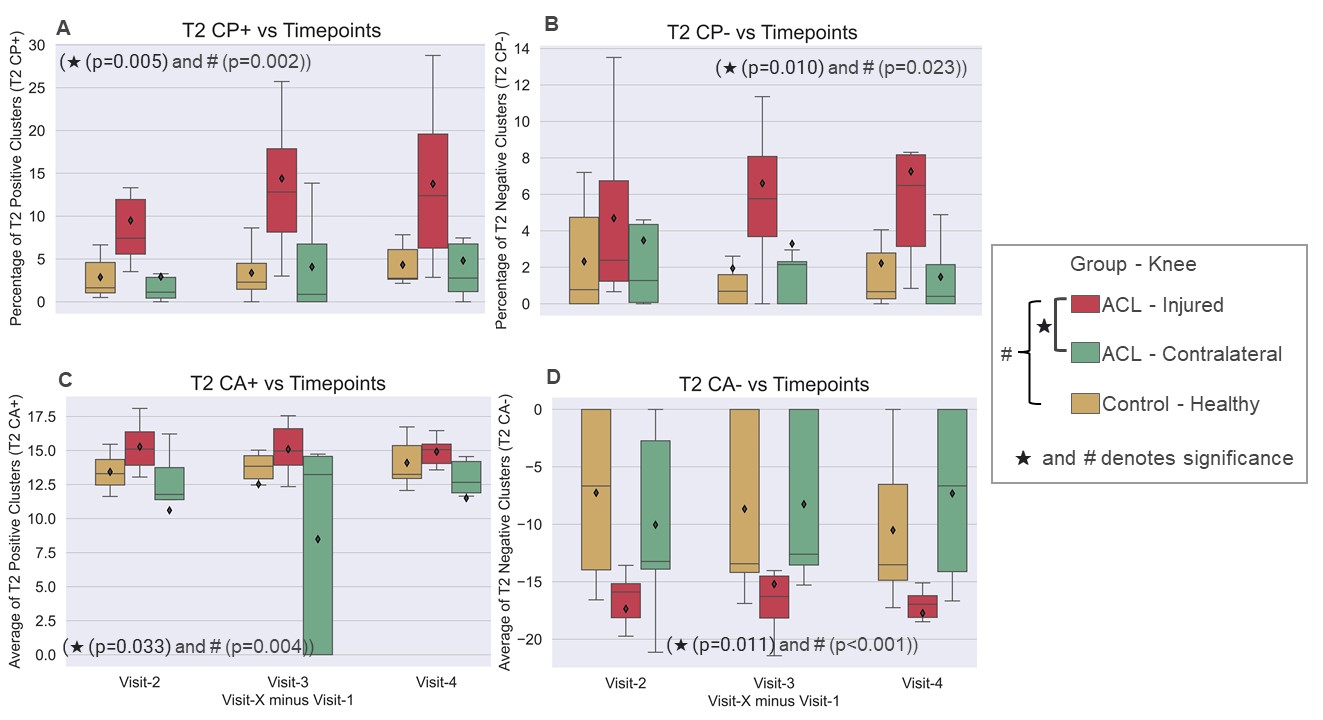
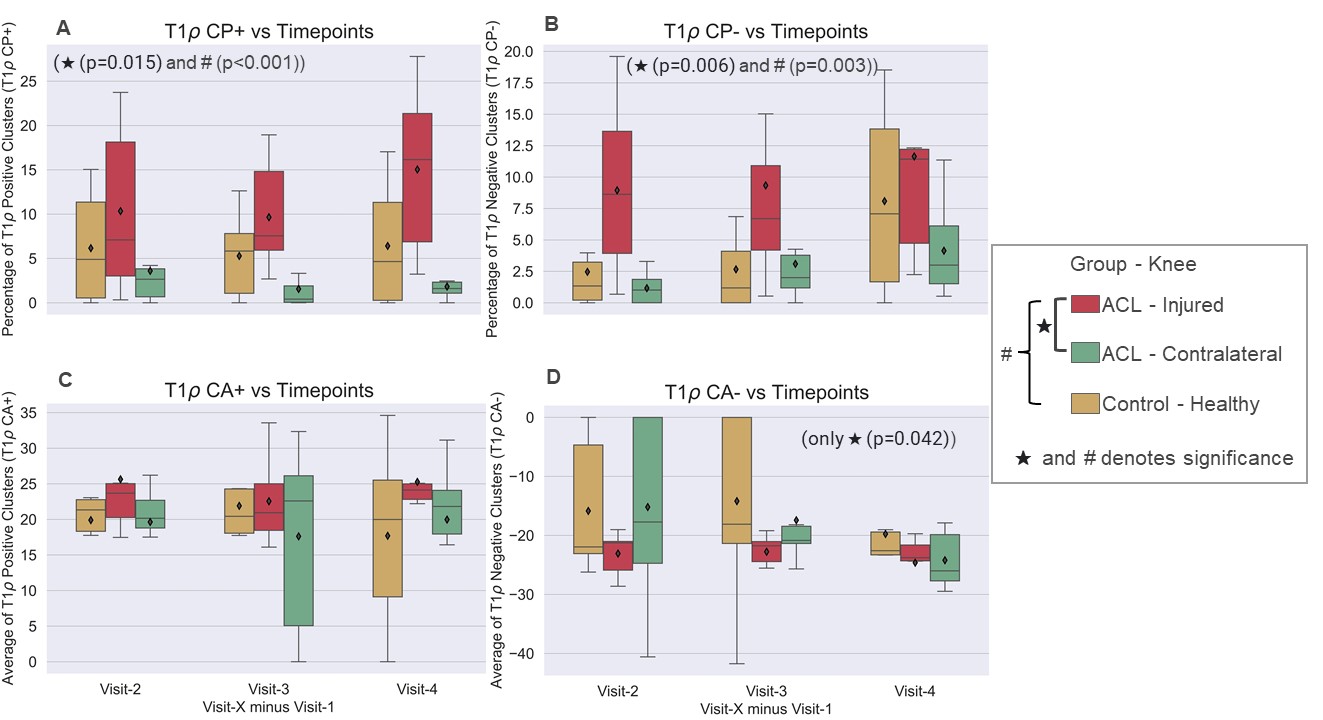
All four outcome measures of T2 were higher in the ACL-inured group and significantly different from ACL-contralateral and control-healthy groups (p<0.01, Figures 2, 3). For T1ρ, only CP+ and CP- showed significant differences across all visits, with the ACL-injured group having higher values than the other two (p<0.015, Figures 2, 4). While the CP followed an increasing trend from 3-to-18-months follow-up for all groups, CA values did not significantly vary across groups or visits (p=0.259). Also, a higher variation in the CA for T1ρ and t2 was found for ACL-contralateral and control-healthy groups (11.65ms and 9.74ms, respectively) for each visit than the ACL-injured group (4.31ms).Discussion
The 3D registration pipeline developed in this study allowed for comparison of T1ρ and T2 measures in the femoral cartilage between timepoints while accounting for variation in the knee flexion angle and region imaged between scans. Furthermore, cluster analysis in 3D preserved spatial localization of the focal defects without averaging them across slices and thickness and showed changes in T1ρ and T2 times as early as 3-months after surgery, despite limited sample size. Furthermore, no changes were found in the outcome parameters for some subjects in the ACL-contralateral and control-healthy groups, which accounts for larger variations in the data for these groups. Although there were differences in CA values while comparing injured vs contralateral and injured vs healthy groups for T2, CA values themselves did not significantly vary within each group across visits. This could potentially mean that the size of the focal defects increases at a faster rate over time than its intensity. While CP seemed to be a better parameter in detecting focal changes than CA for both T1ρ and T2, T2 was more sensitive than T1ρ in tracking early changes in terms of both CP and CA of focal defects.In conclusion, the methods developed in this study could aid in effectively identifying and tracking of both, quality and quantity of focal lesions represented by elevated T1ρ and T2 values in the ACL-injured population.
Acknowledgements
NIH R01 AR077604, GE Healthcare.References
1. Wong, C. S. et al. Imaging biomarker with T1ρ and T2 mappings in osteoarthritis - in vivo human articular cartilage study. Eur J Radiol 82, 647–650 (2013).
2. Li, X. et al. In vivo T(1rho) and T(2) mapping of articular cartilage in osteoarthritis of the knee using 3 T MRI. Osteoarthritis Cartilage 15, 789–797 (2007).
3. Bolbos, R. I., Ma, C. B., Link, T. M., Majumdar, S. & Li, X. In vivo T1rho quantitative assessment of knee cartilage after anterior cruciate ligament injury using 3 Tesla magnetic resonance imaging. Invest Radiol 43, 782–788 (2008).
4. Su, F. et al. Cartilage morphology and T1ρ and T2 quantification in ACL-reconstructed knees: a 2-year follow-up. Osteoarthritis and Cartilage 21, 1058–1067 (2013).
5. Monu, U. D. et al. Cluster Analysis of Quantitative MRI T2 and T1ρ Relaxation Times of Cartilage Identifies Differences between Healthy and ACL-injured Individuals at 3T. Osteoarthritis Cartilage 25, 513–520 (2017).
6. Black, M., Young, K. & Chaudhari, A. Detecting early changes in ACL-reconstructed knees: cluster analysis of T2 relaxation times from 3 months to 18 months post-surgery. in vol. 2738 (2020).
7. Desai, A. D., Barbieri, M. & Mazzoli, V. DOSMA: A deep-learning, open-source framework for musculoskeletal MRI analysis. in Proc 27th Annual Meeting ISMRM, Montreal 1135 (2019).
8. Jiang, Y., Lee, M.-L. T., He, X., Rosner, B. & Yan, J. Wilcoxon Rank-Based Tests for Clustered Data with R Package clusrank. Journal of Statistical Software 96, 1–26 (2020).
9. R Core Team. R: A language and environment for statistical computing. R Foundation for Statistical Computing, Vienna, Austria. https://www.r-project.org/.
Figures