1120
MR Fingerprinting in the Knee Cartilage Compared to Conventional Methods in Combination with Automated Cartilage Segmentation
Diana Bencikova1, Martin A. Cloos2, Veronika Janacova1, Siegfried Trattnig1,3,4,5, and Vladimir Juras1
1Department of Biomedical Imaging and Image-Guided Therapy, Medical University Vienna, Vienna, Austria, 2University of Queensland, Queensland, Austria, 3CD Laboratory for MR Imaging Biomarkers (BIOMAK), Vienna, Austria, 4Austrian Cluster for Tissue Regeneration, Ludwig Boltzmann Institute for Experimental and Clinical Traumatology, Vienna, Austria, 5Karl Landsteiner Society, Institute for Clinical Molecular MRI in the Musculoskeletal System, Vienna, Austria
1Department of Biomedical Imaging and Image-Guided Therapy, Medical University Vienna, Vienna, Austria, 2University of Queensland, Queensland, Austria, 3CD Laboratory for MR Imaging Biomarkers (BIOMAK), Vienna, Austria, 4Austrian Cluster for Tissue Regeneration, Ludwig Boltzmann Institute for Experimental and Clinical Traumatology, Vienna, Austria, 5Karl Landsteiner Society, Institute for Clinical Molecular MRI in the Musculoskeletal System, Vienna, Austria
Synopsis
Keywords: Cartilage, MR Fingerprinting, MSK, MR value, Osteoarthritis, Quantitative Imaging, Relaxometry
Quantitative MRI has been shown to be sensitive to early stages of cartilage degeneration in osteoarthritis, but conventional MRI techniques can measure only single parameter at a time. This poses time constraints and co-registration challenges. With MR Fingerprinting, multiple parameters can be assessed within single measurement. Here, we evaluated prototype MRF sequence in NIST phantom and healthy volunteers in combination with automatic cartilage segmentation procedure and compared to conventional techniques. We could show that the values provided by MRF sequence agreed with the values provided by conventional techniques. Therefore MRF is accurate and practical diagnosis tool for articular cartilage examination.Introduction
Quantitative MRI may be able to detect early stages of cartilage degeneration in osteoarthritis (OA) [1]. Conventional quantitative MRI techniques can measure only a single parameter at a time. This makes it challenging to collect multiple parameters within a reasonable measurement time and necessitates extensive post-processing to co-register the individual data sets. It is possible to overcome these problems with MR fingerprinting (MRF), which can obtain multiple parameters within one single scan and recently has been demonstrated in cartilage application [2]. The goal of this study was to evaluate the accuracy and feasibility of a prototype MRF sequence to acquire T1 and T2 values in phantoms and in cartilage in combination with automatic cartilage segmentation procedure.Methods
All measurements were performed on a 3T MR scanner (Prismafit, Siemens, Erlangen, Germany). The prototype MR Fingerprinting sequence based on [3] was compared to conventional multi-echo spin-echo sequence (CPMG, measurement parameters: TR = 1420 ms, turbo factor = 8, Te range = 13.8 – 110.4 ms. FOV = 200×200 mm2, matrix = 384×384, FA = 180˚, ST = 5.5 mm, total acq time 4:48 min) to evaluate T2 values, and to volumetric interpolated breath-hold examination sequence (VIBE, measurement parameters: TR = 15 ms, Te = 2.47 ms, FOV = 200×200 mm2, matrix = 768×768, FA = 5˚, ST = 5 mm, total acq time 1:04 min) to evaluate the T1 values. Double-echo steady-state sequence (DESS, measurement parameters: TR = 14.1 ms, Te = 5 ms, FOV = 160x160mm2, matrix = 241x256, FA = 25 ˚, ST = 0.6 mm, total acq time = 5.58 min) was measured to obtain automatic segmentation of the cartilage layers via the MR ChondralHealth prototype (Siemens, Erlangen, Germany).First, the NIST phantom, containing an array of spheres with different T1 and T2 values, was scanned to analyze the accuracy of the MRF sequence. Circular ROIs from the individual elements of T1 and T2 arrays were delineated on the slice with the biggest cross-section of the spheres. The T2 and T1 values were then extracted from the conventional and MRF T2 and T1 maps and compared via regression analysis.
Subsequently, ten volunteers (mean age 33.2 ± 12.8 years old, 4 men and 6 women) were scanned to obtain in vivo data of knee articular cartilage. A radiologist with 30 years of experience in knee cartilage MRI reviewed the morphological knee MR exams of these volunteers to rule out any pathologies. Automatic segmentation, dividing the cartilage into 21 segments (6 patellar, 6 tibial and 9 femoral), was performed and MRF, CPMG and VIBE-T1 images were resamples and co-registered with the DESS images and segmentation. Extreme values, presumed to be noise biased, were masked out of the segmentation and values from each segment were extracted. The coefficients of determination between the MRF and conventional methods were assessed.
Results
The results of the NIST phantom are depicted in Figure 1 (T2 array) and Figure 2 (T1 array). The T2 values of the MRF sequence are capped at approx. 330ms, since such high values don’t occur in articular cartilage. Spheres with those values are omitted from further analysis. Both, the MRF and CPMG T2 values, are compared to the reference values provided by the manufacturer (considered as ground truth). It can be observed that the MRF T2 values follow the reference values closer than CPMG T2 values. The coefficient of determination between the CPMG and reference and between the MRF and reference T2 values were r2 = 0.979 and r2 = 0.999, respectively. The coefficients of determination of the full range of T1 values between the T1 map and reference, and between the MRF T1 and reference values were r2 = 0.999 in both cases.Nine out of ten volunteers had healthy knee articular cartilage. One volunteer (58y woman) had an early-stage cartilage degeneration in the superior-medial patellar cartilage. All automatic segmentations were successful. Figure 3 depicts a representative slice of the DESS volume with the segmentation result, CPMG and MRF T2 maps, as well as VIBE and MRF T1 maps. In figure 4, the scatterplots between CPMG and MRF T2 values from individual cartilage segments with the regression lines are depicted for each volunteer. The coefficients of determination ranged from 0.263 to 0.747 (mean r2 = 0.492).
In figure 5, the CPMG and MRF T2 maps of patellar cartilage of a focal cartilage lesion are overlaid on the T2-weighted (CPMG) and proton-density (MRF) images. The arrows point to a hyper-intense area, indicating increased T2 values as a result of cartilage degeneration.
Discussion
We have shown that using the phantom there is very high correlation between T1 and T2 values obtained from the conventional and MRF sequences. Although visually the conventional and MRF in vivo T1 and T2 maps were undoubtedly similar, the correlation in automatically segmented cartilage regions remarkably varied between the subjects. The main reason could be the challenging image registration of differently resolved quantitative maps to the DESS sequence due to complex anatomy of the knee joint and relatively low cartilage thickness.Conclusion
MRF in the knee cartilage in combination with automatic segmentation is feasible and can be used in future clinical studies.Acknowledgements
This work was supported by the Austrian Science Fund (FWF) KLI917.References
[1] Li X, Benjamin Ma C, Link TM et al (2007) In vivo T(1rho) and T(2) mapping of articular cartilage in osteoarthritis of the knee using 3 T MRI. Osteoarthritis Cartilage 15:789-797
[2] Sharafi A, Zibetti MVW, Chang G, Cloos M, Regatte RR (2020) MR fingerprinting for rapid simultaneous T1 , T2 , and T1 rho relaxation mapping of the human articular cartilage at 3T. Magn Reson Med 84:2636-2644
[3] Cloos MA, Asslander J, Abbas B et al (2019) Rapid Radial T1 and T2 Mapping of the Hip Articular Cartilage With Magnetic Resonance Fingerprinting. J Magn Reson Imaging 50:810-815
Figures
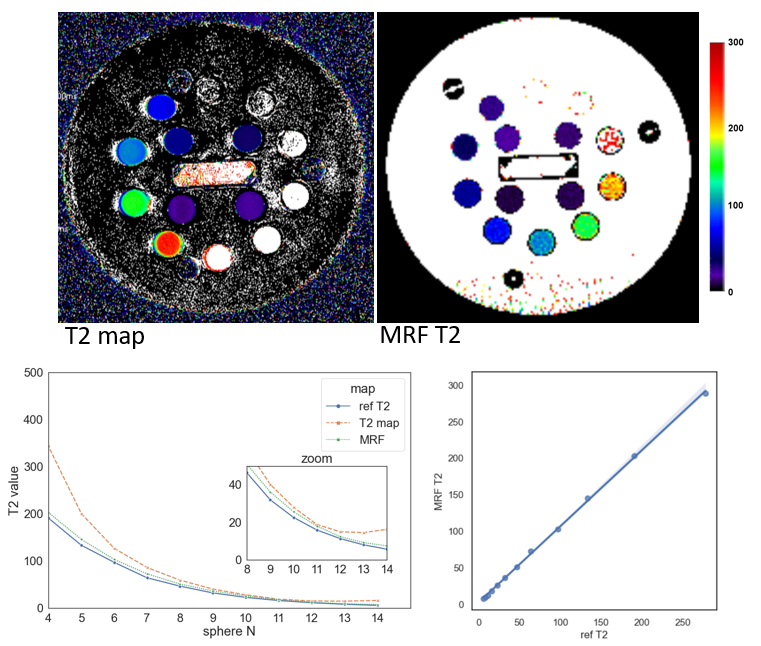
Figure 1: The CPMG and MRF T2 maps of the T2 array of the NIST phantom. The spheres are
designed to have T2 values in an exponentially decreasing manner. Spheres 1 to
3 are omitted, because their T2 values are not relevant in cartilage. The
reference values of induvial spheres are also depicted. The regression between
MRF T2 and reference yielded coefficient of determination r2 =
0.999.
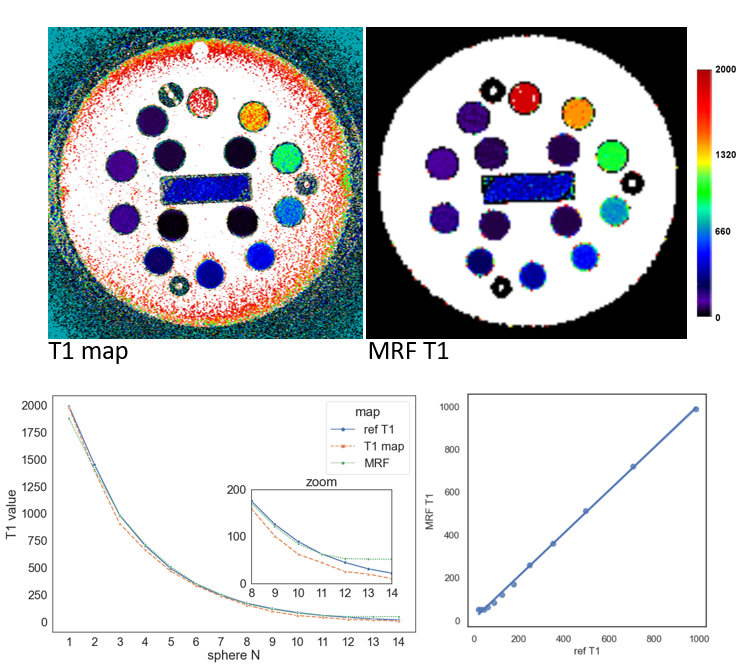
Figure 2: The conventional and MRF T1 maps of the T1 array of the
NIST phantom. Similarly, as T2 spheres, T1 spheres have exponentially
decreasing T1 values. Whole range of T1 values is depicted together with
reference values. The regression between MRF T1 and reference yielded
coefficient of determination r2 = 0.999.
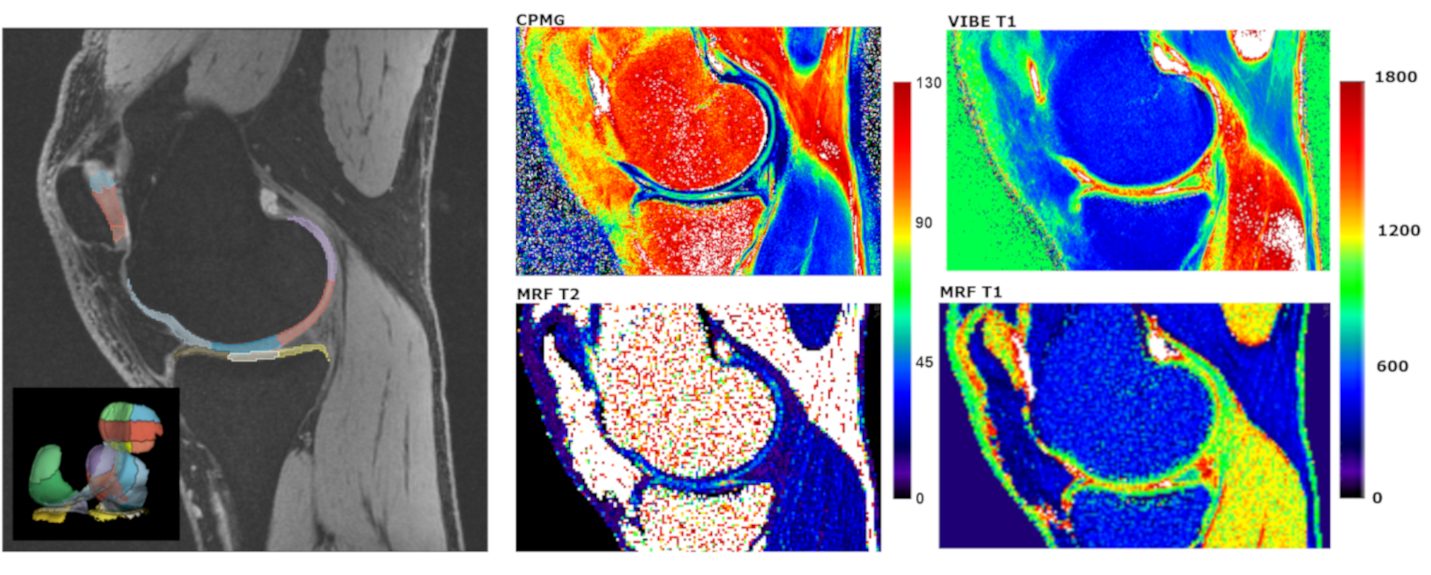
Figure 3: The
representative slice of the DESS volume together with segmentation (left).
Corresponding CPMG T2 map (middle top) and MRF T2 map (middle bottom), as well
as conventional T1 map (right top) and MRF T1 map (right bottom).
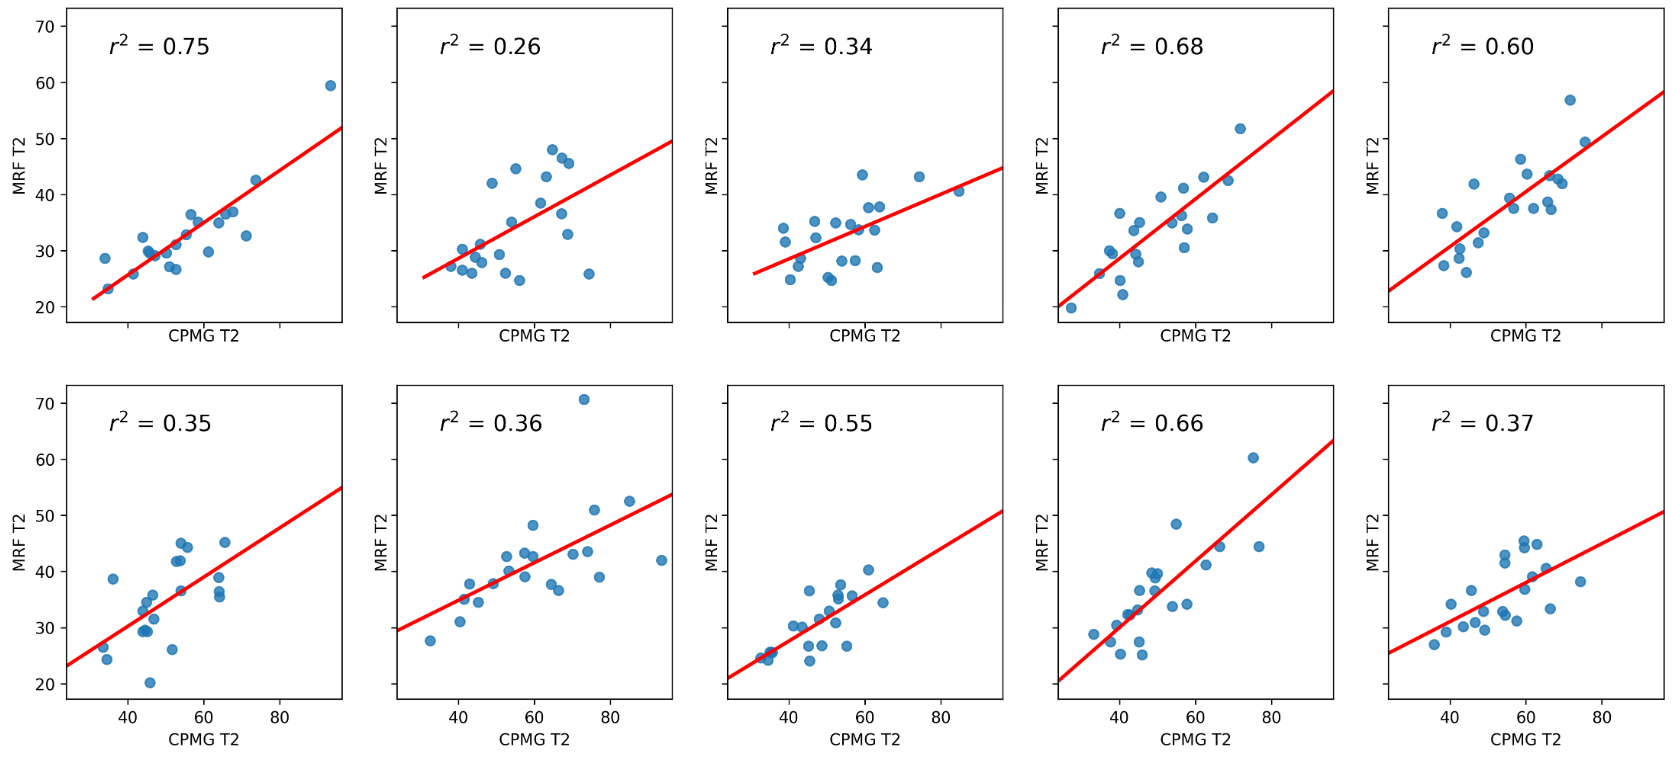
Figure 4: The
scatterplots between CPMG T2 values and MRF T2 values of all the segments of the
segmentation in each of the ten volunteers. The regression coefficients ranged
from 0.263 to 0.747 (mean r2 = 0.492) depending on co-registration
quality.
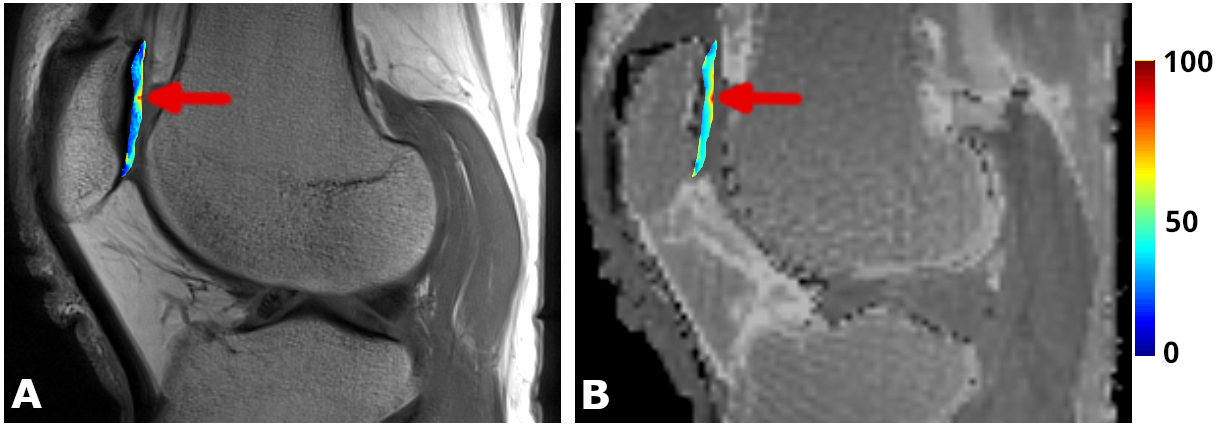
Figure 5:Representative
image of focal cartilage lesion. Arrow points to cartilage area with increased
T2 values, corresponding to underlying early degeneration of the cartilage.
This can be observed in both CPMG and MRF T2 maps.
DOI: https://doi.org/10.58530/2023/1120